. 2016 Aug 1;27(15):2394-403.
doi: 10.1091/mbc.E16-03-0165. Epub 2016 Jun 1.

Tetrahymena Poc1 ensures proper intertriplet microtubule linkages to maintain basal body integrity

Affiliations

Tetrahymena Poc1 ensures proper intertriplet microtubule linkages to maintain basal body integrity

Janet B Meehl et al. Mol Biol Cell. .

Abstract

Basal bodies comprise nine symmetric triplet microtubules that anchor forces produced by the asymmetric beat pattern of motile cilia. The ciliopathy protein Poc1 stabilizes basal bodies through an unknown mechanism. In poc1∆ cells, electron tomography reveals subtle defects in the organization of intertriplet linkers (A-C linkers) that connect adjacent triplet microtubules. Complete triplet microtubules are lost preferentially near the posterior face of the basal body. Basal bodies that are missing triplets likely remain competent to assemble new basal bodies with nine triplet microtubules, suggesting that the mother basal body microtubule structure does not template the daughter. Our data indicate that Poc1 stabilizes basal body triplet microtubules through linkers between neighboring triplets. Without this stabilization, specific triplet microtubules within the basal body are more susceptible to loss, probably due to force distribution within the basal body during ciliary beating. This work provides insights into how the ciliopathy protein Poc1 maintains basal body integrity.


Figures

FIGURE 1:
FIGURE 1:
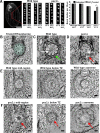
Electron tomography of Tetrahymena basal bodies. Images are oriented such that the top is directed toward the cell’s anterior. Color representations of modeled structures are consistent with each other. (A) Cross-sectional view of the basal body. The cartwheel is at the basal body proximal end and is composed of a hub and nine spokes, which extend to the A-tubules of the basal body wall. (B) Basal body triplet microtubules are spaced at ∼40° increments around the basal body cylinder, highlighted by magenta lines. (C) Longitudinal section of the basal body. The basal body luminal density (LD) is present between the top of the hub and the transition zone (arrowheads). (D) Accessory structures are asymmetrically associated with basal bodies. (E) Specific triplet microtubules, identified by number, are associated with accessory structures. Basal body triplet microtubules, green; kinetodesmal fiber, red; transverse microtubules, yellow; collar, purple; postciliary microtubules, light blue; hub, orange. Scale bars, 50 nm. See Supplemental Video S1.
FIGURE 2:
FIGURE 2:
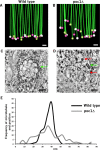
Triplet microtubules are absent in poc1Δ basal bodies. (A) Basal body disassembly in poc1Δ cells is rescued by inhibiting ciliary beating. Left, immunofluorescence image of a wild- type Tetrahymena cell showing the region where basal body number counts were taken. Scale bar, 10 μm. Middle, representative 10-μm insets of basal body rows used for determining basal body number in wild-type and poc1Δ cells. Right, quantification of basal body number per 10 μm in wild-type and poc1Δ cells. *p < 0.001; 300 basal body counts. (B) Triplet microtubules are identified with numbers as indicated. (C) Wild-type basal bodies have nine triplet microtubules (green arrow) with attached spokes (white arrow). (D) Comparable view of a poc1Δ basal body missing a triplet microtubule at position 1 (red arrow). A spoke (white arrow) radiates out toward the gap that is normally occupied by a triplet microtubule. (E, F) Series of tomographic slices through a wild-type basal body (E), and a poc1Δ basal body (F) missing a triplet at position 1 (red arrows) resulting in missing ciliary doublet microtubules. Images are taken at mid basal body (left), just below the transition zone (middle), and at the base of the ciliary axoneme (right). Scale bars, 50 nm.
FIGURE 3:
FIGURE 3:
New poc1Δ basal bodies assemble with nine triplet microtubules. (A) Wild-type basal body duplication; new basal body length, 102 nm. Scale bar, 100 nm. See Supplemental Video S2. (B) The poc1Δ daughter basal body is normal despite the mother basal body missing two triplet microtubules (8 and 9; black arrow). The new basal body contains nine triplet microtubules (new basal body length, 105 nm). Scale bar, 100 nm. See Supplemental Video S3. (C, D) Model views of (C) the new wild-type basal body in A and (D) the new poc1Δ basal body in B. Two microtubules of the new poc1Δ basal body are out of the volume. New basal body triplet microtubules, lavender. Scale bars, 50 nm.
FIGURE 4:
FIGURE 4:
Proximal ends of triplet microtubules are disorganized in poc1Δ basal bodies. (A, B) Triplet microtubules are aligned at the proximal end of the basal body in wild-type cells (A) but are misaligned in poc1Δ basal bodies (B). Triplet microtubules, green; microtubule minus ends, light green (A-tubule), magenta (B-tubule), and white (C-tubule) spheres. Scale bars, 20 nm. (C) Wild-type microtubules originate in a similar plane, both individually and within triplet units (green arrow). (D) The poc1Δ triplet microtubules (red arrows highlight those triplets displaying only a visible A-tubule) and also whole triplet units (green arrow) are staggered at the basal body proximal end. (E) Frequency distribution of microtubule minus ends, demonstrating a tight distribution of wild-type microtubule minus ends (black) distinct from the broad distribution of poc1Δ microtubule minus ends (gray), p < 0.001. Five basal bodies each for wild type (135 microtubule ends) and poc1Δ (129 microtubule ends). Scale bars, 50 nm.
FIGURE 5:
FIGURE 5:
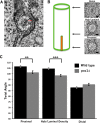
Poc1 loss disrupts the twist angle of triplet microtubule blades along the length of the basal body. (A) The twist angle is measured at the intersection of a line from the basal body center to the A-tubule and a line that bisects the triplet microtubules (black lines). The red arc denotes the measured angle (θ). (B) Schematic view of the basal body, with arrows indicating the positions of measurements and corresponding tomographic views. (C) Twist angle measurements for wild-type (black) and poc1Δ (gray) basal bodies. The mean with SE bars is displayed; **p < 0.005, ***p < 0.001. Wild-type data set: proximal, 90 angles (10 basal bodies); hub/luminal density interface, 90 angles (10 basal bodies); distal, 45 angles (five basal bodies). The poc1Δ data set: proximal, 58 angles (seven basal bodies); hub/luminal density, 87 angles (10 basal bodies); distal, 69 angles (eight basal bodies). Scale bars, 50 nm.
FIGURE 6:
FIGURE 6:
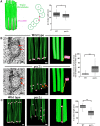
Poc1 is required for connections between triplet microtubules. (A) Left, diagram of a basal body with triplet microtubules and A-C linkers. Middle, schematic of A-C linker placement relative to the A-tubule from one triplet and the C-tubule of its neighbor. Red asterisks indicate the width measurement graphed on the right. Right, box-and-whisker plot showing the median, first and third quartile, minimum, and maximum measurements of A-C linker width. *p < 0.05; wild type, N = 54; poc1Δ, N = 49. (B) Wild-type A-C linker proximal position vs. poc1Δ A-C linker proximal position. Left, tomographic cross sections at basal body proximal ends. Red arrows highlight A-C linkers (in wild type) or lack of A-C linkers (in poc1Δ). Middle, positions of the A-C linker proximal ends are depicted as pink bars. Bottom middle, red arrows correspond to red arrows on the left, demonstrating that the proximal ends of these A-C linkers emerge more distally than others in the same basal body. Yellow line from the A-tubule minus end to the emergence of the A-C linker demonstrates how the measurements included in the box-and-whisker plot on the far right were made. Far right, box-and-whisker plot of the median, first and third quartile, minimum, and maximum measurements of A-C linker proximal placement in wild-type and poc1Δ basal bodies. ***p < 0.001; wild type, N = 21; poc1Δ. N = 22. (C) Models of basal bodies in longitudinal view showing the A-C linker boundaries in pink. Left, wild type; second, poc1Δ; third, schematic illustrating how the A-C linker span is measured (yellow line); far right, box-and-whisker plot of the median, first and third quartile, minimum, and maximum measurements of A-C linker length in wild-type and poc1Δ basal bodies. ***p < 0.001; wild-type, N = 45; poc1Δ, N = 40. Triplet microtubules, green; A-C linker boundaries, pink. Scale bars, 50 nm (B, left), 20 nm (B, middle, C). See Supplemental Videos S4 and S5.

References

    1. Abal M, Keryer G, Bornens M. Centrioles resist forces applied on centrosomes during G2/M transition. Biol Cell. 2005;97:425–434. - PubMed
    1. Albrecht-Buehler G. The iris diaphragm model of centriole and basal body formation. Cell Motil Cytoskeleton. 1990;17:197–213. - PubMed
    1. Allen RD. The morphogenesis of basal bodies and accessory structures of the cortex of the ciliated protozoan Tetrahymena pyriformis. J Cell Biol. 1969;40:716–733. - PMC - PubMed
    1. Alvey PL. Do adult centrioles contain cartwheels and lie at right angles to each other. Cell Biol Int Rep. 1986;10:589–598. - PubMed
    1. Andersen JS, Wilkinson CJ, Mayor T, Mortensen P, Nigg EA, Mann M. Proteomic characterization of the human centrosome by protein correlation profiling. Nature. 2003;426:570–574. - PubMed

Publication types

Substances