

Spatial transmission and meteorological determinants of tuberculosis incidence in Qinghai Province, China: a spatial clustering panel analysis
- PMID: 27251154
- PMCID: PMC4890510
- DOI: 10.1186/s40249-016-0139-4
Spatial transmission and meteorological determinants of tuberculosis incidence in Qinghai Province, China: a spatial clustering panel analysis
Abstract
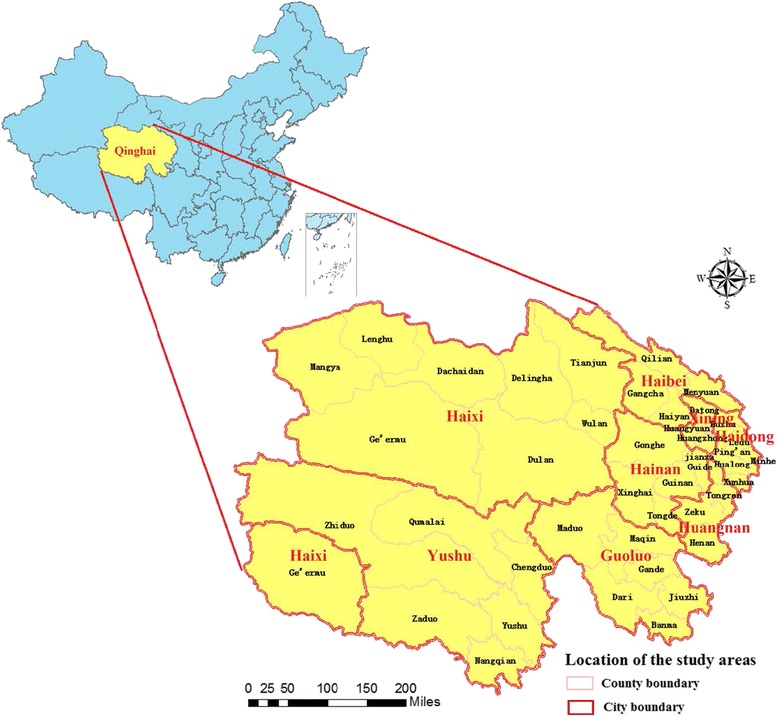
Background: Tuberculosis (TB) is the notifiable infectious disease with the second highest incidence in the Qinghai province, a province with poor primary health care infrastructure. Understanding the spatial distribution of TB and related environmental factors is necessary for developing effective strategies to control and further eliminate TB.
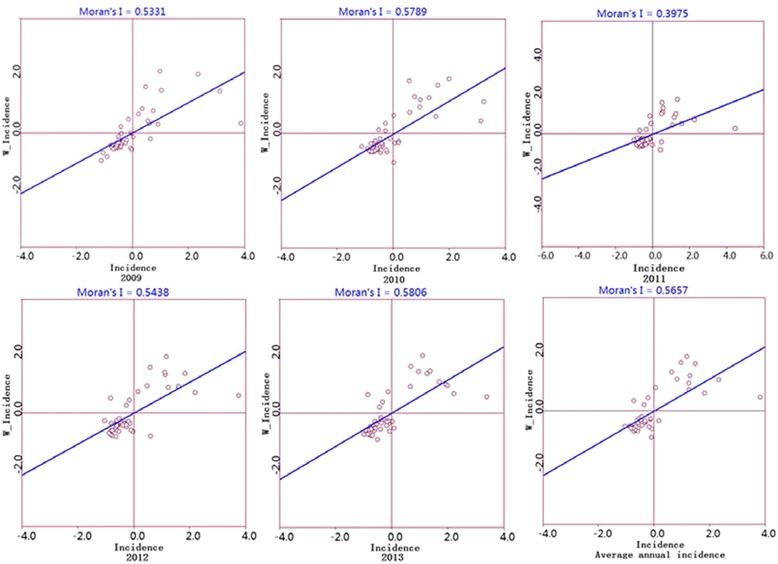
Methods: Our TB incidence data and meteorological data were extracted from the China Information System of Disease Control and Prevention and statistical yearbooks, respectively. We calculated the global and local Moran's I by using spatial autocorrelation analysis to detect the spatial clustering of TB incidence each year. A spatial panel data model was applied to examine the associations of meteorological factors with TB incidence after adjustment of spatial individual effects and spatial autocorrelation.
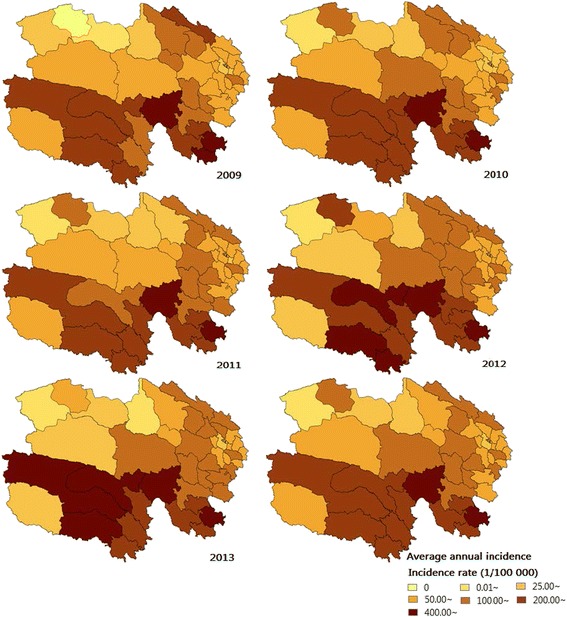
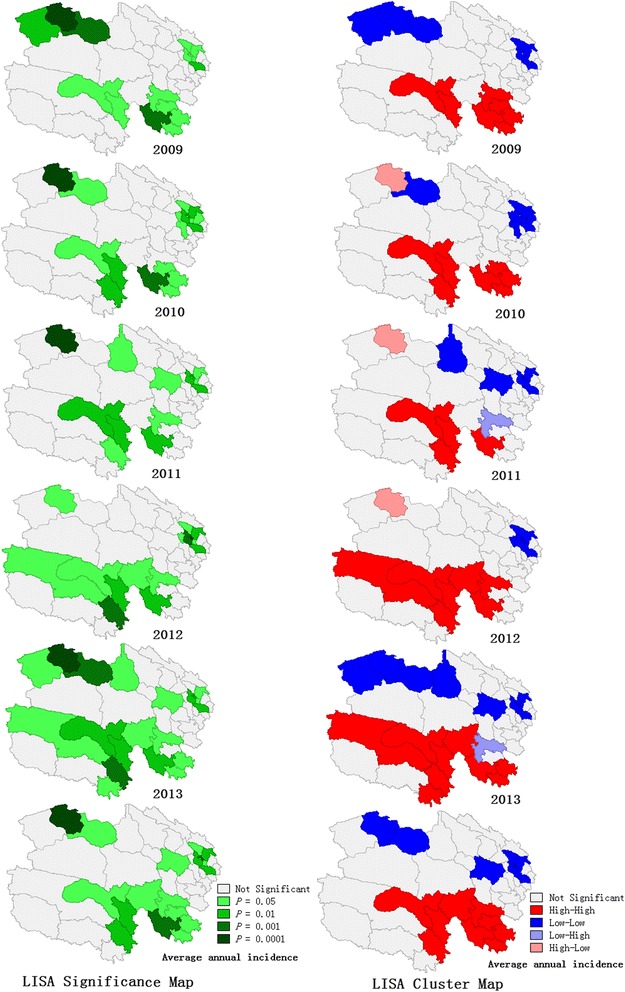
Results: The Local Moran's I method detected 11 counties with a significantly high-high spatial clustering (average annual incidence: 294/100 000) and 17 counties with a significantly low-low spatial clustering (average annual incidence: 68/100 000) of TB annual incidence within the examined five-year period; the global Moran's I values ranged from 0.40 to 0.58 (all P-values < 0.05). The TB incidence was positively associated with the temperature, precipitation, and wind speed (all P-values < 0.05), which were confirmed by the spatial panel data model. Each 10 °C, 2 cm, and 1 m/s increase in temperature, precipitation, and wind speed associated with 9 % and 3 % decrements and a 7 % increment in the TB incidence, respectively.
Conclusions: High TB incidence areas were mainly concentrated in south-western Qinghai, while low TB incidence areas clustered in eastern and north-western Qinghai. Areas with low temperature and precipitation and with strong wind speeds tended to have higher TB incidences.
Keywords: Meteorological factors; Spatial clustering; Spatial panel data model; Tuberculosis incidence.
Figures
Similar articles
-
[Spatial distribution characteristics of tuberculosis and its visualization in Qinghai province, 2014-2016].Zhonghua Liu Xing Bing Xue Za Zhi. 2018 Mar 10;39(3):347-351. doi: 10.3760/cma.j.issn.0254-6450.2018.03.019. Zhonghua Liu Xing Bing Xue Za Zhi. 2018. PMID: 29609252 Chinese.
-
[Analysis on spatial distribution of tuberculosis in China, 2012-2014].Zhonghua Liu Xing Bing Xue Za Zhi. 2017 Jul 10;38(7):926-930. doi: 10.3760/cma.j.issn.0254-6450.2017.07.016. Zhonghua Liu Xing Bing Xue Za Zhi. 2017. PMID: 28738468 Chinese.
-
Spatio-temporal analysis of the relationship between climate and hand, foot, and mouth disease in Shandong province, China, 2008-2012.BMC Infect Dis. 2015 Mar 24;15:146. doi: 10.1186/s12879-015-0901-4. BMC Infect Dis. 2015. PMID: 25887074 Free PMC article.
-
Methods used in the spatial analysis of tuberculosis epidemiology: a systematic review.BMC Med. 2018 Oct 18;16(1):193. doi: 10.1186/s12916-018-1178-4. BMC Med. 2018. PMID: 30333043 Free PMC article.
-
Association between averaged meteorological factors and tuberculosis risk: A systematic review and meta-analysis.Environ Res. 2022 Sep;212(Pt D):113279. doi: 10.1016/j.envres.2022.113279. Epub 2022 May 11. Environ Res. 2022. PMID: 35561834
Cited by
-
Analyzing the seasonality of tuberculosis case notifications in the UK, 2000-2018.Epidemiol Infect. 2024 Oct 1;152:e108. doi: 10.1017/S095026882400092X. Epidemiol Infect. 2024. PMID: 39351675 Free PMC article.
-
The effects of meteorological factors and air pollutants on the incidence of tuberculosis in people living with HIV/AIDS in subtropical Guangxi, China.BMC Public Health. 2024 May 17;24(1):1333. doi: 10.1186/s12889-024-18475-0. BMC Public Health. 2024. PMID: 38760740 Free PMC article.
-
Spatial spillover effect of environmental factors on the tuberculosis occurrence among the elderly: a surveillance analysis for nearly a dozen years in eastern China.BMC Public Health. 2024 Jan 17;24(1):209. doi: 10.1186/s12889-024-17644-5. BMC Public Health. 2024. PMID: 38233763 Free PMC article.
-
The spatiotemporal distribution of human brucellosis in mainland China from 2007-2016.BMC Infect Dis. 2020 Mar 27;20(1):249. doi: 10.1186/s12879-020-4946-7. BMC Infect Dis. 2020. PMID: 32216760 Free PMC article.
-
Using the Kulldorff's scan statistical analysis to detect spatio-temporal clusters of tuberculosis in Qinghai Province, China, 2009-2016.BMC Infect Dis. 2017 Aug 21;17(1):578. doi: 10.1186/s12879-017-2643-y. BMC Infect Dis. 2017. PMID: 28826399 Free PMC article.
References
MeSH terms
LinkOut - more resources
Full Text Sources
Other Literature Sources
Medical
