. 2016 Jun 2;534(7605):106-10.
doi: 10.1038/nature17961.

The gene cortex controls mimicry and crypsis in butterflies and moths

Affiliations

The gene cortex controls mimicry and crypsis in butterflies and moths

Nicola J Nadeau et al. Nature. .

Abstract

The wing patterns of butterflies and moths (Lepidoptera) are diverse and striking examples of evolutionary diversification by natural selection. Lepidopteran wing colour patterns are a key innovation, consisting of arrays of coloured scales. We still lack a general understanding of how these patterns are controlled and whether this control shows any commonality across the 160,000 moth and 17,000 butterfly species. Here, we use fine-scale mapping with population genomics and gene expression analyses to identify a gene, cortex, that regulates pattern switches in multiple species across the mimetic radiation in Heliconius butterflies. cortex belongs to a fast-evolving subfamily of the otherwise highly conserved fizzy family of cell-cycle regulators, suggesting that it probably regulates pigmentation patterning by regulating scale cell development. In parallel with findings in the peppered moth (Biston betularia), our results suggest that this mechanism is common within Lepidoptera and that cortex has become a major target for natural selection acting on colour and pattern variation in this group of insects.


Figures

Extended Data Figure 1
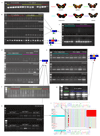
A) Exons and splice variants of cortex in Hm. Orientation is reversed with respect to figures 2 and 4, with transcription going from left to right. SNPs showing the strongest associations with phenotype are shown with stars. B) Differential expression of two regions of cortex between Hm amaryllis and Hm aglaope whole hindwings (N=11 and N=10 respectively). Boxplots are standard (median; 75th and 25th percentiles; maximum and minimum excluding outliers – shown as discrete points) C) Expression of a cortex isoform lacking exon 3 is found in Hm aglaope but not Hm amaryllis hindwings. D) Expression of an isoform lacking exon 5 is found in Hm rosina but not Hm melpomene hindwings. Green triangles indicate predicted start codons and red triangles predicted stop codons, with usage dependent on which exons are present in the isoform. Schematics of the targeted exons are shown for each (q)RT-PCR product, black triangles indicate the position of the primers used in the assay.
Extended Data Figure 2
Alignments of de novo assembled fragments containing the top associated SNPs from Hm and related taxa short-read data. Identified indels do not show stronger associations with phenotype that those seen at SNPs (as shown in Extended Data Table 2), although some near-perfect associations are seen in fragment C. Black regions = missing data; yellow box = individuals with a hindwing yellow bar; blue box = individuals with a yellow forewing band.
Extended Data Figure 3
Sequencing of long-range PCR products and fosmids spanning cortex. A) Sequence read coverage from long-range PCR products across the cortex coding region from 2 Hm races. B) Minor allele frequency difference from these reads between Hm aglaope and Hm amaryllis. Exons of cortex are indicated by boxes, numbered as in Extended Data Figure 2. C) Alignments of sequenced fosmids overlapping cortex from 3 Hm individuals of difference races. No major rearrangements are observed, nor any major differences in transposable element (TE) content between closely related races with different colour patterns (melpomene/rosina or amaryllis/aglaope). Hm amaryllis and rosina have the same phenotype, but do not share any TEs that are not present in the other races. Hm_BAC = BAC reference sequence, Hm_mel = melpomene from new unpublished assembly of Hm genome, Hm_ros = rosina (2 different alleles were sequenced from this individual), Hm_ama = amaryllis (2 non-overlapping clones were sequenced in this individual), Hm_agla = aglaope (4 clones were sequenced in this individual 2 of which represent alternative alleles). Alignments were performed with Mauve: coloured bars represent homologous genomic regions. cortex is annotated in black above each clone. Variable TEs are shown as coloured bars below each clone: red = Metulj-like non-LTR, yellow = Helitron-like DNA, grey = other.
Extended Data Figure 4
Expression array results for additional stages, related to Figure 4. A-G: comparisons between races (H. m. plesseni and H. m. malleti) for 3 wing regions. H-N: comparisons between proximal and distal forewing regions for each race. Significance values (-log10(p-value)) are shown separately for genes in the HmYb region from the gene array (A,D,F,H,K,M) and for the HmYb tiling array (B,E,G,I,L,N) for day 1 (A,B,H,I), day 5 (D,E,K,L) and day 7 (F,G,M,N) after pupation. The level of expression difference (log fold change) for tiling probes showing significant differences (p≤0.05) is shown for day 1 (C and J) with probes in known cortex exons shown in dark colours and probes elsewhere shown as pale colours.
Extended Data Figure 5
Alternative splicing of cortex. A) Amplification of the whole cortex coding region, showing the diversity of isoforms and variation between individuals. B) Differences in splicing of exon 3 between H. m. aglaope and H. m. amaryllis. Products amplified with a primer spanning the exon 2/4 junction at 3 developmental stages. The lower panel shows verification of this assay by amplification between exons 2 and 4 for the same final instar larval samples (replicated in Extended Data Figure 2C) C) Lack of consistent differences between H. m. melpomene and H. m. rosina in splicing of exon 3. Top panel shows products amplified with a primer spanning the exon 2/4 junction, lower panel is the same samples amplified between exons 2 and 4. D) Differences in splicing of exon 5 between H. m. melpomene and H. m. rosina. Products amplified with a primer spanning the exon 4/6 junction at 3 developmental stages. E) Subset of samples from D amplified with primers between exons 4 and 6 for verification (middle, 24hr pupae samples are replicated in Extended Data Figure 2D). F) Lack of consistent differences between H. m. aglaope and H. m. amaryllis in splicing of exon 5. Products amplified with a primer spanning the exon 4/6 junction. G) H. m. cythera also expresses the isoform lacking exon 5, while a pool of 6 H. m. malleti individuals do not. H) Expression of the isoform lacking exon 5 from an F2 H. m. melpomene x H. m. rosina cross. Individuals homozygous or heterozygous for the H. m. rosina HmYb allele express the isoform while those homozygous for the H. m. melpomene HmYb allele do not. I) Allele specific expression of isoforms with and without exon 5. Heterozygous individuals (indicated with blue and red stars) express only the H. m. rosina allele in the isoform lacking exon 5 (G at highlighted position), while they express both alleles in the isoform containing exon 5 (G/A at this position).
Extended Data Figure 6
Phylogeny of fizzy family proteins and effects of expressing cortex in the Drosophila wing. A) Neighbour joining phylogeny of Fizzy family proteins including functionally characterised proteins (in bold) from Saccharomyces cerevisiae, Homo sapiens and Drosophila melanogaster as well as copies from the basal metazoan Trichoplax adhaerens and a range of annotated arthropod genomes (Daphnia pulex, Acyrthosiphon pisum, Pediculus humanus, Apis mellifica, Nasonia vitripennis, Anopheles gambiae, Tribolium castaneum) including the lepidoptera H. melpomene (in blue), Danaus plexippus and Bombyx mori. Branch colours: dark blue, CDC20/fzy; light blue, CDH1/fzr/rap; red, lepidoptran cortex. B-E) Ectopic expression of cortex in Drosophila melanogaster. Drosophila cortex produces an irregular microchaete phenotype when expressed in the posterior compartment of the fly wing (C) whereas Heliconius cortex does not (D), when compared to no expression (B). A, anterior; P, posterior. Successful Heliconius cortex expression was confirmed by anti-HA IHC in the last instar Drosophila larva wing imaginal disc (D, red), with DAPI staining in blue.
Figure 1
Figure 1
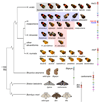
A homologous genomic region controls a diversity of phenotypes across the Lepidoptera. Left: phylogenetic relationships. Right: chromosome maps with colour pattern intervals in grey, coloured bars represent markers used to assign homology,–, the first and last genes from Fig 2 shown in red. In He the HeCr locus controls the yellow hind-wing bar phenotype (grey boxed races). In Hm it controls both the yellow hind-wing bar (HmYb, pink box) and the yellow forewing band (HmN, blue box). In Hn it modulates black, yellow and orange elements on both wings (HnP), producing phenotypes that mimic butterflies in the genus Melinaea. Morphs/races of Heliconius species included in this study are shown with names.
Figure 2
Figure 2
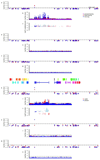
Association analyses across the genomic region known to contain major colour pattern loci in Heliconius. A) Association in He with the yellow hind-wing bar (n=45). Coloured SNPs are fixed for a unique state in He demophoon (orange) or He favorinus (purple). B) Genes in He with direct homologs in Hm. Genes are in different colours with exons (coding and UTRs) connected by a line. Grey bars are transposable elements. C) Hm genes and transposable elements: colours correspond to homologous He genes; MicroRNAs in black. D) Association in the Hm/timareta/silvaniform group with the yellow hind-wing bar (red) and yellow forewing band (blue) (n=49). E) Association in Hn with the bicoloratus morph (n=26); inversion positions shown below. In all cases black/dark coloured points are above the strongest associations found outside the colour pattern scaffolds (He p=1.63e-05; Hm p=2.03e-05 and p=2.58e-05; Hn p=6.81e-06).
Figure 3
Figure 3
Differential gene expression across the genomic region known to contain major colour pattern loci in Heliconius melpomene. Expression differences in day 3 pupae, for all genes in the Yb interval (A,D) and tiling probes spanning the central portion of the interval (B,C,E,F). Expression is compared between races for each wing region (A,B,C) and between proximal and distal forewing sections for each race (D,E,F). C and F: magnitude and direction of expression difference (log2 fold-change) for tiling probes showing significant differences (p≤0.05); probes in known cortex exons shown in dark colours. Gene HM00052 was differentially expressed between other races in RNA sequence data (Supplementary Information) but is not differentially expressed here.
Figure 4
Figure 4
In situ hybridisations of cortex in hind-wings of final instar larvae. B) Hn tarapotensis; adult wing shown in A, coloured points indicate landmarks, yellow arrows highlight adult pattern elements corresponding to the cortex staining. D) Hm rosina; adult wing shown in C, staining patterns in other Hm races (meriana and aglaope) appeared similar. The probe used was complementary to the cortex isoform with the longest open reading frame (also the most common, Supplementary Information).

Similar articles

Cited by

References

    1. Cook LM, Grant BS, Saccheri IJ, Mallet J. Selective bird predation on the peppered moth: the last experiment of Michael Majerus. Biol Lett. 2012;8:609–612. - PMC - PubMed
    1. Jiggins CD. Ecological Speciation in Mimetic Butterflies. BioScience. 2008;58:541–548.
    1. Dawson IA, Roth S, Artavanis-Tsakonas S. The Drosophila Cell Cycle Gene fizzy Is Required for Normal Degradation of Cyclins A and B during Mitosis and Has Homology to the CDC20 Gene of Saccharomyces cerevisiae. J Cell Biol. 1995;129:725–737. - PMC - PubMed
    1. Van’t Hof AE, et al. The industrial melanism mutation in British peppered moths is a transposable element. Nature. This issue. - PubMed
    1. Joron M, et al. A Conserved Supergene Locus Controls Colour Pattern Diversity in Heliconius Butterflies. PLoS Biol. 2006;4 - PMC - PubMed

Publication types