. 2016 Jun 2;534(7605):115-8.
doi: 10.1038/nature17955. Epub 2016 May 23.

A shared neural ensemble links distinct contextual memories encoded close in time

Affiliations

A shared neural ensemble links distinct contextual memories encoded close in time

Denise J Cai et al. Nature. .

Abstract

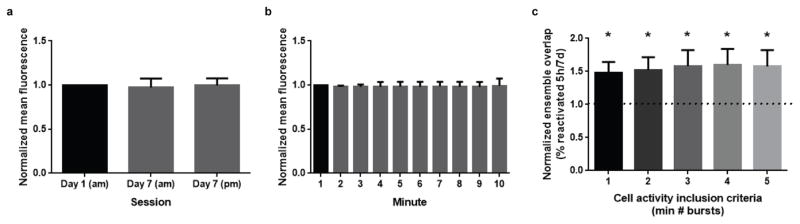
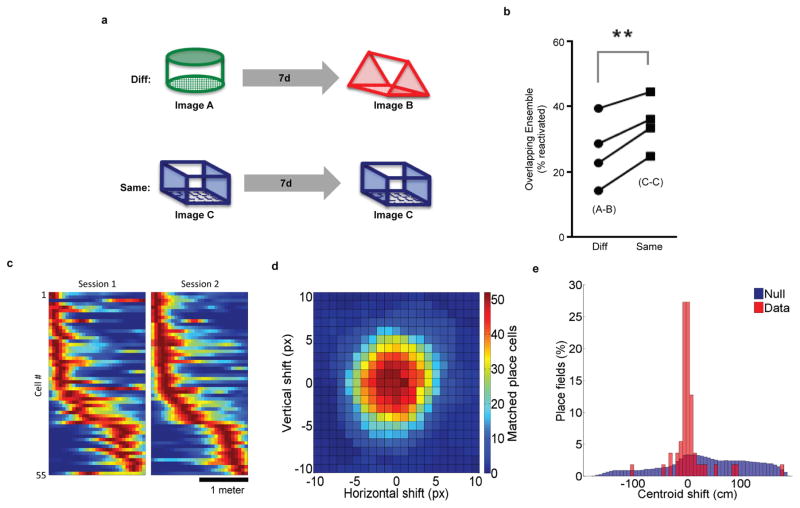
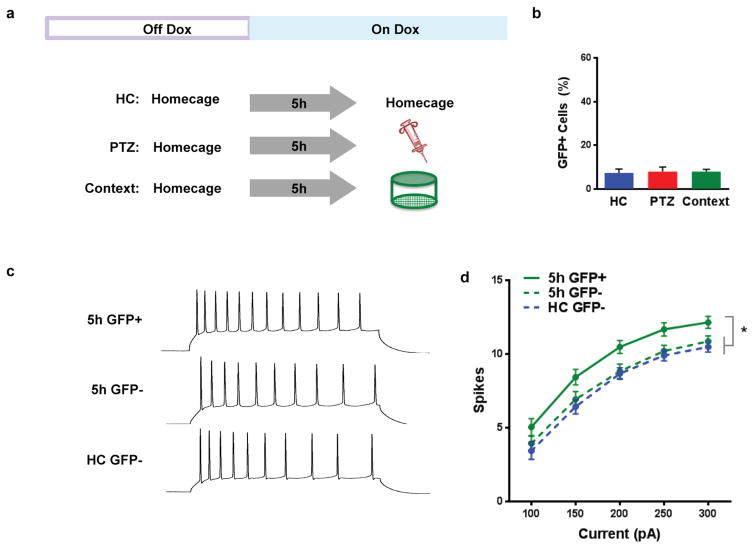
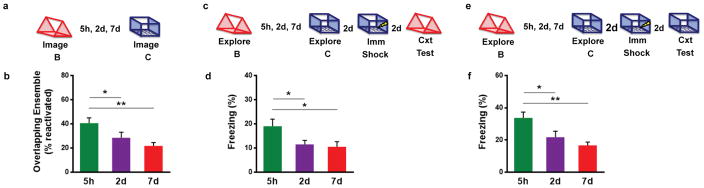
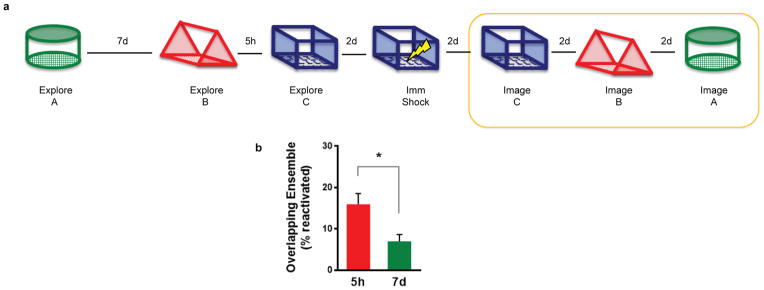
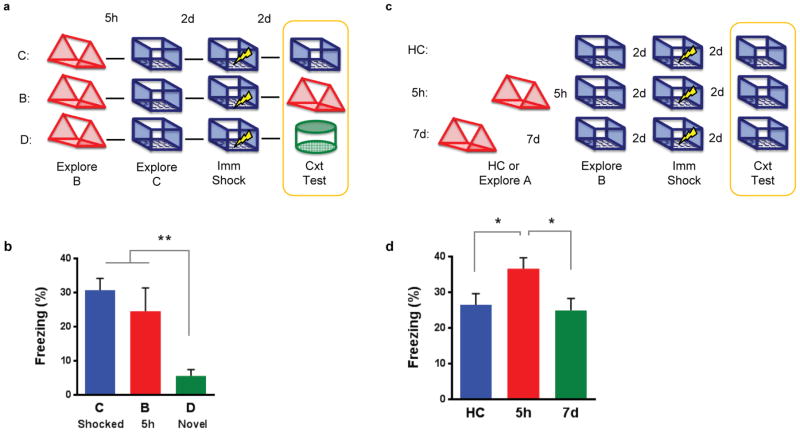
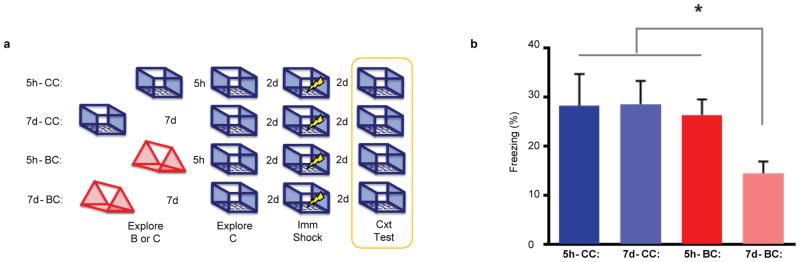
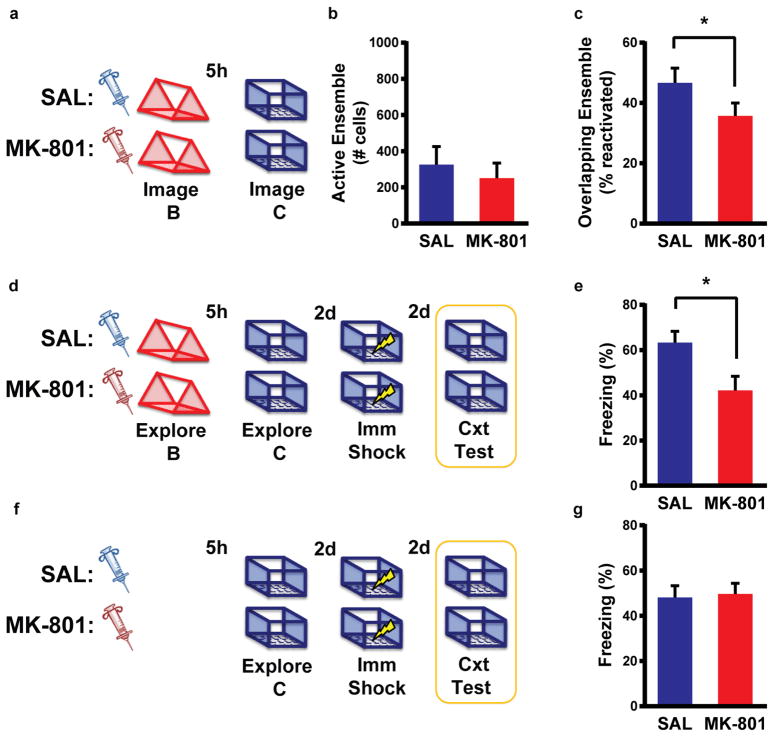
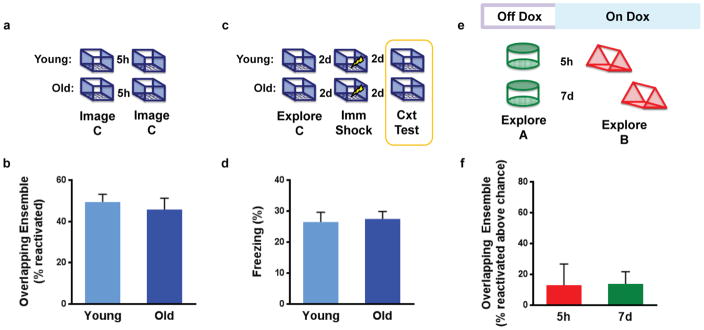
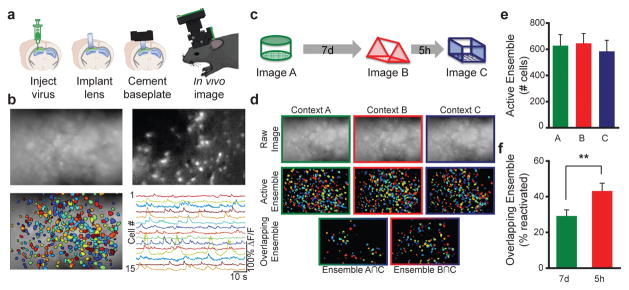
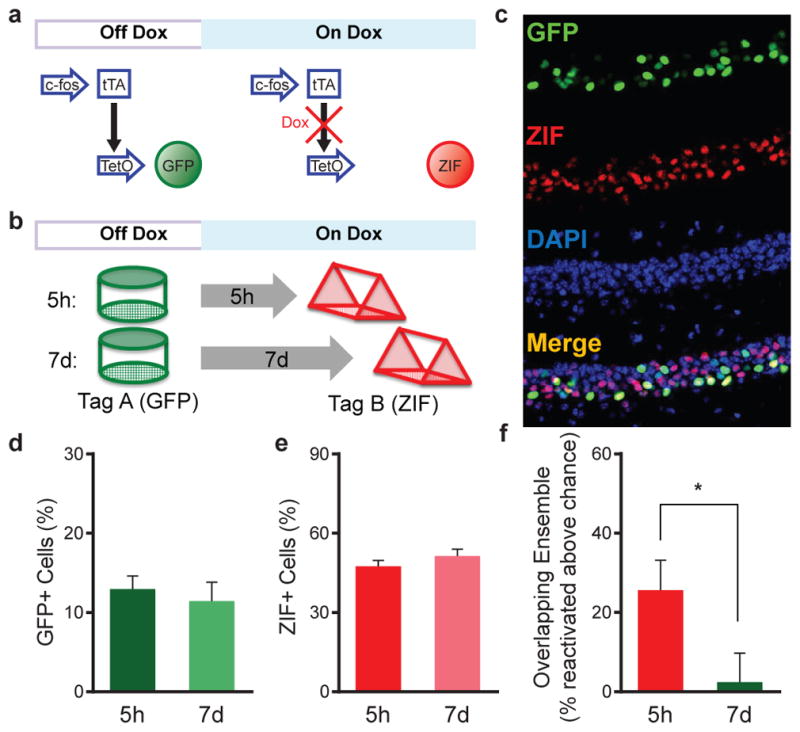
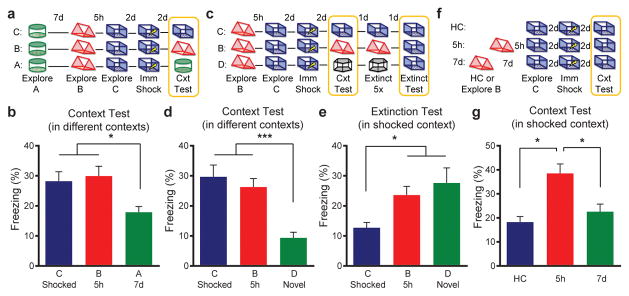
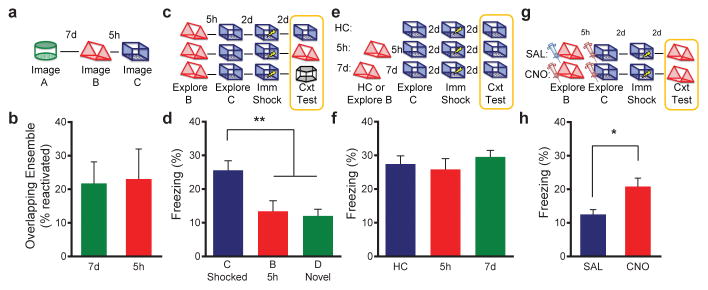
Recent studies suggest that a shared neural ensemble may link distinct memories encoded close in time. According to the memory allocation hypothesis, learning triggers a temporary increase in neuronal excitability that biases the representation of a subsequent memory to the neuronal ensemble encoding the first memory, such that recall of one memory increases the likelihood of recalling the other memory. Here we show in mice that the overlap between the hippocampal CA1 ensembles activated by two distinct contexts acquired within a day is higher than when they are separated by a week. Several findings indicate that this overlap of neuronal ensembles links two contextual memories. First, fear paired with one context is transferred to a neutral context when the two contexts are acquired within a day but not across a week. Second, the first memory strengthens the second memory within a day but not across a week. Older mice, known to have lower CA1 excitability, do not show the overlap between ensembles, the transfer of fear between contexts, or the strengthening of the second memory. Finally, in aged mice, increasing cellular excitability and activating a common ensemble of CA1 neurons during two distinct context exposures rescued the deficit in linking memories. Taken together, these findings demonstrate that contextual memories encoded close in time are linked by directing storage into overlapping ensembles. Alteration of these processes by ageing could affect the temporal structure of memories, thus impairing efficient recall of related information.


Conflict of interest statement

The authors declare no competing financial interests.

Figures

Extended Data Figure 1
Extended Data Figure 1. Stability of fluorescence and overlap
a, Average normalized mean fluorescence within session. There was no difference between the mean fluorescence across the 3 sessions (one-way repeated measures ANOVA, F2,7 = 0.423, n.s.). b, Average normalized mean fluorescence within session. There was no difference between the mean fluorescence across a 10-minute session (one-way repeated measures ANOVA, F9,22 = 1.108, n.s.). Results show mean +/− s.d. c, Higher ensemble overlap with 5h interval than 7d. Normalized ensemble overlap is calculated as the ensemble overlap between contexts separated by 5h divided by the ensemble overlap between contexts separated by 7d. A normalized overlap value of 1 signifies that there is no difference between the overlap at 5h and 7d. The minimum number of calcium events required from each cell for the cell to be considered “active” (inclusion criteria) was systematically increased and the ratio of the ensemble overlap for the different context was calculated. For all inclusion criteria, there is higher ensemble overlap with a 5h than 7d interval (one-sample t-test against 1,(1) t7 = 3.00, p=0.02, (2) t7 = 2.57, p=0.04, (3) t7 = 2.42, p=0.04, (4) t7 = 2.50, p=0.04, (5) t7 = 2.32, p=0.05. Results show mean +/− sem.
Extended Data Figure 2
Extended Data Figure 2. Neural ensembles of environments are reliably reactivated at recall of an open field and linear track
a, Experimental design. Mice were imaged while exploring contexts A and B separated by 7d and imaged while exploring contexts C and C separated by 7d. b, There was a higher percent of cells reactivated when animals explored the same context (C–C) than when animals explored different contexts (A–B) (paired t-test, t3 = 6.305, p=0.0081, n=4). c, Mice were trained to run on a 2-meter linear track with the miniature microscope for water rewards. Mice were trained 3 days a week for 3 weeks with a delay interval of 2–3 days between each session. Place fields were calculated by deconvolving calcium dF/F traces with an exponential to extract approximate spike times. Spikes that remained after crosstalk removal were included for analysis. Animal position was extracted using an automated LED tracking algorithm. A speed threshold (3cm/s) was applied to both the animal position and extracted spike timing and the resulting data was spatially binned (6.5cm bins). Spatial firing rates were calculated by dividing the binned spike counts by the binned occupancy and smoothing with a Gaussian filter (sigma=6.5cm). Cells which showed consistent spatial firing modulation on at least 3 trials, with all other trials showing no bursting activity, were considered as place cells. Normalized spatial firing rates of all matched cells independently meeting the place cell criteria for both days. The data are pooled across 3 mice and include both motion directions. Place fields are ordered by centroid location on session 2. d, A shift of the image registration between sessions results in a decrease in matched place cells. A translational shift both horizontally and vertically was applied to the image registration transformation used in A. Cells were then matched across days and those which met our place cell criteria were kept. The heat map shows the count of matched place cells with a centroid shift of the place field that is less than 33cm. Optimum matching of cells occurred within a 1-pixel translation of the calculated alignment transformation. e, Distribution of centroid shifts of place fields shown in A compared to the null hypothesis that the cell matching between sessions matches random cells.
Extended Data Figure 3
Extended Data Figure 3. Five hours after exploration of a context, GFP expression is shut off by doxycycline and excitability is increased
a, Experimental design. Mice were removed from low levels of dox (40mg/kg) and given regular chow for 3 days to open up the GFP tagging window. After receiving administration of high dox (1g/kg) for 5h, mice were injected with 30mg/kg of pentylenetetrazole (PTZ), exposed to a novel context or left in their homecage. An hour later, mice were transcardially perfused and processed for GFP expression. b, There was no difference in GFP expression between the 3 groups (one-way ANOVA, F2,5 = 0.04, n.s., n=3,3,2), demonstrating that 5h was enough time for dox (1g/kg) to suppress expression of new GFP. c, To test excitability learning-related excitability changes, mice explored a novel context and then were administered high dox to shut off new GFP. Five hours later, mice were sacrificed for in vitro slice physiology. d, A two-way repeated measures ANOVA (group × current step) had a significant main effect of group (F2,68 = 4.20, p<0.05, n=21,29,21). 5h GFP+ group had more spikes than the 5h GFP- group (t68 = 2.31, p<0.05) and HC GFP- (t68 = 2.72, p<0.05). There was no difference between 5h GFP- and HC GFP- groups (t68 = 0.61, n.s.). Results show mean +/− sem.
Extended Data Figure 4
Extended Data Figure 4. Time-course for neuronal overlap and behavioral linking
a, Design for Ca2+ imaging of neuronal overlap experiment. b, There was a significant difference in overlap across groups (one-way repeated measures ANOVA, F2,12 = 12.43, p=0.002, n=7). There was more overlap at 5h than 2d (t12 = 3.03, p=0.01) and 7d (t12 = 4.72, p=0.0005). c, Design for transfer of fear experiment. d, There was a significant difference in freezing across groups (one-way ANOVA, F2,43 = 3.55, p=0.04, n=20,14,12). There was more freezing at 5h than 2d (t43= 2.13, p=0.04) and 7d (t43 = 2.31, p=0.03). e, Design for enhancement experiment. f, There was a significant difference in freezing across groups (one-way ANOVA, F2,45 = 6.38, p=0.004, n=22,14,12). There was more freezing at 5h than 2d (t45 = 2.45, p=0.02) and 7d (t45 = 3.32, p=0.002). Results show mean +/− sem.
Extended Data Figure 5
Extended Data Figure 5. Calcium imaging during retrieval
a, Design for Ca2+ imaging of neuronal overlap at retrieval. Order of contexts during retrieval was counterbalanced. b, There was higher overlap of the neuronal ensemble at 5h than 7d (paired t-test, t7 = 2.55, p=0.04, n=8). Results show mean +/− sem.
Extended Data Figure 6
Extended Data Figure 6. Replication of memory linking experiments in young (3–6 month old) C57Bl/6NIA mice
a, Design for transfer of fear experiment. b, There was a significant difference in freezing across the groups (one-way ANOVA, F2,20 = 9.49, p=0.001, n=8,7,8). There was no difference between freezing levels in context C or B (t20= 0.99, n.s.). Animals had less freezing in context D than C (t20 = 4.19, p=0.0004) and B (t20 = 3.06, p=0.006). c, Design for enhancement experiment. d, There was a significant difference in freezing (one-way ANOVA, F2,46 = 4.071, p=0.023, n=16,17,16). The 5h group had more freezing than the HC group (t46 = 2.72, p=0.0278) and 7d group (t46 = 2.612, p=0.012). There was no difference between HC or 7d groups (t46 = 0.335, n.s.). Results show mean +/− sem.
Extended Data Figure 7
Extended Data Figure 7. Exploring the same context twice enhances memory regardless of time
a, Experimental design. b, There was a significant difference in freezing (one-way ANOVA, F3,44 = 2.92, p=0.04, n=10,11,13,14). Consistent with the prior experiment, there was more freezing in the AB-5h than AB-7d group (t44 = 2.19, p<0.05). AB-7d group also had more freezing than AA-5h (t44 = 2.35, p<0.05) and AA-7d (t44 = 2.48, p<0.05) however there were no differences between the AA-5h and AA-7d (t44 = 0.06, n.s.) and AA-5h and AB-5h groups (t44 = 0.31, n.s.). Results show mean +/− sem.
Extended Data Figure 8
Extended Data Figure 8. NMDA receptor activity is required for overlap of neural ensembles and behavioral enhancement
a, Design for Ca2+ imaging of neuronal overlap with MK-801 or saline. b, There was no difference in the number of cells active during exploration of the first context between SAL and MK-801 groups (unpaired t-test, t6 = 0.58, n.s., n=4,4). c, There was lower overlap of the neuronal ensemble in the MK-801 than SAL group (paired t-test, t3 = 3.45, p=0.04, n=4). d, Design for behavioral enhancement experiment. e, There was lower freezing in the MK-801 than SAL group (unpaired t-test, t22 = 2.65, p=0.015, n=12,12). f, Design for behavioral control experiment. g, There was no difference in freezing between SAL and MK-801 groups (unpaired t-test, t22 = 0.22, n.s., n=12,12). Results show mean +/− sem.
Extended Data Figure 9
Extended Data Figure 9. Control experiments for aged mice
a, Design for experiment of recall for single contextual experience. b, There was no difference in reactivation of cells between young and old mice during recall (unpaired t-test, t6 = 0.59, n.s., n=4,4). c, Design for experiment with single context pre-exposure in young and old mice. d, There was no difference in freezing behavior to exposures of a single context (unpaired t-test, t29 = 0.24, n.s., n=16,15). e, Design for replication of TetTag experiment in old mice. f, There was no difference in the levels of overlapping ensembles between the 5h and 7d groups (unpaired t-test, t6 = 0.06, n.s., n=3,5). Results show mean +/− sem.
Extended Data Figure 10
Extended Data Figure 10. CNO activates cells with DREADD receptors and does not increase anxiety in aged mice
a, Mice infected with DREADD virus in CA1 were injected with saline (SAL) or clozapine-N-oxide (CNO) and then sacrificed 90 minutes post-injection for immunofluorescence staining. b, There was no difference in the percentage of DREADD-positive cells (labeled with GFP) between SAL and CNO groups (unpaired t-test, t7 = 0.01, n.s., n=3,6). c, DREADD-positive cells (labeled with GFP) had more ZIF when injected with CNO than SAL (unpaired t-test, t7 = 5.08, p=002). d, Representative examples of ZIF, DREADD, DAPI as well as merged images of CA1. e, Design for elevated plus maze experiment in aged mice with DREADD virus. f, A two-way ANOVA showed no main effect of injection (F1,9 = 0.75, n.s., n=6,5) and a significant main effect of arms (F1,9 = 71.03, p<0.0001). There was no significant interaction between injection and arms (F1,9 = 0.003, n.s.). Results show mean +/− sem.
Figure 1
Figure 1. Calcium imaging CA1 with integrated miniature microscopes while exploring different contexts
a, A microendoscope was implanted directly above CA1 expressing viral GCaMP6f and a baseplate was affixed onto the skull. A miniature fluorescent wide-field microscope was used to image CA1 neurons across repeated imaging sessions. b, Top left: Example image of mean fluorescence during context exploration. Top right: Example image of relative fluorescent change (dF/F). Bottom left: Cells extracted from dF/F. Bottom right: Example traces of dF/F color coded to represent individual neurons. c, Experimental design. Mice were imaged while exploring 3 novel contexts (A, B, C) separated by 7 days (7d) and 5 hours (5h). d, Representative imaging during context exploration. Top row: Images of mean fluorescence from each session. Middle row: Ensemble of cells active in each session. Bottom row: Cells that were active in two sessions. e, There is no difference in the number of cells active across the 3 context explorations (one-way, repeated measures ANOVA, F2,7=2.14, n.s., n=8). f, There is an increase in the overlapping ensemble when contexts are separated by 5h compared to 7d (paired t-test, t7=3.830, p=0.0065, n=8). Significance: **p<0.01. Results show mean +/− sem.
Figure 2
Figure 2. Tagging neural ensembles of contextual memories with the TetTag system
a, Schematic design of the TetTag system. b, Experimental design. Cells active in context A were tagged with GFP and cells active in context B, either 5h or 7d later, were labeled with ZIF immunohistochemistry. c, Representative examples of GFP, ZIF, DAPI and merged images of CA1. d, There was no difference between the percent of cells positive for GFP (unpaired t-test, t24=0.54, n.s., n=15,11). e, There was no difference between the percent of cells positive for ZIF (unpaired t-test, t24=1.11, n.s., n=15,11). f, There was an increase in the overlapping ensemble between contexts when spaced 5h apart compared to 7d apart (unpaired t-test, t24=2.15, p=0.0422, n=15,11). The level of the overlapping ensemble for the 5h group was above chance (one-sample t-test against 0, t14=3.402, p=0.0043) and at chance for the 7d group (one-sample t-test against 0, t10=0.323, n.s.). Significance: *p<0.05. Results show mean +/− sem.
Figure 3
Figure 3. Memories are contextually linked but distinct
a, Design for transfer of fear experiment. b, There was a significant difference in freezing (one-way ANOVA, F2,47=4.62, p=0.01, n=18,17,15). There was no difference between freezing in contexts C and B (t45=0.42, n.s.). Animals had less freezing in context A than C (t47=2.46, p=0.02) and B (t47=2.83, p=0.007). c, Design for extinction experiment. d, There was a significant difference in freezing during the context test (one-way ANOVA, F2,57=12.99, p<0.0001, n=20,20,20). There was no difference between freezing in contexts C and B (t57=0.80, n.s.). Animals had less freezing in context D than C (t57=4.76, p<0.0001) and B (t57=3.96, p=0.0002). e, There was a significant difference in freezing during the extinction test (one-way ANOVA, F2,57=4.79, p=0.01, n=20,20,20). There were no differences in freezing between groups B and D (t57=0.81, n.s.). Group C had less freezing than groups B (t57=2.18, p=0.03) and D (t57=2.99, p=0.004). f, Design for enhancement experiment. g, There was a significant difference in freezing (one-way ANOVA, F2,51=9.63, p<0.001, n=14,20,20). The 5h group had more freezing than the home cage (HC) (t51=3.98, p=0.0002) and 7d (t51=3.45, p=0.001) groups. There was no difference between HC or 7d groups (t51=0.86, n.s.). Significance: *p<0.05, **p<0.01. Results show mean +/− sem.
Figure 4
Figure 4. Age-related deficits in memory linking are rescued by ensemble activation
a, Design for calcium imaging with miniature microscope in aged mice. b, There was no difference in the overlapping ensemble between 5h and 7d (paired t-test, t3=0.367, n.s., n=4). c, Design for transfer of fear experiment. d, There was a significant difference in freezing during the context test (one-way ANOVA, F2,47=8.083, p=0.001, n=19,15,16). There was no difference between freezing levels in contexts B and D (t47=0.35, n.s.). Animals had more freezing in context C than B (t4 =3.19, p=0.0025) and D (t47=3.619, p=0.0007). e, Design for behavioral enhancement experiment. f, There was no difference in freezing between groups (one-way ANOVA, F2,39=0.453, n.s., n=15,15,12). g, Design for memory linking rescue by activating cells with DREADD receptors. h, There was higher freezing in the CNO group compared to the SAL group (unpaired t-test, t31=2.36, p=0.02, n=12,21). Significance: *p<0.05, **p<0.01. Results show mean +/− sem.

Comment in

References

    1. Silva AJ, Zhou Y, Rogerson T, Shobe J, Balaji J. Molecular and cellular approaches to memory allocation in neural circuits. Science. 2009;326:391–395. - PMC - PubMed
    1. Rogerson T, et al. Synaptic tagging during memory allocation. Nature Rev Neurosci. 2014;15:157–169. - PMC - PubMed
    1. Mankin EA, et al. Neuronal code for extended time in the hippocampus. Proc of the Natl Acad Sci USA. 2012;109:19462–19467. - PMC - PubMed
    1. Han JH, et al. Neuronal competition and selection during memory formation. Science. 2007;316:457–460. - PubMed
    1. Han JH, et al. Selective erasure of a fear memory. Science. 2009;323:1492–1496. - PubMed

Publication types