

Utilizing Nontraditional Data Sources for Near Real-Time Estimation of Transmission Dynamics During the 2015-2016 Colombian Zika Virus Disease Outbreak
- PMID: 27251981
- PMCID: PMC4909981
- DOI: 10.2196/publichealth.5814
Utilizing Nontraditional Data Sources for Near Real-Time Estimation of Transmission Dynamics During the 2015-2016 Colombian Zika Virus Disease Outbreak
Abstract
Background: Approximately 40 countries in Central and South America have experienced local vector-born transmission of Zika virus, resulting in nearly 300,000 total reported cases of Zika virus disease to date. Of the cases that have sought care thus far in the region, more than 70,000 have been reported out of Colombia.
Objective: In this paper, we use nontraditional digital disease surveillance data via HealthMap and Google Trends to develop near real-time estimates for the basic (R) and observed (Robs) reproductive numbers associated with Zika virus disease in Colombia. We then validate our results against traditional health care-based disease surveillance data.
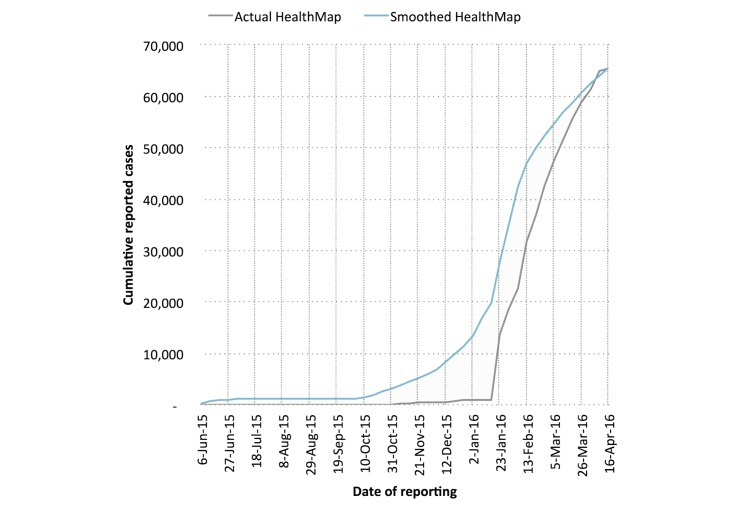
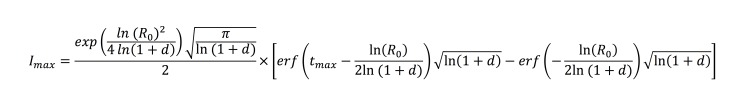
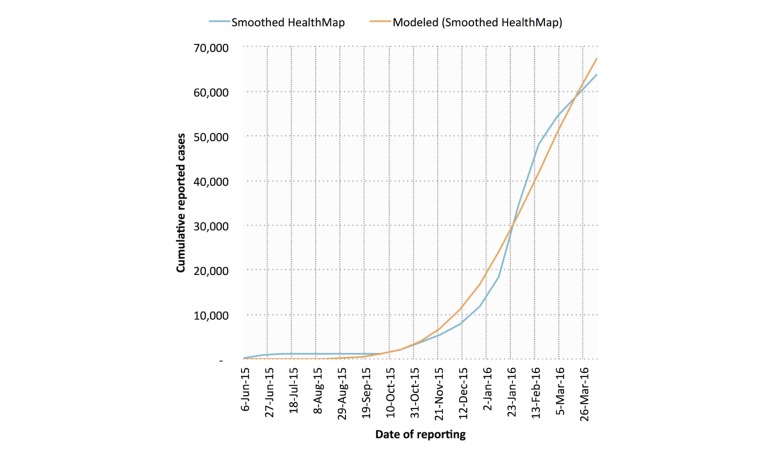
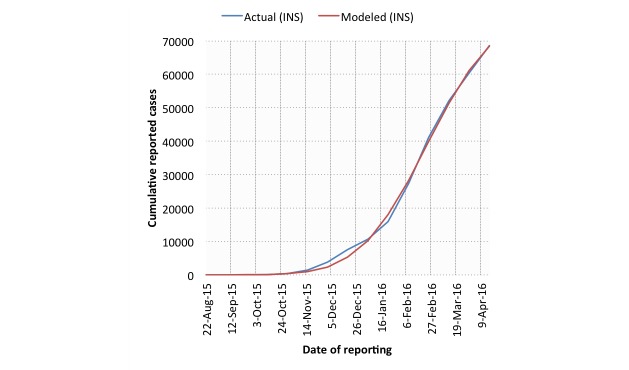
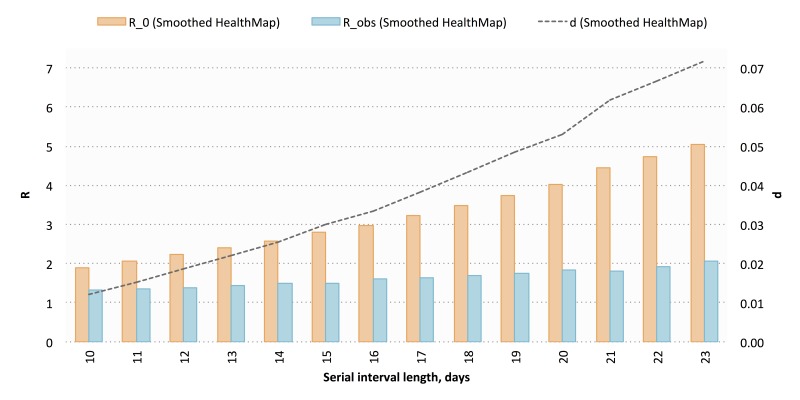
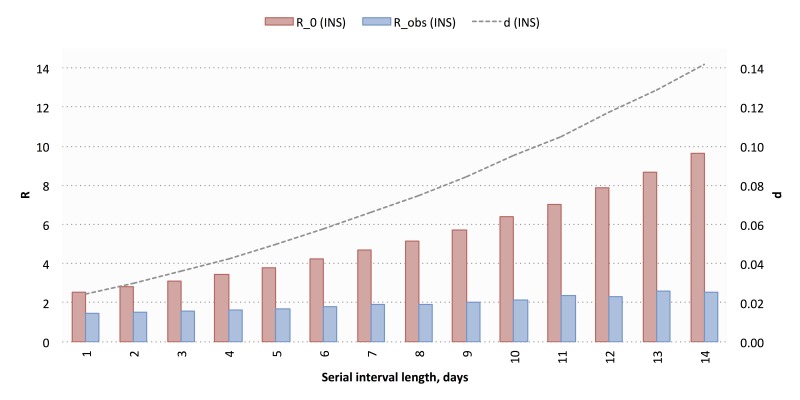
Methods: Cumulative reported case counts of Zika virus disease in Colombia were acquired via the HealthMap digital disease surveillance system. Linear smoothing was conducted to adjust the shape of the HealthMap cumulative case curve using Google search data. Traditional surveillance data on Zika virus disease were obtained from weekly Instituto Nacional de Salud (INS) epidemiological bulletin publications. The Incidence Decay and Exponential Adjustment (IDEA) model was used to estimate R0 and Robs for both data sources.
Results: Using the digital (smoothed HealthMap) data, we estimated a mean R0 of 2.56 (range 1.42-3.83) and a mean Robs of 1.80 (range 1.42-2.30). The traditional (INS) data yielded a mean R0 of 4.82 (range 2.34-8.32) and a mean Robs of 2.34 (range 1.60-3.31).
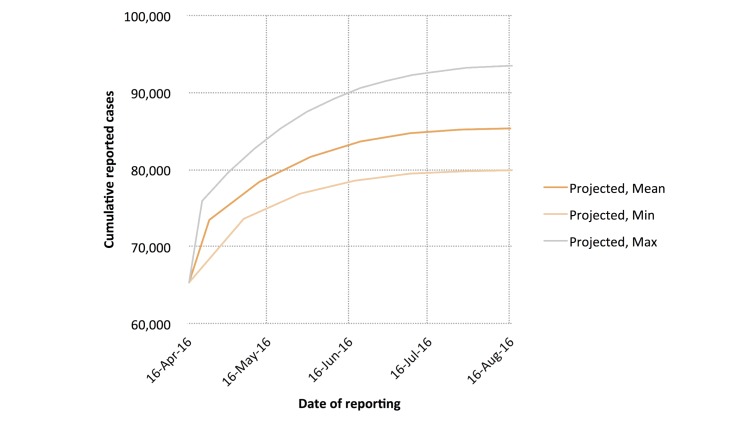
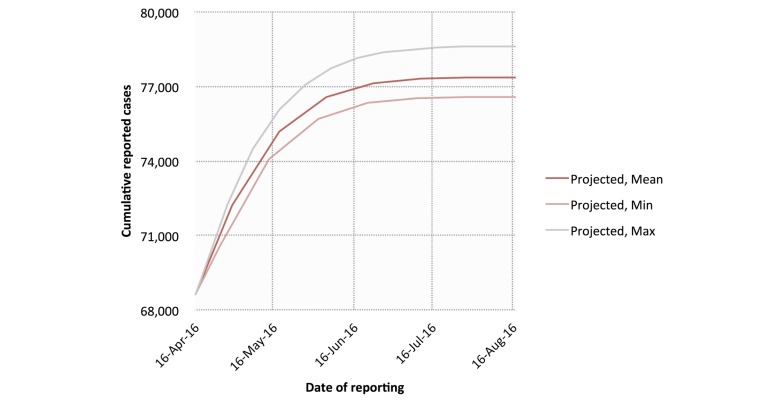
Conclusions: Although modeling using the traditional (INS) data yielded higher R estimates than the digital (smoothed HealthMap) data, modeled ranges for Robs were comparable across both data sources. As a result, the narrow range of possible case projections generated by the traditional (INS) data was largely encompassed by the wider range produced by the digital (smoothed HealthMap) data. Thus, in the absence of traditional surveillance data, digital surveillance data can yield similar estimates for key transmission parameters and should be utilized in other Zika virus-affected countries to assess outbreak dynamics in near real time.
Keywords: Zika virus disease; digital disease surveillance; mathematical modeling; reproductive number; transmission dynamics.
Conflict of interest statement
Conflicts of Interest: None declared.
Figures

References
-
- Brownstein JS, Freifeld CC, Madoff LC. Digital disease detection--harnessing the Web for public health surveillance. N Engl J Med. 2009 May 21;360(21):2153–2157. doi: 10.1056/NEJMp0900702. http://europepmc.org/abstract/MED/19423867 NEJMp0900702 - DOI - PMC - PubMed
-
- Majumder MS, Kluberg S, Santillana M, Mekaru S, Brownstein JS. 2014 Ebola outbreak: media events track changes in observed reproductive number. PLoS Curr. 2015;7:e1. doi: 10.1371/currents.outbreaks.e6659013c1d7f11bdab6a20705d1e865. doi: 10.1371/currents.outbreaks.e6659013c1d7f11bdab6a20705d1e865. - DOI - PMC - PubMed
-
- Chunara R, Andrews JR, Brownstein JS. Social and news media enable estimation of epidemiological patterns early in the 2010 Haitian cholera outbreak. Am J Trop Med Hyg. 2012 Jan;86(1):39–45. doi: 10.4269/ajtmh.2012.11-0597. http://www.ajtmh.org/cgi/pmidlookup?view=long&pmid=22232449 86/1/39 - DOI - PMC - PubMed
-
- European Centre for Disease Prevention and Control Rapid Risk Assessment: Zika Virus Epidemic in the Americas: Potential Association with Microcephaly and Guillain-Barré Syndrome. 2015. Dec 10, http://ecdc.europa.eu/en/publications/Publications/zika-virus-americas-a... .
-
- World Health Organization. WHO Director-General summarizes the outcome of the Emergency Committee regarding clusters of microcephaly and Guillain-Barré syndrome http://www.who.int/mediacentre/news/statements/2016/emergency-committee-...
Grants and funding
LinkOut - more resources
Full Text Sources
Other Literature Sources
Research Materials
