. 2016 Aug 5;291(32):16494-507.
doi: 10.1074/jbc.M116.722017. Epub 2016 Jun 1.

Solution Structures of Complement C2 and Its C4 Complexes Propose Pathway-specific Mechanisms for Control and Activation of the Complement Proconvertases

Affiliations

Solution Structures of Complement C2 and Its C4 Complexes Propose Pathway-specific Mechanisms for Control and Activation of the Complement Proconvertases

Sofia Mortensen et al. J Biol Chem. .

Abstract

The lectin (LP) and classical (CP) pathways are two of the three main activation cascades of the complement system. These pathways start with recognition of different pathogen- or danger-associated molecular patterns and include identical steps of proteolytic activation of complement component C4, formation of the C3 proconvertase C4b2, followed by cleavage of complement component C2 within C4b2 resulting in the C3 convertase C4b2a. Here, we describe the solution structures of the two central complexes of the pathways, C3 proconvertase and C3 convertase, as well as the unbound zymogen C2 obtained by small angle x-ray scattering analysis. We analyzed both native and enzymatically deglycosylated C4b2 and C2 and showed that the resulting structural models were independent of the glycans. The small angle x-ray scattering-derived models suggest a different activation mode for the CP/LP C3 proconvertase as compared with that established for the alternative pathway proconvertase C3bB. This is likely due to the rather different structural and functional properties of the proteases activating the proconvertases. The solution structure of a stabilized form of the active CP/LP C3 convertase C4b2a is strikingly similar to the crystal structure of the alternative pathway C3 convertase C3bBb, which is in accordance with their identical functions in cleaving the complement proteins C3 and C5.

Keywords: complement system; convertase; innate immunity; protease; small angle x-ray scattering (SAXS); structural biology.


Figures

FIGURE 1.
FIGURE 1.
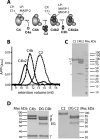
Scheme of the CP and LP pathways of complement and preparation of C2 and C4b2 samples for SAXS experiments. A, events occurring within the CP and LP after pattern recognition and activation of the initiating proteases C1s, MASP-1, and MASP-2. C1s and MASP-2 cleave C4 with generation of C4b. C2 binds C4b, which results in formation of the C3 proconvertase C4b2. C2 within C4b2 is subsequently cleaved by C1s, MASP-1, and MASP-2 with generation of the C3 convertase C4b2a. B, size exclusion chromatography of 0.83 nmol of purified C4b (158 μg/450 μl), 1.81 nmol of C2 (180 μg/450 μl), and C4b2 formed by mixing 0.55 nmol of C4b with 0.60 nmol of C2 (105 μg + 60 μg/450 μl). C, SDS-PAGE analysis under reducing conditions of the glycosylated C2 (1.7 μg) and C4b2 (4.4 μg) samples used for SAXS data collection. The positions of C2 and the C4b chains α′, β, and γ are indicated. D, SDS-PAGE analysis of the enzymatic treatment of C4b and C2 with the four endoglycosidases. C2 containing eight Asn-linked glycans shows a significant reduction in molecular mass after treatment. The large shift of the C4b α′-chain band and the smaller shift of the β-chain band are in agreement with the N-linked glycan contents of the chains. The bands below 60 kDa marked EG in both gels contains the GST- and MBP-tagged endoglycosidases.
FIGURE 2.
FIGURE 2.
Data processing and rigid body modeling of C2. A and B, Guinier plots (ln(I(s)) as a function of s2) for deglycosylated (A) and glycosylated (B) C2 suggest that both samples are not aggregated and devoid of interparticle repulsion. I(s) is the x-ray scattering intensity, and s is the modulus of the scattering vector. C, pair distance distribution functions P(r) exhibiting a maximum inter-atomic distances around 130 Å for both C2 samples. D, schematic representation of the rigid bodies in C2 and how they were grouped in the three refinement scenarios. The coloring scheme for the C2 domains is used throughout. E, two FB conformations used as templates for the C2 starting models. F, C2 models obtained by rigid body CORAL refinement when a non-glycosylated starting model of C2 (model:NG) in the closed conformation (Start:Closed) and data from deglycosylated C2 (Data:DG) were used and only the SP domain was allowed to move (scenario 1). All output models (10/10) from the 10 parallel refinements are shown. G, C2 models obtained when starting with a non-glycosylated model of C2 in the open conformation (Start:Open) and using three rigid bodies during refinement against data from deglycosylated C2. H, as in G but after refinements using data obtained with glycosylated C2 (Data:G) and model of glycosylated C2 (Model:G). I, as in H, but with a non-glycosylated starting model. J, experimental scattering curve (red) and the curve calculated with CRYSOL (black) from a representative model in G.
FIGURE 3.
FIGURE 3.
Data processing and modeling of C4b2. A and B, linear Guinier plots for deglycosylated (A) and glycosylated (B) samples suggest that both are non-aggregated and do not suffer from interparticle repulsion. C, pair distance distribution functions with maximum inter-atomic distance of 175 and 185 Å for deglycosylated and glycosylated C4b2, respectively. D, schematic representation of the rigid bodies defined in the C4b2 complex and how they were grouped in three different modeling scenarios. The colors of the rigid bodies within C4b2 presented in this panel are used also in the following panels presenting molecular models. The dashed line in scenario 3 represents that the C345c and the vWf domains formed a single rigid body. E, two starting models of the C4b2 complex based on the CVFB complex (closed) and the C3bBD complex (open). F, models of C4b2 obtained by CORAL refinement using the data from deglycosylated C4b2 and the non-glycosylated C4b2 model starting in the closed conformation and allowing only the C2 SP domain to move. G, as in F but after refinement under scenario 2. H, as in G but after a model containing 12 glycans was refined against data from glycosylated C4b2. I, experimental scattering curve (red) and the curve calculated with CRYSOL (black) from a representative model in G.
FIGURE 4.
FIGURE 4.
Stabilization and preparation of C4b2a. A, formation of C4b2 and C4b2a on the surface of an SPR sensorchip. Around 600 pg/mm2 biotinylated C4b (∼189 kDa) was captured on a sensorchip, and then C2 (∼99 kDa) was injected (+C2) resulting in the formation of C4b2. C1s was subsequently injected (+C1s), leading to the fast dissociation of C2b (∼28 kDa) and the slow dissociation of C2a (∼71 kDa). The ends of the C2 and C1s injections are labeled as “stop C2” and “stop C1s.” The flow rate was 30 μl/min. The sensorgram was obtained by subtraction of the RU signal of the reference flow cell without immobilized C4b from the RU signal of the flow cell with immobilized C4b, whereas the sensorgrams in B–E were subtracted from the nearly constant RU signal immediately prior to C2 injection given by the captured C4b. B, disruption of the C4b2 (left, black curve) and C4b2a (right, red curve) complexes by addition of 5 mm EDTA (+ 5 mm EDTA) and 1 m NaCl (+1 M NaCl). The beginnings of the C2 and C1s injections are indicated as “+C2” and “+C1s,” respectively. The ends of the C1s, EDTA, and NaCl injections are labeled as “stop C1s,” “stop EDTA,” and “stop NaCl.C, injection of PMSF-inhibited C1s does not result in a two-phase dissociation curve. D, dissociation of C4b2 formed using either C2 WT or C2 sm in either Mg2+- or Ni2+-containing buffers. E, dissociation of C4b2a formed using either C2 WT or C2 sm in either Mg2+- or Ni2+-containing buffers. All SPR curves were recorded in 100 mm NaCl except for the PMSF-C1s experiment, which had 140 mm NaCl in the running buffer. F, isolation of C4b2a by SEC on a Superdex 200 30/100 column. G, SDS-PAGE analysis of C2a and C4b standards (left) and the peak fractions from F confirm the presence of only C4b and C2a in the peak from the Superdex 200 column. The bands of the C4b chains (α′, β, and γ) as well as the C2a band are indicated. The C2a band appears smeary due to its six N-linked glycans and overlaps slightly with the C4b β-chain. H, characterization of the eluate of the C4b2a elution peak by RALS and RI measurements. The correlation between RALS and RI (the red line of log of molecular mass estimation) suggests that the eluate is close to being monodisperse.
FIGURE 5.
FIGURE 5.
Data collection, processing, and modeling of C4b2a. A, processing of the in-line SAXS data collected during SEC with the C4b2a complex prepared as in Fig. 4E. The I(0) calculated for each recorded SAXS curve (frame) plotted against frame number and retention volume gave the peak of I(0). The data frames 1730–1799 (blue area) were averaged and used as the C4b2a data. B, Guinier plot for the data. C, P(r) function suggests a maximum inter-atomic distance of 160 Å. D, schematic representation of the domains in the C4b2a complex illustrating how the rigid bodies were grouped during CORAL refinements. E, starting model of C4b2a based on the combination of the C3bBb, C4b, and C2a crystal structures. The alternative starting model with the SP domain of C2a manually rotated is shown to the right. F, output models from scenario 1 (with the C345c, the vWf, and the SP domains grouped) cluster very tightly. G, superposition of one of the output models from F and the C5-CVF structure leads to a biologically meaningful model of the convertase-substrate complex. The substrate here is represented by the blue C5 molecule, in which the C5a moiety is shown in pink. H, close-up of the intermolecular interface between the C5 scissile bond region and the C2a SP domain in the model in G. The dotted line indicates the 15 Å distance between C5 Arg-751 (pink sphere) and the S1 pocket of C2a (yellow sphere). I, curve calculated by CRYSOL (black) using a representative model from F compared with the experimental scattering curve (red).

References

    1. Ricklin D., Hajishengallis G., Yang K., and Lambris J. D. (2010) Complement: a key system for immune surveillance and homeostasis. Nat. Immunol. 11, 785–797 - PMC - PubMed
    1. Bajic G., Degn S. E., Thiel S., and Andersen G. R. (2015) Complement activation, regulation, and molecular basis for complement-related diseases. EMBO J. 34, 2735–2757 - PMC - PubMed
    1. Kojouharova M., Reid K., and Gadjeva M. (2010) New insights into the molecular mechanisms of classical complement activation. Mol. Immunol. 47, 2154–2160 - PubMed
    1. Kjaer T. R., Thiel S., and Andersen G. R. (2013) Toward a structure-based comprehension of the lectin pathway of complement. Mol. Immunol. 56, 222–231 - PubMed
    1. Vorup-Jensen T., Petersen S. V., Hansen A. G., Poulsen K., Schwaeble W., Sim R. B., Reid K. B., Davis S. J., Thiel S., and Jensenius J. C. (2000) Distinct pathways of mannan-binding lectin (MBL)- and C1-complex autoactivation revealed by reconstitution of MBL with recombinant MBL-associated serine protease-2. J. Immunol. 165, 2093–2100 - PubMed

Publication types