. 2016 Jul 27;90(16):7184-95.
doi: 10.1128/JVI.00593-16. Print 2016 Aug 15.

Time-Dependent Rate Phenomenon in Viruses

Affiliations

Time-Dependent Rate Phenomenon in Viruses

Pakorn Aiewsakun et al. J Virol. .

Abstract

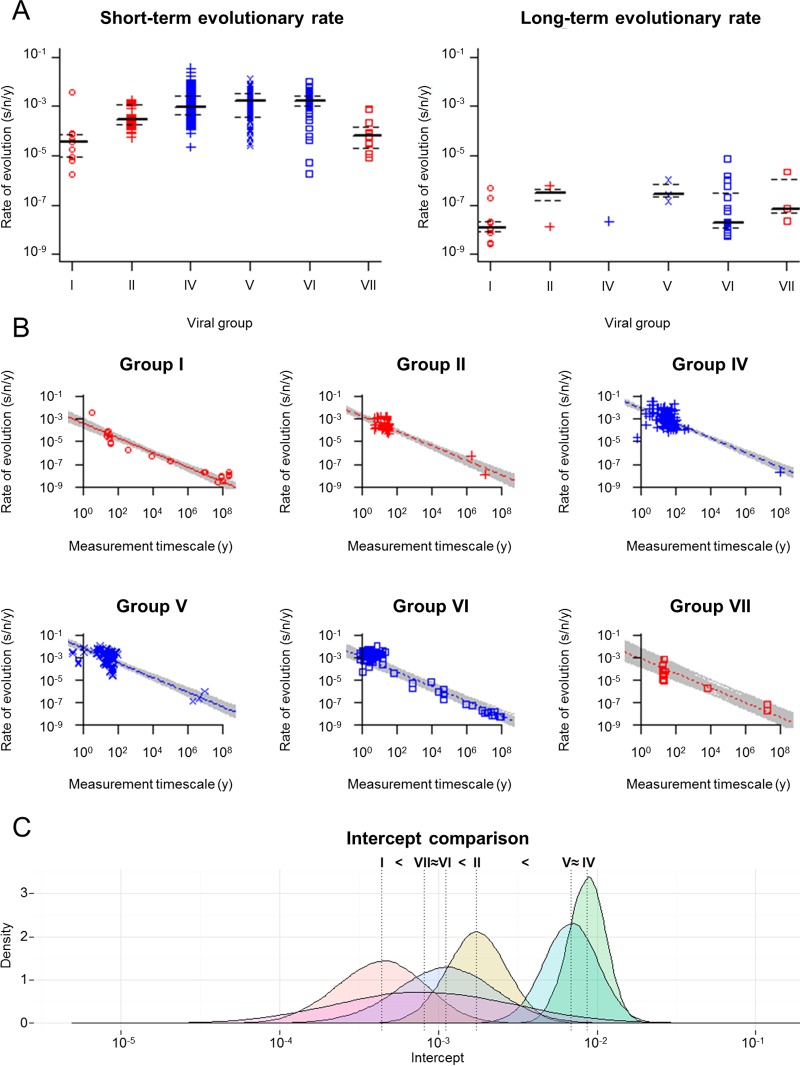
Among the most fundamental questions in viral evolutionary biology are how fast viruses evolve and how evolutionary rates differ among viruses and fluctuate through time. Traditionally, viruses are loosely classed into two groups: slow-evolving DNA viruses and fast-evolving RNA viruses. As viral evolutionary rate estimates become more available, it appears that the rates are negatively correlated with the measurement timescales and that the boundary between the rates of DNA and RNA viruses might not be as clear as previously thought. In this study, we collected 396 viral evolutionary rate estimates across almost all viral genome types and replication strategies, and we examined their rate dynamics. We showed that the time-dependent rate phenomenon exists across multiple levels of viral taxonomy, from the Baltimore classification viral groups to genera. We also showed that, by taking the rate decay dynamics into account, a clear division between the rates of DNA and RNA viruses as well as reverse-transcribing viruses could be recovered. Surprisingly, despite large differences in their biology, our analyses suggested that the rate decay speed is independent of viral types and thus might be useful for better estimation of the evolutionary time scale of any virus. To illustrate this, we used our model to reestimate the evolutionary timescales of extant lentiviruses, which were previously suggested to be very young by standard phylogenetic analyses. Our analyses suggested that these viruses are millions of years old, in agreement with paleovirological evidence, and therefore, for the first time, reconciled molecular analyses of ancient and extant viruses.

Importance: This work provides direct evidence that viral evolutionary rate estimates decay with their measurement timescales and that the rate decay speeds do not differ significantly among viruses despite the vast differences in their molecular features. After adjustment for the rate decay dynamics, the division between the rates of double-stranded DNA (dsDNA), single-stranded RNA (ssRNA), and ssDNA/reverse-transcribing viruses could be seen more clearly than before. Our results provide a guideline for further improvement of the molecular clock. As a demonstration of this, we used our model to reestimate the timescales of modern lentiviruses, which were previously thought to be very young, and concluded that they are millions of years old. This result matches the estimate from paleovirological analyses, thus bridging the gap between ancient and extant viral evolutionary studies.


Figures

FIG 1
FIG 1
Time-dependent rate phenomenon among viral groups. (A) A total of 359 viral short-term rate estimates (calculated over timescales of 0.16 to 760 years) (left), and 37 long-term rate estimates (calculated over timescales of 6,600 to 2.28 × 10⁸ years) (right) were collected from 133 publications, including 21 rate estimates for group I dsDNA viruses, 47 for group II ssDNA viruses, 123 for group IV (+)ssRNA viruses, 106 for group V (−)ssRNA viruses, 85 for group VI RT-RNA viruses, and 14 for group VII RT-DNA viruses (Table S1 in the supplemental material). Lines indicating the upper quartile (top dashed line), median (central solid line), and lower quartile (bottom dashed line) were added to each viral group to aid visualizing the point's density. (B) Viral evolutionary rate estimates are negatively correlated with their measurement timescales. Gray lines represent 1,000 individual best-fit models, where the slopes are the same across all viral groups. Red or blue lines represent models that are parameterized by median parameter estimates; open red circles and solid line, group I dsDNA viruses; red plus signs and dashed line, group II ssDNA viruses; blue plus signs and dashed line, group IV (+)ssRNA viruses; blue crosses and long-dashed line, group V (−)ssRNA viruses; open blue squares and dotted line, group VI RT-RNA viruses; open red squares and dotted line, group VII RT-DNA viruses. (C) Complete pairwise comparisons of the intercepts of the rate decay curves (representing rate estimates controlled for a 1-year timescale of rate measurement). Vertical dotted lines indicate median estimates. The differences among intercepts were evaluated at a significance level of 0.05.
FIG 2
FIG 2
Time-dependent rate phenomenon among viral genera. (A) The lines represent the best fit models; open red circles and solid line, group I genera Simplexvirus and Varicellovirus; red plus signs and dashed line, group II genus Mastrevirus; blue plus signs and dashed line, group IV genus Tobamovirus; blue crosses and long-dashed line, group V genus Hantavirus; open blue squares and dotted line, group VI genus Deltaretrovirus; open red squares and dotted line, group VII genus Avihepadnavirus. (B) Complete pairwise comparisons of the intercepts of the rate decay curves (representing rate estimates controlled for a 1-year timescale of rate measurement). Vertical dotted lines indicate median estimates. The differences among intercepts were evaluated at a significance level of 0.05.
FIG 3
FIG 3
Effects of erroneous short-term rate estimates derived from noncorrelated substitution numbers and timescales of rate measurement on the rate decay curve inference. Simulations were used to examine how the presence of erroneous short-term rate estimates may bias the time-dependent rate phenomenon (TDRP) analyses, assuming a nonhomogeneous Poisson evolutionary process and a power law rate decay curve. Left and right graphs show slope and intercept estimates, respectively, of the rate decay curve, computed in the presence of 20%, 40%, 60%, 80%, and 100% erroneous short-term rate estimates. Top and bottom graphs show how the erroneous short-term rates affect overall and short-term TDRP curves, respectively. The intercept and slope of the rate decay curve obtained from control simulations (0% erroneous rate estimates) were used as controls.
FIG 4
FIG 4
Short-term time-dependent rate phenomenon among viral groups. (A) Gray lines represent 1,000 individual best-fit models, where the slopes are the same across all viral groups. Red or blue lines represent models that are parameterized by median parameter estimates: red plus signs and dashed line, group II ssDNA viruses; blue plus signs and dashed line, group IV (+)ssRNA viruses; blue crosses and long-dashed line, group V (−)ssRNA viruses. (B) Complete pairwise comparisons of the intercepts of the rate decay curves (representing rate estimates controlled for a 1-year timescale of rate measurement). Vertical dotted lines indicate median estimates. The differences among intercepts were evaluated at a significance level of 0.05.
FIG 5
FIG 5
Lentivirus phylogeny and evolutionary timescale. (Left) Maximum clade credibility phylogeny of lentiviruses. The tree was estimated in the Bayesian phylogenetic framework under a strict clock assumption with a fixed rate of 1. The branch lengths and scale bar are in units of substitutions per site. The numbers on nodes are node heights in units of substitutions per site. The corresponding 95% highest posterior density intervals (HPDs) are given in parentheses. Asterisks indicate nodes with posterior support of >0.85. The split between SIVdrls and SIVdrl-Bioko (>10,000 to 11,000 years ago), which was used to calibrate the lentivirus-specific TDRP model, is circled. (Right) Time-calibrated lentivirus tree. The numbers on nodes are node heights in units of years before the present, inferred by using our TDRP model. Corresponding 95% HPDs are given in parentheses. The branch lengths and scale bar are also in units of millions of years (Myr).

References

    1. Bernard HU. 1994. Coevolution of papillomaviruses with human populations. Trends Microbiol 2:140–143. doi: 10.1016/0966-842X(94)90602-5. - DOI - PubMed
    1. McGeoch DJ, Gatherer D. 2005. Integrating reptilian herpesviruses into the family Herpesviridae. J Virol 79:725–731. doi: 10.1128/JVI.79.2.725-731.2005. - DOI - PMC - PubMed
    1. McGeoch DJ, Cook S. 1994. Molecular phylogeny of the Alphaherpesvirinae subfamily and a proposed evolutionary timescale. J Mol Biol 238:9–22. doi: 10.1006/jmbi.1994.1264. - DOI - PubMed
    1. McGeoch DJ, Cook S, Dolan A, Jamieson FE, Telford EAR. 1995. Molecular phylogeny and evolutionary timescale for the family of mammalian herpesviruses. J Mol Biol 247:443–458. doi: 10.1006/jmbi.1995.0152. - DOI - PubMed
    1. Sakaoka H, Kurita K, Iida Y, Takada S, Umene K, Kim YT, Ren CS, Nahmias AJ. 1994. Quantitative analysis of genomic polymorphism of herpes simplex virus type 1 strains from six countries: studies of molecular evolution and molecular epidemiology of the virus. J Gen Virol 75:513–527. doi: 10.1099/0022-1317-75-3-513. - DOI - PubMed

Publication types