

Cardiac Morphology and Function, and Blood Gas Transport in Aquaporin-1 Knockout Mice
- PMID: 27252655
- PMCID: PMC4878313
- DOI: 10.3389/fphys.2016.00181
Cardiac Morphology and Function, and Blood Gas Transport in Aquaporin-1 Knockout Mice
Abstract
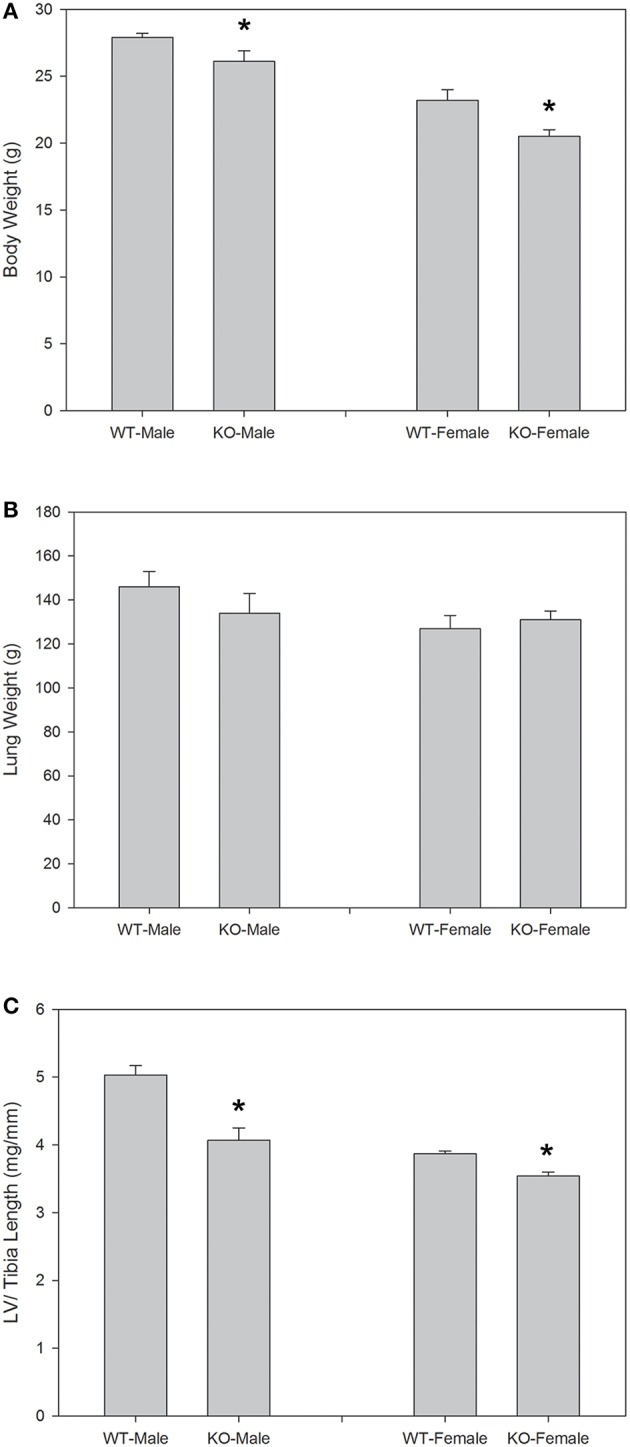
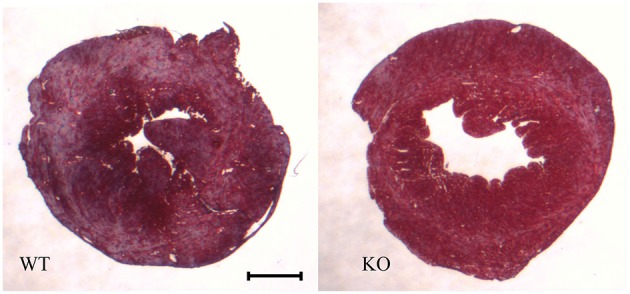
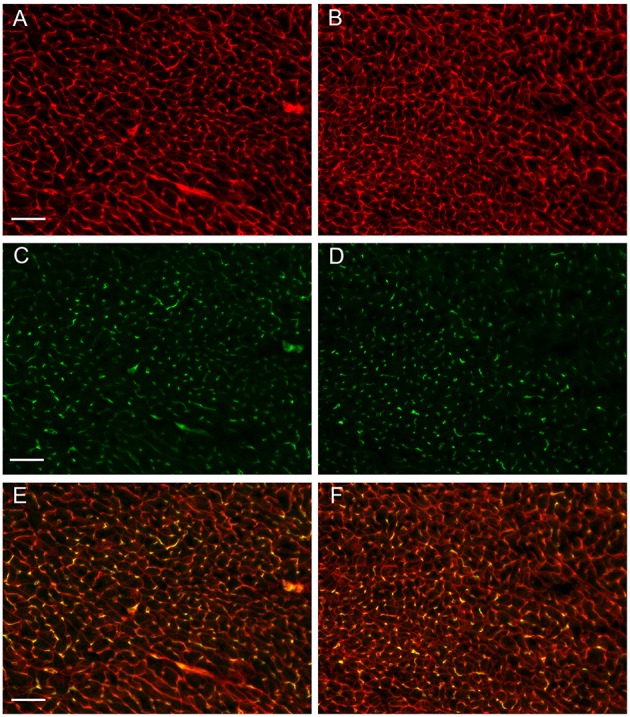
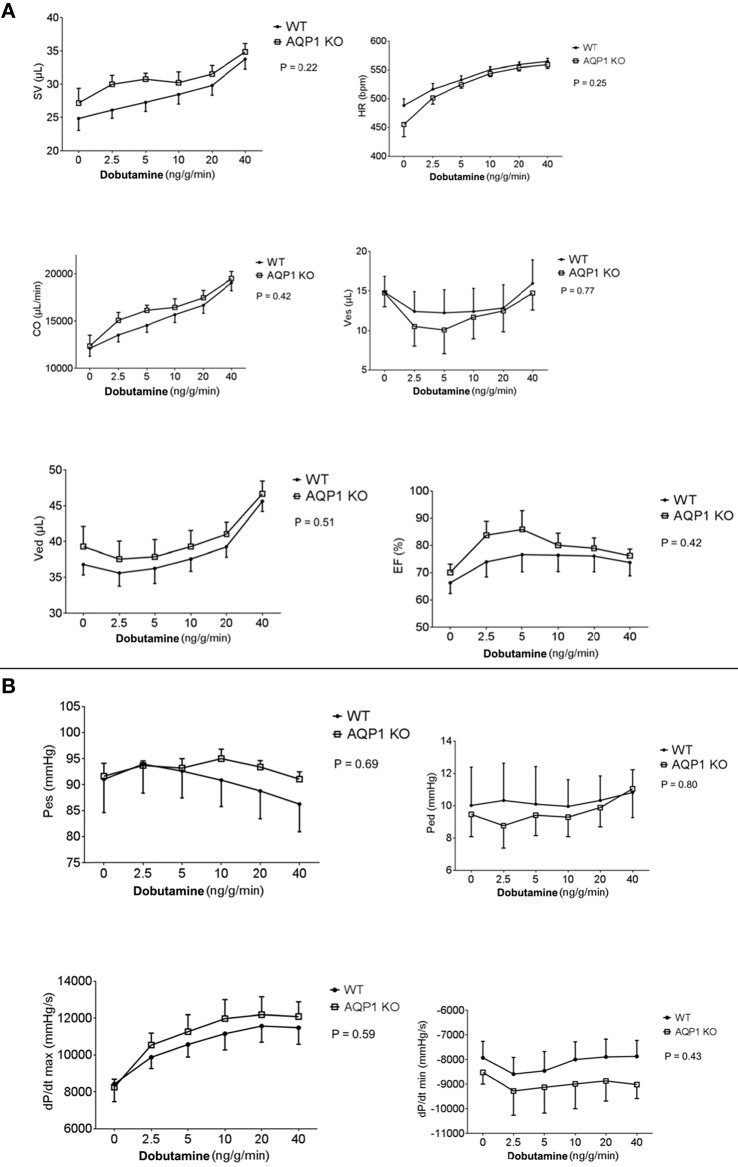
We have studied cardiac and respiratory functions of aquaporin-1-deficient mice by the Pressure-Volume-loop technique and by blood gas analysis. In addition, the morphological properties of the animals' hearts were analyzed. In anesthesia under maximal dobutamine stimulation, the mice exhibit a moderately elevated heart rate of < 600 min(-1) and an O2 consumption of ~0.6 ml/min/g, which is about twice the basal rate. In this state, which is similar to the resting state of the conscious animal, all cardiac functions including stroke volume and cardiac output exhibited resting values and were identical between deficient and wildtype animals. Likewise, pulmonary and peripheral exchange of O2 and CO2 were normal. In contrast, several morphological parameters of the heart tissue of deficient mice were altered: (1) left ventricular wall thickness was reduced by 12%, (2) left ventricular mass, normalized to tibia length, was reduced by 10-20%, (3) cardiac muscle fiber cross sectional area was decreased by 17%, and (4) capillary density was diminished by 10%. As the P-V-loop technique yielded normal end-diastolic and end-systolic left ventricular volumes, the deficient hearts are characterized by thin ventricular walls in combination with normal intraventricular volumes. The aquaporin-1-deficient heart thus seems to be at a disadvantage compared to the wild-type heart by a reduced left-ventricular wall thickness and an increased diffusion distance between blood capillaries and muscle mitochondria. While under the present quasi-resting conditions these morphological alterations have no consequences for cardiac function, we expect that the deficient hearts will show a reduced maximal cardiac output.
Keywords: Pressure-Volume-loop technique; aquaporin-1; blood gases; heart morphology; knockout mice.
Figures
References
-
- Barbee R. W., Perry B. D., Re R. N., Murgo J. P. (1992). Microsphere and dilution techniques for the determination of blood flows and volumes in conscious mice. Am. J. Physil. Reg. Integr. Comp. Physiol. 32, R728–R733. - PubMed
-
- Desai K. H., Sato R., Schauble E., Barsh G. S., Kobilka B. K., Bernstein D. (1997). Cardiovascular indexes in the mouse at rest and with exercise: new tools to study models of cardiac disease. Am. J. Physiol. Heart Circ. Physiol. 272, H1053–H1061. - PubMed
LinkOut - more resources
Full Text Sources
Other Literature Sources
Molecular Biology Databases
Research Materials
Miscellaneous