. 2016 May 24:7:184.
doi: 10.3389/fphys.2016.00184. eCollection 2016.

Community Structure Reveals Biologically Functional Modules in MEF2C Transcriptional Regulatory Network

Affiliations

Community Structure Reveals Biologically Functional Modules in MEF2C Transcriptional Regulatory Network

Sergio A Alcalá-Corona et al. Front Physiol. .

Abstract

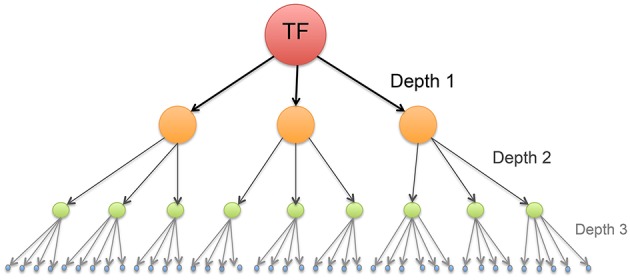
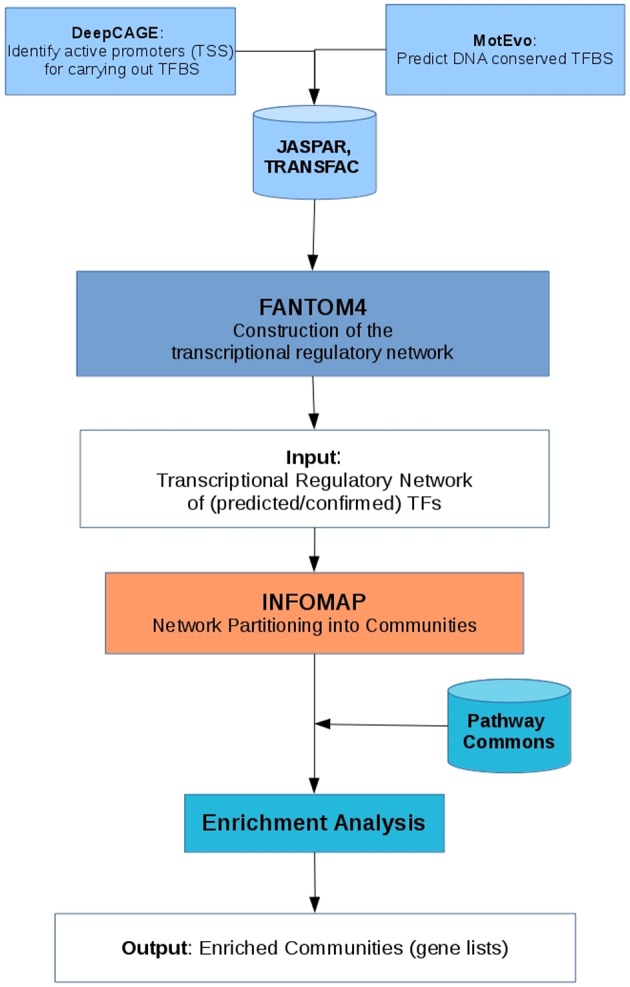
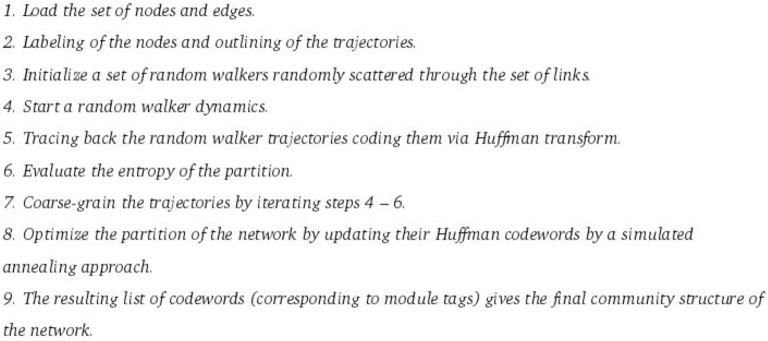
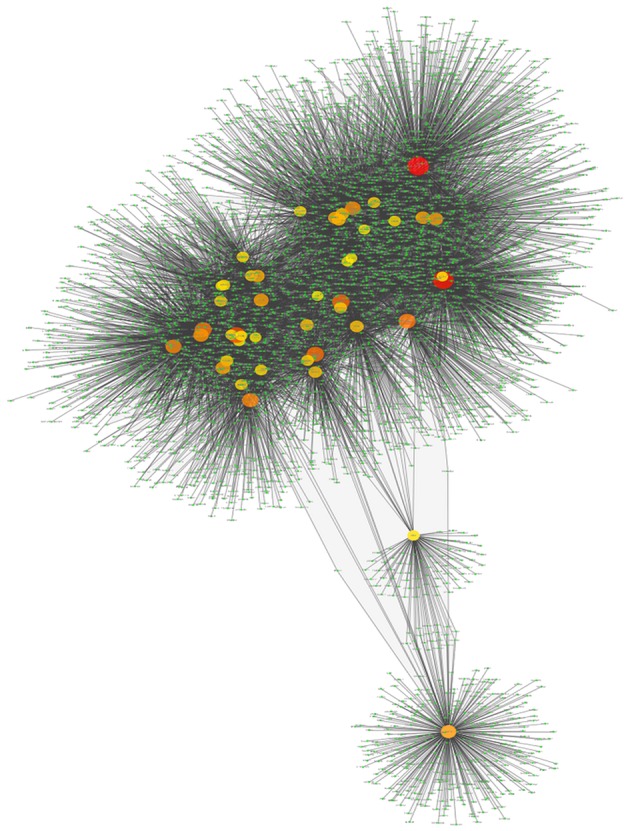
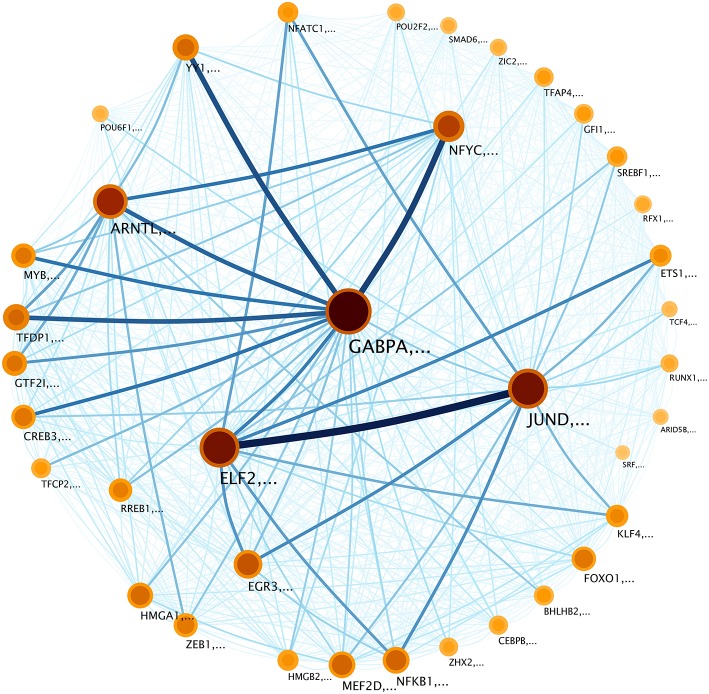
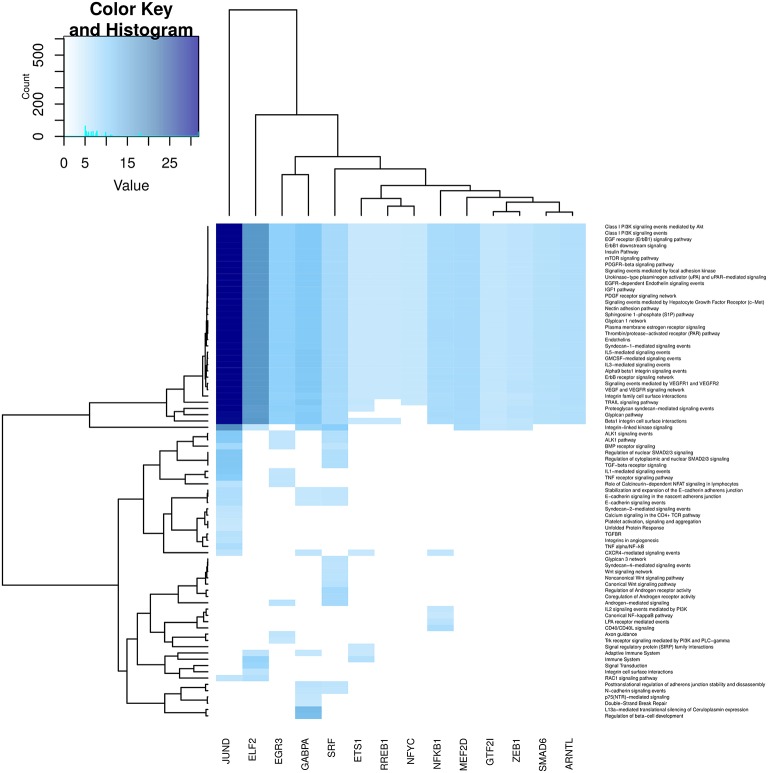
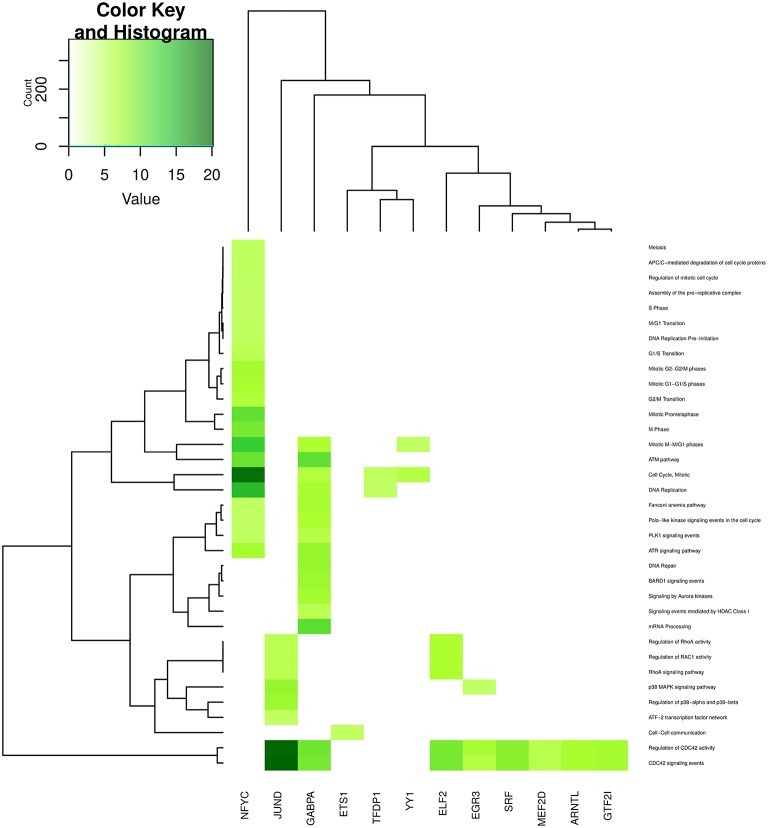
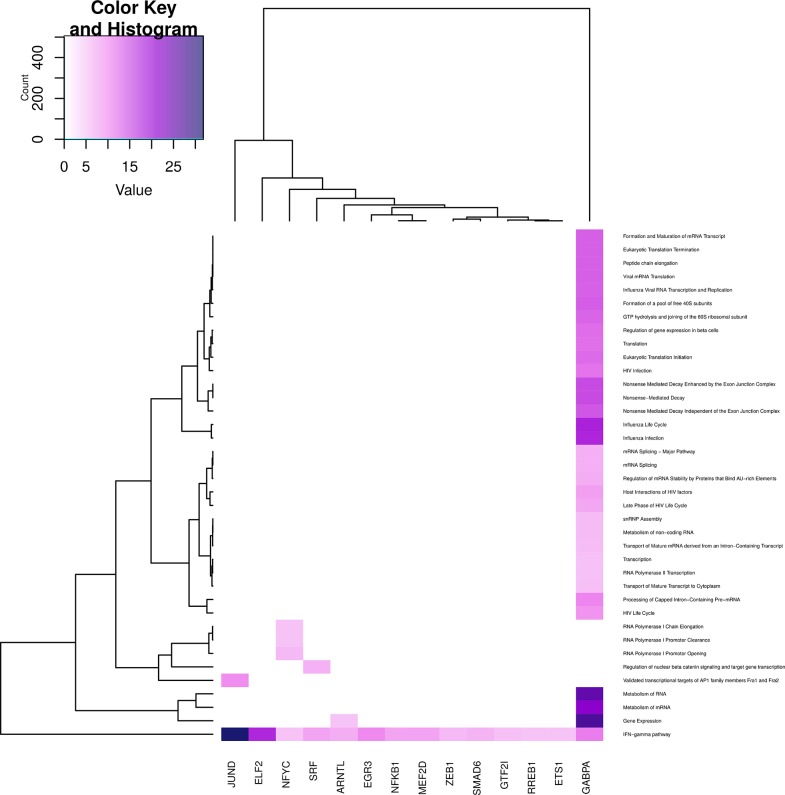
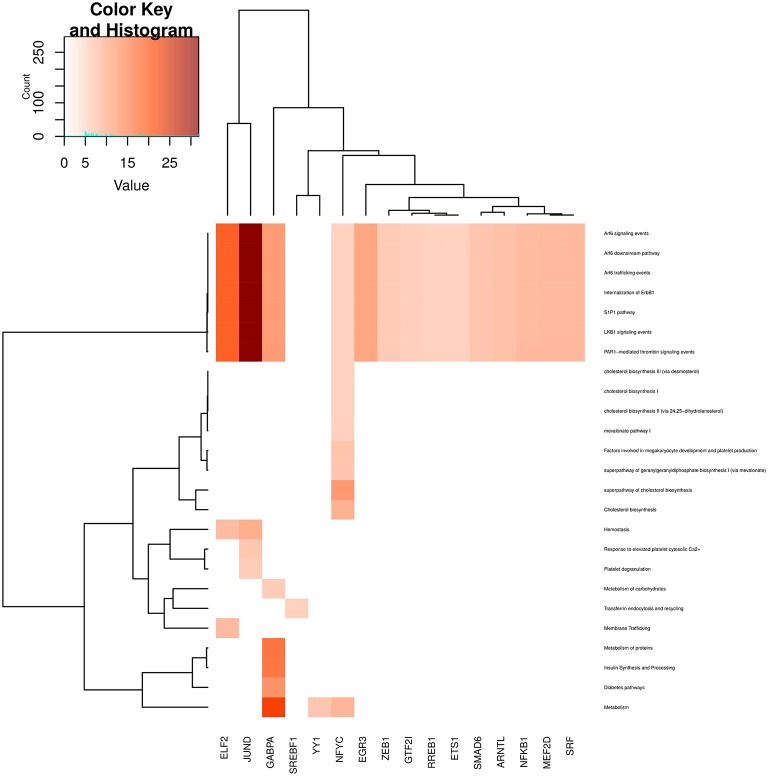
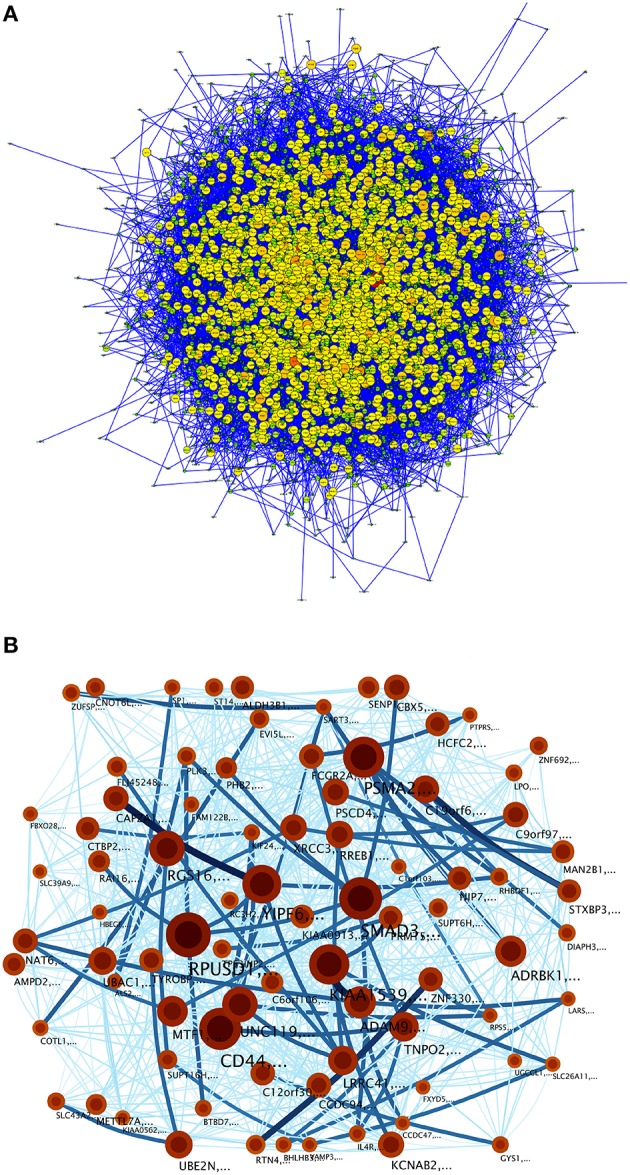
Gene regulatory networks are useful to understand the activity behind the complex mechanisms in transcriptional regulation. A main goal in contemporary biology is using such networks to understand the systemic regulation of gene expression. In this work, we carried out a systematic study of a transcriptional regulatory network derived from a comprehensive selection of all potential transcription factor interactions downstream from MEF2C, a human transcription factor master regulator. By analyzing the connectivity structure of such network, we were able to find different biologically functional processes and specific biochemical pathways statistically enriched in communities of genes into the network, such processes are related to cell signaling, cell cycle and metabolism. In this way we further support the hypothesis that structural properties of biological networks encode an important part of their functional behavior in eukaryotic cells.

Keywords: FANTOM4; InfoMap; MEF2C; community structure; transcription factor; transcriptional regulatory networks.


Figures

Figure 1
Figure 1
Schematic representation of a transcription network composed by a master regulator gene (like the MEF2C Transcription Factor) and its targets down to depth = 3. The directions of the arrows point to target gene.
Figure 2
Figure 2
Chart diagram of the methodology used, that describe the inferring of the network, the community detection and the enrichment analysis.
Figure 3
Figure 3
Heuristic description of the infomap algorithm.
Figure 4
Figure 4
Transcriptional network of TFBS interactions for the MEF2C transcription factors and its targets up to the third level. In this visualization, the color and the size of the genes is depicted according to node-degree (number of neighbors connected to this particular gene): small green nodes correspond to barely-connected genes; whereas larger orange and red nodes represent highly connected genes.
Figure 5
Figure 5
Community structure of the transcriptional network in Figure 4. Modules are tagged with the name of the node whit the highest PageRank (Brin and Page, 2012) inside the community. Nodes (which represent communities) are depicted according to the size of the community and the information flow inside that community. In this sense, darker colors correspond to larger information contents whereas bigger circles represent larger communities. The relative degree of information flow is depicted in the width and color of the inter-module links. The thickness of the module borders reflects the probability that a random surfer within the module, will follow a regulation (edge) to a gene outside of the module. The weighted links between communities represent regulation flow, with the color and width of the edges indicating flow volume. For example, the lines between JUND and ELF2 communities, indicate information flow of regulation between them. These links reveal the relationship between communities.
Figure 6
Figure 6
Heatmap depicting enrichment in pathways related to cell signaling processes. Communities are tagged with the name of its higher PageRank molecule. Color intensity is proportional to the −log of p-value. Darker spots correspond to statistically significant hits. The upper-left inset shows the Z-score histogram and color key for the p-value of the enriched processes. Finally, a dendrogram which shows similar p-value distributions among the enriched processes in the communities is also depicted.
Figure 7
Figure 7
Heatmap depicting enrichment in pathways related to cell cycle. Communities are tagged with the name of its higher PageRank molecule. Color intensity is proportional to the −log of p-value. Darker spots correspond to statistically significant hits. The upper-left inset shows the Z-score histogram and color key for the p-value of the enriched processes. Finally, a dendrogram which shows similar p-value distributions among the enriched processes in the communities is also depicted.
Figure 8
Figure 8
Heatmap depicting enrichment in pathways related to gene expression. Communities are tagged with the name of its higher PageRank molecule. Color intensity is proportional to the −log of p-value. Darker spots correspond to statistically significant hits. The upper-left inset shows the Z-score histogram and color key for the p-value of the enriched processes. Finally, a dendrogram which shows similar p-value distributions among the enriched processes in the communities is also depicted.
Figure 9
Figure 9
Heatmap depicting enrichment in pathways related to metabolism and cellular transport processes. Communities are tagged with the name of its higher PageRank molecule. Color intensity is proportional to the −log of p-value. Darker spots correspond to statistically significant hits. The upper-left inset shows the Z-score histogram and color key for the p-value of the enriched processes. Finally, a dendrogram which shows similar p-value distributions among the enriched processes in the communities is also depicted.
Figure 10
Figure 10
(A) A null model constructed by the Transcriptional network for TFBS interactions for the MEF2C transcription factors and its targets up to the third level into an Erdös-Renyí network with the same nodes and the number of edges but randomized links. (B) Community structure of the null model. Modules are tagged as explained in Figure 5.

References

    1. Ahn Y.-Y., Bagrow J. P., Lehmann S. (2010). Link communities reveal multiscale complexity in networks. Nature 466, 761–764. 10.1038/nature09182 - DOI - PubMed
    1. Arnold P., Erb I., Pachkov M., Molina N., van Nimwegen E. (2012). MotEvo: integrated Bayesian probabilistic methods for inferring regulatory sites and motifs on multiple alignments of DNA sequences. Bioinformatics 28, 487–494. 10.1093/bioinformatics/btr695 - DOI - PubMed
    1. Baca-López K., Mayorga M., Hidalgo-Miranda A., Gutiérrez-Nájera N., Hernández-Lemus E. (2012). The role of master regulators in the metabolic/transcriptional coupling in breast carcinomas. PLoS ONE 7:e42678. 10.1371/journal.pone.0042678 - DOI - PMC - PubMed
    1. Bae J. S., Noh S. J., Kim K. M., Jang K. Y., Chung M. J., Kim D. G., et al. (2014). Serum response factor induces epithelial to mesenchymal transition with resistance to sorafenib in hepatocellular carcinoma. Int. J. Oncol. 44, 129–136. 10.3892/ijo.2013.2154 - DOI - PubMed
    1. Barabási A.-L., Albert R., Jeong H. (2000). Scale-free characteristics of random networks: the topology of the world-wide web. Physica A 281, 69–77. 10.1016/S0378-4371(00)00018-2 - DOI

LinkOut - more resources