. 2016 Jun 2;12(6):e1005640.
doi: 10.1371/journal.ppat.1005640. eCollection 2016 Jun.

Small RNA-Based Antiviral Defense in the Phytopathogenic Fungus Colletotrichum higginsianum

Affiliations

Small RNA-Based Antiviral Defense in the Phytopathogenic Fungus Colletotrichum higginsianum

Sonia Campo et al. PLoS Pathog. .

Abstract

Even though the fungal kingdom contains more than 3 million species, little is known about the biological roles of RNA silencing in fungi. The Colletotrichum genus comprises fungal species that are pathogenic for a wide range of crop species worldwide. To investigate the role of RNA silencing in the ascomycete fungus Colletotrichum higginsianum, knock-out mutants affecting genes for three RNA-dependent RNA polymerase (RDR), two Dicer-like (DCL), and two Argonaute (AGO) proteins were generated by targeted gene replacement. No effects were observed on vegetative growth for any mutant strain when grown on complex or minimal media. However, Δdcl1, Δdcl1Δdcl2 double mutant, and Δago1 strains showed severe defects in conidiation and conidia morphology. Total RNA transcripts and small RNA populations were analyzed in parental and mutant strains. The greatest effects on both RNA populations was observed in the Δdcl1, Δdcl1Δdcl2, and Δago1 strains, in which a previously uncharacterized dsRNA mycovirus [termed Colletotrichum higginsianum non-segmented dsRNA virus 1 (ChNRV1)] was derepressed. Phylogenetic analyses clearly showed a close relationship between ChNRV1 and members of the segmented Partitiviridae family, despite the non-segmented nature of the genome. Immunoprecipitation of small RNAs associated with AGO1 showed abundant loading of 5'U-containing viral siRNA. C. higginsianum parental and Δdcl1 mutant strains cured of ChNRV1 revealed that the conidiation and spore morphology defects were primarily caused by ChNRV1. Based on these results, RNA silencing involving ChDCL1 and ChAGO1 in C. higginsianum is proposed to function as an antiviral mechanism.


Conflict of interest statement

The authors have declared that no competing interests exist.

Figures

Fig 1
Fig 1. RNA silencing in the ascomycete fungus Colletotrichum higginsianum.
(A) Domain organization of RNA Dependent RNA polymerases (RDR), Dicer (DCL) and Argonaute (AGO) proteins in C. higginsianum. RRM, RNA Recognition motif. dsRBD, dsRNA Binding Domain. The conserved aspartic acid residues required for AGO catalytic activity in the PIWI domain are indicated (DDD). RGG, arginine-glycine-glycine rich domain. (B-D) Phylogenetic analysis of RDR (B), DCL (C) and AGO (D) protein sequences. Rooted maximum likelihood neighbor joining trees were constructed by alignment of full-length protein sequences from representative members of the Ascomycota clade (Sordariomycetes in blue, Eurotiomycetes in green, Dothideomycetes in orange, Leotiomycetes in pink). C. higginsianum proteins are indicated with red dots. For the sake of clarity, only maximum likelihood bootstraps values higher than 90% are shown. Two main groups are labeled, the Quelling pathway (shaded in green) and the Meiotic-Silencing by Unpaired DNA (MSUD) pathway (shaded in purple). Accession numbers for protein sequences used in the alignment are in S1 Table. Phylogenetic trees were generated using RAxML under the model LG+G+F of amino acid substitution. Scale bar in each panel represents 0.1 amino acid substitutions per site. (E) Expression analysis of RDR, DCL and AGO genes in C. higginsianum mycelium. Silencing genes are grouped into the Quelling pathway (left panel), MSUD pathway (middle panel) and Unknown pathway (right panel). Three biological replicates were used for each gene; values were normalized to the mean of ACTIN and TUBULIN genes and the mean expression of each RNA silencing gene is represented as a relative value compared to AGO1.
Fig 2
Fig 2. Phenotype analysis of C. higginsianum RNA silencing-mutant strains.
(A) Colony morphology and radial growth phenotype for the C. higginsianum RNA silencing machinery mutants and Control strains on Mathur’s medium. A representative example of colony morphology after 6 days of growth (left panel), and radial growth measurements from days 2 to 5 (right panel) (mean +/- SE). Scale bar = 1 cm (B) Conidia production in the Control and RNA silencing mutant strains. Conidia were collected after 7 days of growth in Mathur’s medium and counted with a hemocytomer. Values plotted are from three biological replicates for each of four unique transformants; red bar indicates the mean. Strains with significantly different conidia production from the Control strain are indicated (“a”: p = 0.05). (C) Box plots representing length (upper panel) and width (lower panel) of conidia. Conidia were collected, observed and measured by light microscopy using a confocal microscope. At least 200 conidia were measured for each strain. Error bars represent the first and third quartile. The horizontal line within the box represents the median value (ie. 50th percentile). Black dots represent outliers. (D) Confocal images of conidia from the C. higginsianum Control and RNA silencing mutant strains. Scale bar = 2 μm.
Fig 3
Fig 3. Transcript and small RNA reads unmapped to the C. higginsianum genome.
Percentage of reads not aligned to the C. higginsianum genome in the Control and RNA silencing mutant strains, from (A) transcript and (B) small RNA libraries. (C) Percentage of small RNAs reads unaligned to the C. higginsianum genome from Δago1/6His-3FLAG-AGO1 Input and IP libraries. 6H3F, 6His-3FLAG.
Fig 4
Fig 4. Identification of a novel dsRNA virus in C. higginsianum.
(A) Genome organization and size of the C olletotrichum h igginsianum Non-segmented dsRNA Virus 1 (ChNRV1) identified by de novo transcriptome assembly. ChNRV1 contains two ORF that are in different frames. ORF1 encodes a putative coat protein (CP) and ORF2 a putative RNA-dependent RNA polymerase (RdRP). UTR, Untranslated region. (B) Accumulation of ChNRV1 transcripts in the C. higginsianum wild-type strain IMI 349063A as determined by semi-quantitative RT-PCR analysis (center lane, cDNA), using primers spanning both ORFs (S7 Table). PCR analysis from genomic DNA (gDNA) of C. higginsianum IMI 349063A strain using the same primers pairs determined that ChNRV1 is not integrated into the fungal genome. (C) Electrophoretic analysis of viral dsRNA in 1% agarose gel without treatment, treated with DNase, treated with RNase in a high-salt, or treated with RNase in a low salt buffer. Resistance to degradation by RNaseA in buffer with high salt concentration confirmed the nature of the dsRNA molecule.
Fig 5
Fig 5. Characterization of viral proteins.
(A) Predicted secondary structure of ChNRV1-ORF1, putative coat protein, (white) aligned to the model of ScV-L-A capsid protein (cyan). The 10 amino acids from the N-terminal and C-terminal ends of ChNRV1-ORF1 are in purple and orange respectively. (B) Analysis of viral proteins by SDS-PAGE (upper panel) and dsRNA by agarose electrophoresis (lower panel) from purified virus fractions. Four proteins bands (p110, p36, p34 and p25) and viral dsRNA accumulate in the Δdcl1, Δdcl1Δdcl2 and Δago1 strains. KDa, kilodaltons. (C) Distribution of ChNRV1 trypsin-digested p110, p36, p34 and p26 peptides identified by Mass Spectrometry along the capsid protein (blue boxes) and the RdRP protein (orange boxes). Values indicate the mean normalized spectral counts and the percentage of sequence coverage in parenthesis, p110: below diagram; p36, p34, p26: next to diagram.
Fig 6
Fig 6. Phylogenetic and sequence analysis of ChNRV1-RDRP.
(A) A phylogram showing the relationship of the RdRP of selected mycoviruses from the Totiviridae (non-segmented genome), Partitiviridae (Bipartite genome) and Unclassified dsRNA viruses (Monopartite and Bipartite genome) families; sequence from human Rotavirus A (ROTHA) serves as the outgroup. ChNRV1 is indicated with a red star. Virus names have been abbreviated; full names and accession numbers for protein sequences used in the alignment are in S6 Table. Phylogenetic trees were generated using Raxml under the model LG+G+F of amino acid substitution. Scale bar in each panel represents 0.5 amino acid substitutions per site. RDRP, RNA dependent RNA polymerase; CP, coat protein. (B) MAFFT amino acid sequence alignment of the conserved motifs of RdRP of ChNRV1 and the dsRNA Mycoviruses used in (A). Numbers at the top indicate the eight conserved domains from dsRNA viruses of lower eukaryotes [78]. Residues found in all viral sequences (top and lower panels) are shaded in blue. Residues specific to Totiviridae- or Partitiviridae/Unclassified are shaded in yellow and red, respectively.
Fig 7
Fig 7. Analysis of RNA-seq reads mapped to ChNRV1.
(A) RNA-seq reads mapped to the virus genome were scaled to reads per million of total reads (RPM) for each library. Significant differences between Control and RNA silencing mutant strains are indicated where “a”: p = 0.05. (B) RNA-seq reads mapped to the sense strand of the virus, scaled to RPM. Significant differences between Control and RNA silencing mutant strains are indicated where “a”: p = 0.05. (C) RNA-seq reads mapped to the antisense strand of the virus, scaled to RPM. Significant differences between Control and RNA silencing mutant strains are indicated where “a”: p = 0.05. (D-F) RNA-seq reads plotted along the viral genome (sense, above x-axis; antisense, below x-axis). Average reads per million reads mapped are on the y-axis; left y-axis scale for the sense strand (0–60) and antisense strand (0–10) for Δrdr1, Δrdr2, Δrdr3, Δdcl2, Δago2 and Controls; for Δdcl1 and Δago1 the right y-axis scale for the sense strand (0–8,000) and antisense strand (0–100) is indicated.
Fig 8
Fig 8. Characterization of viral small RNAs.
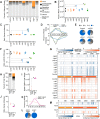
(A-G): Analysis of viral small RNAs from the Controls and RNA silencing mutant strains. Significant differences between the Control and RNA silencing mutant strains are indicated where “a”: p < 0.05. (A) Summary of genomic loci that produce small RNAs as a percentage of total reads per genotype. (B) Small RNA reads, scaled to reads per million of total reads (RPM), mapped to the virus genome. (C) Ratio of sense to antisense small RNAs that mapped to the viral genome. (D) Distribution of viral small RNAs by size and by strand as a percentage of total viral small RNAs by strand. Sense strand small RNAs are plotted above the x-axis and reads from the antisense strand are plotted below. (E) 5’ nucleotide distribution of viral small RNAs. (F) Ratio of small RNAs to RNA-seq mapped to ChNRV1. RPM counts for each small RNA replicate were divided by the average RPM counts from the RNA-seq for that genotype. (G) Analysis of small RNA read counts along the viral genome, as a function of RNA-seq levels. Small RNA RPM counts per nucleotide were determined by strand then divided by the average RPM counts for the RNA-seq for that genotype and strand. Graphical representation of the virus is in the middle, with the two ORFs indicated, and genome coordinates are along the top-most edge. Sense strand reads are plotted in blue above the genome figure and antisense reads are plotted in orange below. The scale for sense strand and antisense strand values is shown as density heatmaps above the plot. (H-M): Analysis of the 6H3F-AGO1 input and IP fractions. Significant differences between the Input and IP fractions are indicated where “a”: p < 0.05. (H) Summary of genomic loci that produce small RNAs found in the input and IP fractions. Colors are the same as (A). (I) RPM counts of small RNAs in the input and IP that mapped to the virus genome. (J) Ratio of sense to antisense of viral small RNAs. (K) Size distribution and (L) 5’ nucleotide distribution of viral small RNAs as a percentage of total viral small RNAs. (M) Input and IP RPM counts plotted by strand at single nucleotide resolution along the virus genome. Heatmap densities shown below the plots indicate the scale of RPM for sense and antisense strand reads.
Fig 9
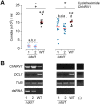
Fig 9. Conidiation in C. higginsianum Δdcl1 and wild-type strains with and without ChNRV1.
(A) Conidia production in the Control and Δdcl1 mutant strains before cycloheximide treatment (–Cycloheximide/+ChNRV1) and after cycloheximide treatment (+Cycloheximide/–ChNRV1). Conidia were collected after 7 days of growth in Mathur’s medium and counted with a hemocytomer. Mean conidia counts are indicated by the red dash; significantly different pairwise comparisons are indicated by shared lowercase letters (p < 0.05). (B) RT-PCR analysis of C. higginsianum total RNA for the presence of ChNRV1, DCL1, and tubulin (control). The presence of dsRNA was determined by gel electrophoresis of total RNA (lower panel).

References

    1. Bologna NG, Voinnet O (2014) The Diversity, Biogenesis, and Activities of Endogenous Silencing Small RNAs in Arabidopsis. Annu Rev Plant Biol 65: 473–503. 10.1146/annurev-arplant-050213-035728 - DOI - PubMed
    1. Ipsaro JJ, Joshua-Tor L (2015) From guide to target: molecular insights into eukaryotic RNA-interference machinery. Nat Struct Mol Biol 22: 20–28. 10.1038/nsmb.2931 - DOI - PMC - PubMed
    1. Kim VN, Han J, Siomi MC (2009) Biogenesis of small RNAs in animals. Nat Rev Mol Cell Biol 10: 126–139. 10.1038/nrm2632 - DOI - PubMed
    1. Czech B, Hannon GJ (2011) Small RNA sorting: matchmaking for Argonautes. Nat Rev Genet 12: 19–31. 10.1038/nrg2916 - DOI - PMC - PubMed
    1. Huntzinger E, Izaurralde E (2011) Gene silencing by microRNAs: contributions of translational repression and mRNA decay. Nat Rev Genet 12: 99–110. 10.1038/nrg2936 - DOI - PubMed

Publication types