. 2016 Jun 2;7(6):e2248.
doi: 10.1038/cddis.2016.145.

Role of long non-coding RNA-RNCR3 in atherosclerosis-related vascular dysfunction

Affiliations

Role of long non-coding RNA-RNCR3 in atherosclerosis-related vascular dysfunction

K Shan et al. Cell Death Dis. .

Abstract

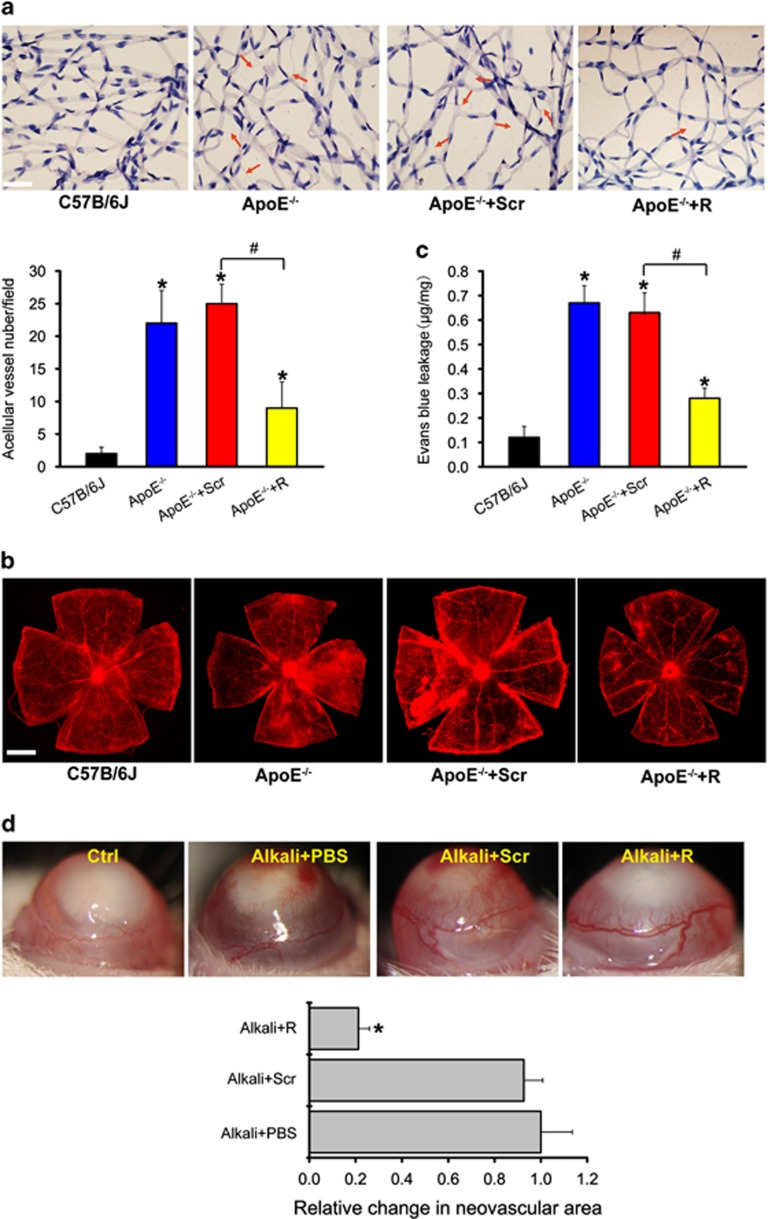
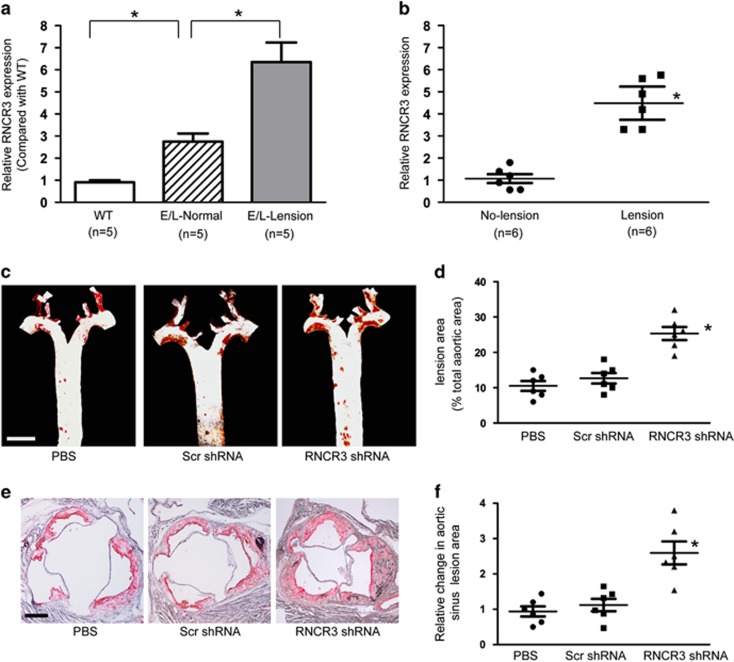
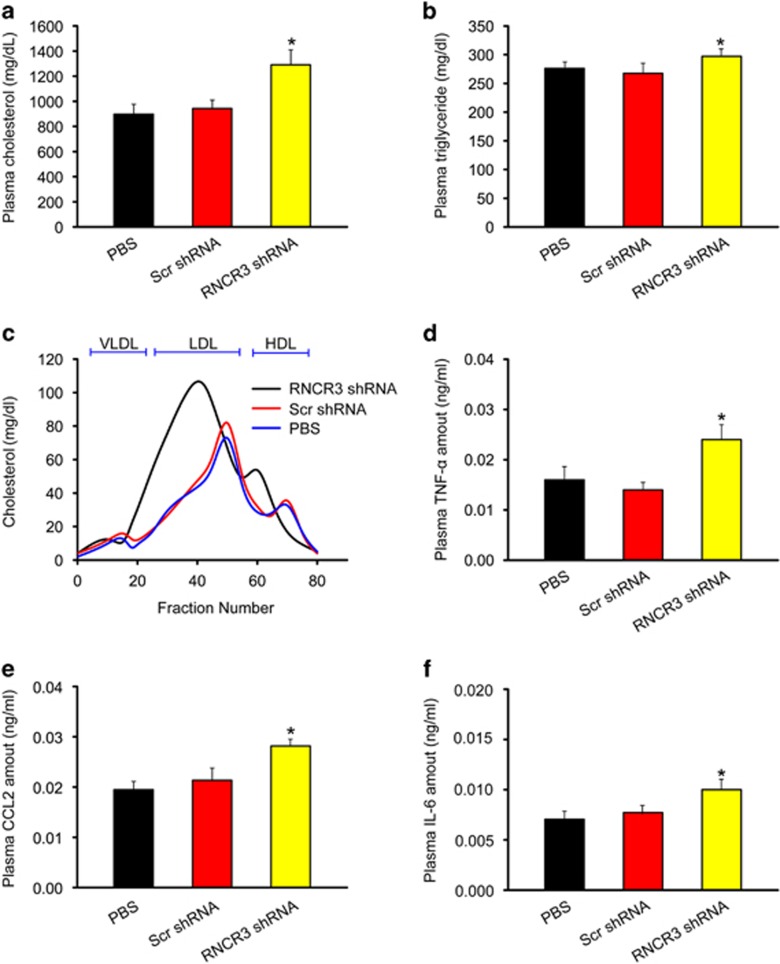
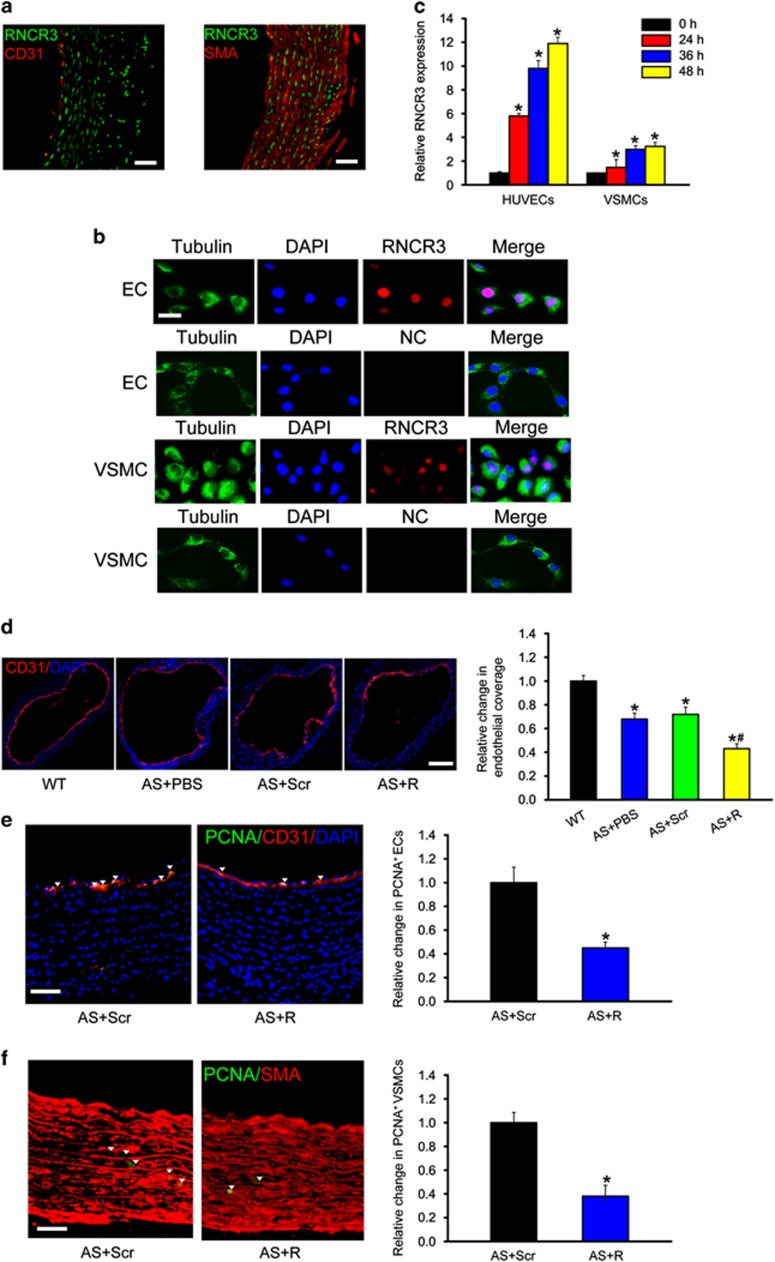
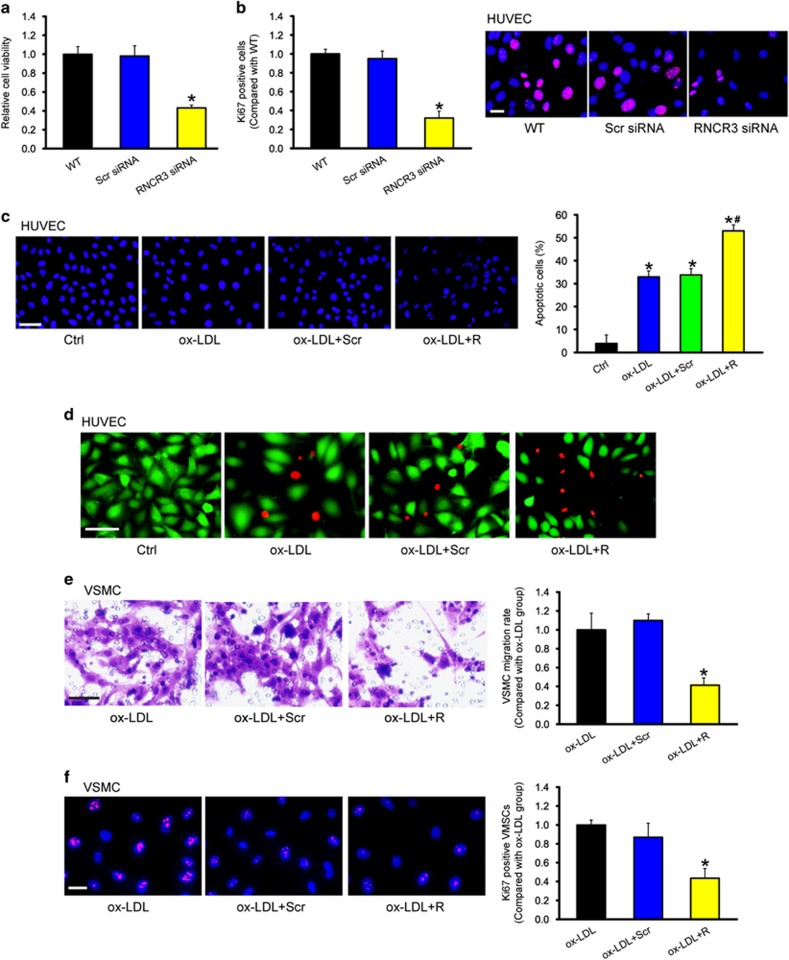
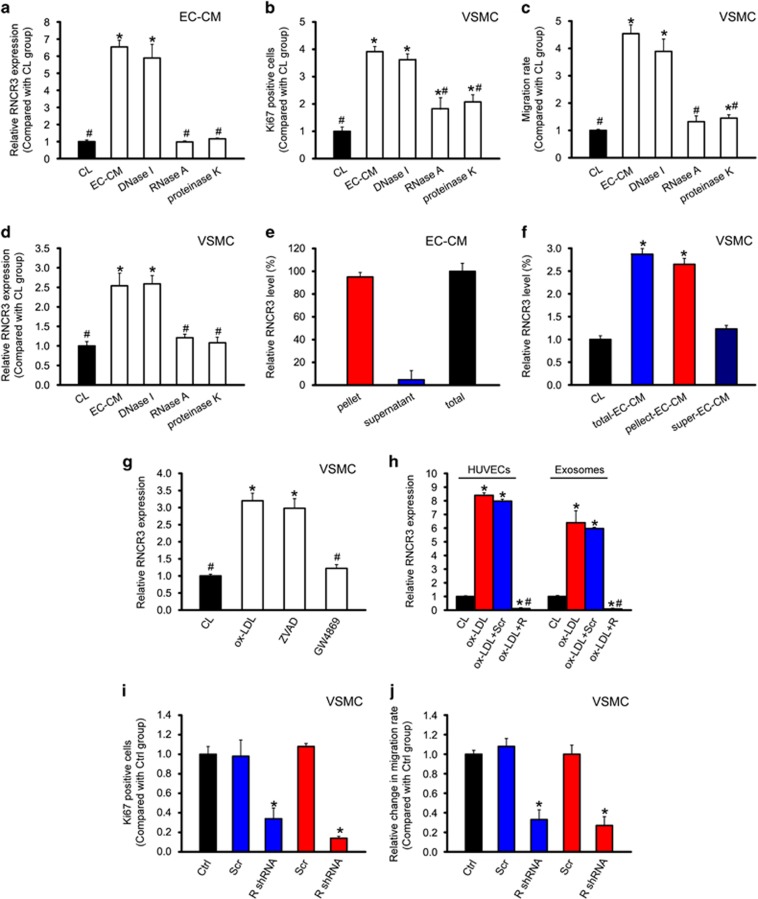
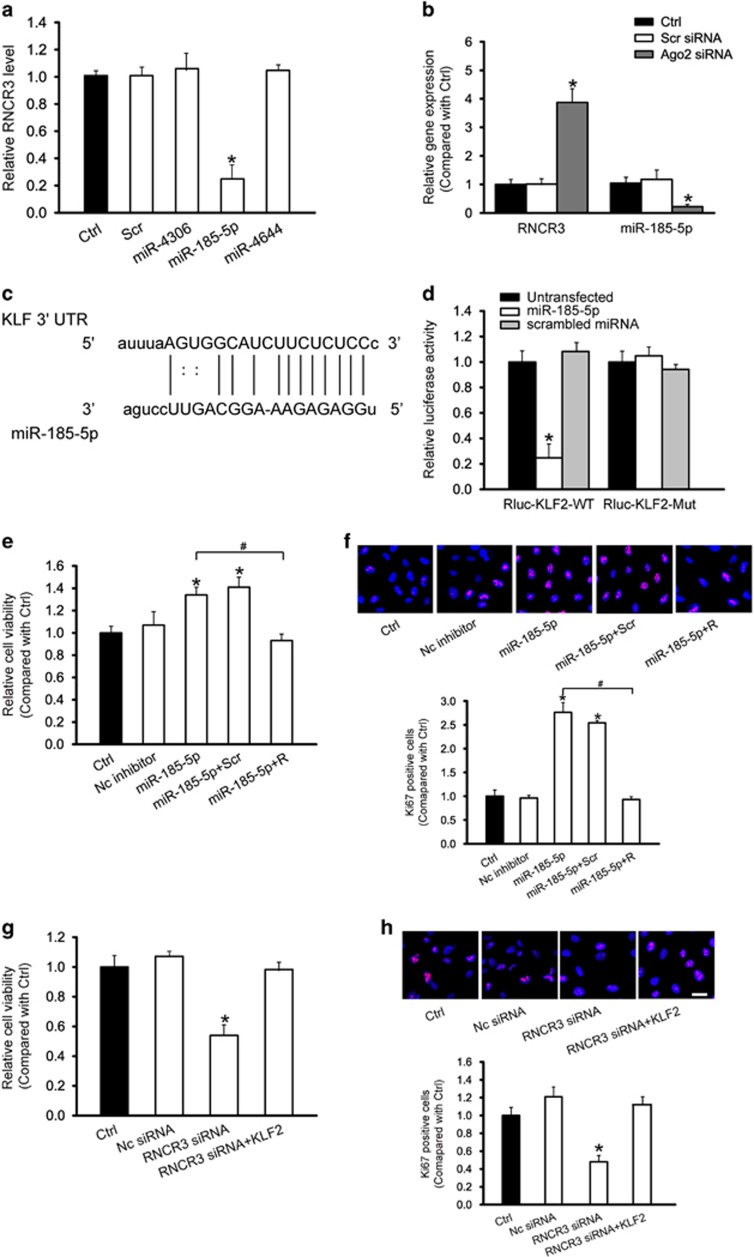
Atherosclerosis is one of the most common vascular disorders. Endothelial cell (EC) dysfunction and vascular smooth muscle cell (VSMC) proliferation contributes to the development of atherosclerosis. Long non-coding RNAs (lncRNAs) have been implicated in several biological processes and human diseases. Here we show that lncRNA-RNCR3 is expressed in ECs and VSMCs. RNCR3 expression is significantly upregulated in mouse and human aortic atherosclerotic lesions, and cultured ECs and VSMCs upon ox-LDL treatment in vitro. RNCR3 knockdown accelerates the development of atherosclerosis, aggravates hypercholesterolemia and inflammatory factor releases, and decreases EC and VSMC proliferation in vivo. RNCR3 knockdown also reduces the proliferation and migration, and accelerates apoptosis development of EC and VSMC in vitro. RNCR3 acts as a ceRNA, and forms a feedback loop with Kruppel-like factor 2 and miR-185-5p to regulate cell function. This study reveals that RNCR3 has an atheroprotective role in atherosclerosis, and its intervention is a promising strategy for treating atherosclerosis-related vascular dysfunction.


Figures

Figure 1
Figure 1
LncRNA-RNCR3 is involved in ocular vascular dysfunction. (ac) Four-week-old male ApoE−/− mice were fed with high-fat diet containing 0.15% cholesterol and 20% fat for 16 weeks. They were received subcutaneous injection of scrambled shRNA (ApoE−/−+Scr) or RNCR3 shRNA viral vector (ApoE−/−+R), or left untreated (ApoE−/−). shRNA injection was started at 4 weeks after feeding with high-fat diet. Viral vector was injected once every 2 weeks. Age-matched wild-type C57B/6J mice were used as the control group (C57B/6J). Retinal trypsin digestion was performed to detect the change of acellular capillaries. Red arrows indicated acellular capillaries. Acellular capillaries were quantified in 20 random fields per retina and averaged (A, n=4, scale bar, 20 μm). The above-mentioned groups were infused with Evans blue dye for 2 h. The fluorescence signaling of flat-mounted retina was observed using a microscope. A representative image was shown. Scale bar, 100 μm (b). Quantification of Evans blue leakage was conducted (c, n=4). *P<0.05 versus C57B/6J group; #P<0.05 ApoE−/−+R versus ApoE−/−+Scr group. (d) Four-month-old male C57B/6J mice were received alkali burn on the central corneas or left untreated (Ctrl), and then received an injection of RNCR3 shRNA (R), scrambled shRNA (Scr), or PBS. Four days after alkali burn, corneal neovasculature was observed by slit-lamp and vascular area was quantified (n=4). *P <0.05 versus Alkali+PBS group
Figure 2
Figure 2
LncRNA-RNCR3 is upregulated in aortic atherosclerotic lesion and its knockdown aggravates atherosclerosis in vivo. (a) RNCR3 expression in the aorta of 5-month-old male ApoE−/− and C57B/6J mice was determined by qRT-PCRs and normalized to the expression of GAPDH. The data were expressed as relative mRNA expression compared with average expression in wild-type group (WT). WT, wild type C57B/6J mice. E/L-lesion and E/L-normal: aorta segments with atherosclerotic lesions or without lesion (normal) from apoE−/− mice, respectively (*P<0.05). (b) RNCR3 expression was detected in atherosclerotic lesions and non-lesional aortic intimal tissues from human aortas (*P<0.05). (cf) Four-week-old male ApoE−/− mice were fed with high-fat diet containing 0.15% cholesterol and 20% fat for 16 weeks. They were received a subcutaneous injection of scrambled shRNA (Scr) or RNCR3 shRNA viral vector (R), or PBS. shRNA injection was started at 4 weeks after feeding with high-fat diet. Viral vector was injected once every 2 weeks. Representative en face Oil red O staining in the aortas of PBS-, scrambled shRNA-, and RNCR3 shRNA-injected mice. Scale bar, 0.5 cm. Atherosclerotic lesions quantification in en face aortas was expressed as the percentage of lesions relative to total aortic area (C and D, n=6 per group). Representative oil red O staining of aortic sinus in PBS-, scrambled shRNA-, and RNCR3 shRNA-injected mice. Scale bar, 300 μm. Aortic sinus lesion quantification was shown as the change compared with PBS-injected group. *P<0.05 versus PBS-injected group (e and f, n=6 per group)
Figure 3
Figure 3
RNCR3 knockdown aggravates hypercholesterolemia and increases inflammatory factor releases. Four-week-old male ApoE−/− mice were fed high-fat diet containing 0.15 cholesterol and 20% fat for 16 weeks. They were received a subcutaneous injection of scrambled shRNA (Scr) or RNCR3 shRNA viral vector (R), or PBS. shRNA injection was started at 4 weeks after feeding high-fat diet. Viral vector was injected once every 2 weeks. (a, b) Plasma cholesterol and triglycerides levels were detected in PBS-, scrambled shRNA-, and RNCR3 shRNA-injected mice (n=6 per group). (c) Fast protein liquid chromatographic (FPLC) lipoprotein profiles from the pooled plasma (n=6 per group) of PBS-, scrambled shRNA-, and RNCR3 shRNA-injected mice. (df) Plasma levels of TNF-α, CCL2, and IL-6 protein from PBS-, scrambled shRNA-, and RNCR3 shRNA-injected mice were quantified by ELISAs (n=6 per group). *P<0.05 versus PBS-injected group. HDL, high-density lipoprotein; LDL, low-density lipoprotein; VLDL, very low-density lipoprotein
Figure 4
Figure 4
RNCR3 knockdown affects EC and VSMC function in vivo. (a) In situ hybridization for RNCR3 (green) and immunostaining for CD31 (red) or SMA (red) was performed in thoracic aorta of wild-type C57B/6J mice. Scale bar, 50 μm. (b) RNA-FISH was performed to detect RNCR3 expression in ECs and VSMCs. Nuclei, blue; RNCR3, red; and Tubulin, green. Tubulin was detected as a cytoplasmic marker to show cell boundary. Scale bar, 20 μm. (c) HUVECs or VSMCs were exposed to proatherogenic ox-LDL (25 μg/ml) for the indicated time periods. qRT-PCRs were conducted to detect RNCR3 levels. The data were shown as fold increase compared with untreated group (0 h). *Significant difference compared with untreated group. (df) ApoE−/− mice were fed high-fat diet for 4 weeks, and then injected subcutaneously with RNCR3 shRNA adenovirus for additional 12 weeks (with high-fat diet). The scrambled shRNA or PBS was injected as the controls. Endothelial coverage of carotid artery was determined by CD31 immunostaining (CD31, red; DAPI, blue). *P<0.05 versus wild-type (WT) group. #P<0.05 AS+Scr shRNA (Scr) versus AS+RNCR3 shRNA (R). Scale bar, 200 μm (d). Endothelial proliferation of carotid artery was determined by double immunostaining for PCNA and CD31. Scale bar, 50 μm. *P<0.05 versus scrambled shRNA-injected group (e). Vascular smooth muscle cell proliferation of carotid artery was determined by double immunostaining for PCNA and SMA. Scale bar, 50 μm. *P<0.05 versus scrambled shRNA-injected group (f)
Figure 5
Figure 5
RNCR3 knockdown affects EC and VSMC function in vitro. HUVECs were transfected with scrambled (Scr) siRNA, RNCR3 siRNA, or left untreated (WT) for 48 h. Cell viability was detected using MTT method. *P<0.05 versus WT group (a, n=4). Ki67 immunofluorescence staining and quantitative analysis showed that RNCR3 knockdown reduced HUVEC proliferation. Scale bar, 20 μm. *P<0.05 versus WT group (b, n=4). (c) HUVECs were transfected with scrambled (Scr) siRNA, RNCR3 siRNA, or left untreated (WT), and then exposed to ox-LDL (25 μg/ml) for 48 h. The group without ox-LDL treatment was taken as the control group (Ctrl). Apoptotic cells were analyzed using Hoechst staining and quantitated. Scale bar, 50 μm. *P<0.05 versus Ctrl group; #P<0.05 versus Ctrl group; #P<0.05 AS+Scr shRNA (Scr) versus AS+RNCR3 shRNA (R). Dead or dying cells were analyzed using calcein-AM/PI staining. Green, viable cells; red, dead or dying cell. Scale bar, 50 μm (d, n=4). (e, f) HUVECs were transfected with scrambled siRNA, RNCR3 siRNA, or left untreated, and then exposed to ox-LDL (25 μg/ml) for 48 h. The medium was collected from these experimental groups, and then co-cultured with VSMCs for 24 h. VSMC migration or proliferation was detected using transwell migration assay or Ki67 staining. A representative image of cell migration (e, scale bar, 50 μm, n=4) and cell proliferation (f, scale bar, 20 μm, n=4) and quantification results were shown. *P<0.05 versus ox-LDL group
Figure 6
Figure 6
EC–VSMC communication is mediated by RNCR3-contained exosomes. (ac) HUVECs were exposed to ox-LDL for 24 h or left untreated (CL). The medium was centrifuged at 1000 × g for 10 min to remove cell debris. The supernatant was transferred to a new tube and spun at 120,000 × g for 120 min. The pellets were resuspended (designated as EC-CM). EC-CM was incubated with DNase I (1 unit/ml, Invitrogen, Carlsbad, CA, USA) or RNase A (10 μg/ml, Invitrogen) at 37 °C for 15 min, or proteinase K (PK, 20 μg/ml, Invitrogen) at 55 °C for 15 min and then at 95 °C for 5 min to inactivate PK. RNCR3 levels were detected in the control (CL) media or EC-conditioned media (CM) treated with DNase I, RNase A, or PK (a). VSMC proliferation (b) or migration (c) was detected using Ki67 staining or transwell migration assay. *P<0.05 versus CL media; #P<0.05 versus EC-CM group. (d) RNCR3 levels in VSMCs incubated with control (CL) media or the EC-conditioned media (CM) treated with DNase I, RNase A, or PK were detected. *P<0.05 versus CL media; #P<0.05 versus EC-CM group. (e, f) EC-CM was ultracentrifuged to fractionate the components in spin-down pellets (Pellet), or the remaining supernatant (Super). RNCR3 levels were detected in the pellet and supernatant fraction (e). RNCR3 levels in VSMCs incubated with control (CL) media, total or fractionated EC-CM for 6 h were detected. *P<0.05 versus CL media (f). (g) HUVECs were treated with apoptosis inhibitor Z-VAD-FMK (ZVAD) or the N-SMase inhibitor GW4869 after ox-LDL treatment for RNCR3 induction. VSMCs were incubated with the vesicles isolated from the above-mentioned HUVECs groups for 12 h. RNCR3 levels in VSMCs were detected. *P<0.05 versus CL media; #P<0.05 versus ox-LDL group. (h) HUVECs were transfected with RNCR3 siRNA, scrambled siRNA, or left untreated for 24 h, and then treated with or without ox-LDL (25 μg/ml) for 12 h. RNCR3 levels in HUVECs or exosomes were detected. *P<0.05 versus CL media; #P<0.05 versus ox-LDL group. (i, j) VSMCs were incubated with the media (CM) derived from ECs transfected with scrambled siRNA or RNCR3 siRNA, or co-cultured with ECs transfected with scrambled siRNA or RNCR3 siRNA for 24 h. VSMC without any treatment was taken as the control group. VSMC proliferation (i) or migration (j) was detected using Ki67 staining or transwell migration assay. *P<0.05 versus Ctrl group
Figure 7
Figure 7
RNCR3 regulates endothelial cell function by acting as a ceRNA. (a) HUVECs were transfected with different miRNA mimics, or left untreated (Ctrl) for 48 h. qRT-PCRs were conducted to detect RNCR3 levels. The data was expressed as relative change compared with Ctrl group. *P<0.05 versus Ctrl group. (b) HUVECs were transfected with Ago2 siRNA, scrambled siRNA, or left untreated (Ctrl). miR-185-5p or RNCR3 levels were detected using qRT-PCRs. *P<0.05 versus Ctrl group. (c) KLF2 was predicted as a target gene of miR-185-5p using TargetScan. The position of miR-185-5p binding site on KLF2 was shown. (d) KLF2 (RLuc-KLF2-WT) or mutant (RLuc-KLF2-Mut) was co-transfected with miR-185-5p mimic, scrambled miRNA mimic, or left untreated. Luciferase activity was detected using the dual luciferase assay. *P<0.05 versus untransfected group. (e–h) HUVECs were treated as shown. Cell viability was detected using MTT assay (e, g). A representative image for Ki67 staining along with quantification analysis data was shown. Scale bar, 20 μm (f, h). *P<0.05 versus Ctrl group. #Significant difference between the marked groups (#P<0.05)

References

    1. Libby P, Ridker PM, Hansson GK. Progress and challenges in translating the biology of atherosclerosis. Nature 2011; 473: 317–325. - PubMed
    1. Verweij SL, van der Valk FM, Stroes ES. Novel directions in inflammation as a therapeutic target in atherosclerosis. Curr Opin Lipidol 2015; 26: 580–585. - PubMed
    1. Schober A, Nazari-Jahantigh M, Wei Y, Bidzhekov K, Gremse F, Grommes J et al. MicroRNA-126-5p promotes endothelial proliferation and limits atherosclerosis by suppressing Dlk1. Nat Med 2014; 20: 368–376. - PMC - PubMed
    1. Loyer X, Potteaux S, Vion A-C, Guérin CL, Boulkroun S, Rautou P-E et al. Inhibition of microRNA-92a prevents endothelial dysfunction and atherosclerosis in mice. Circ Res 2014; 114: 434–443. - PubMed
    1. Lovren F, Pan Y, Quan A, Singh KK, Shukla PC, Gupta N et al. MicroRNA-145 targeted therapy reduces atherosclerosis. Circulation 2012; 126: S81–S90. - PubMed

Publication types

MeSH terms