. 2016 Aug;101(8):3144-54.
doi: 10.1210/jc.2016-1307. Epub 2016 Jun 2.

Rapid Proteasomal Degradation of Mutant Proteins Is the Primary Mechanism Leading to Tumorigenesis in Patients With Missense AIP Mutations

Affiliations

Rapid Proteasomal Degradation of Mutant Proteins Is the Primary Mechanism Leading to Tumorigenesis in Patients With Missense AIP Mutations

Laura C Hernández-Ramírez et al. J Clin Endocrinol Metab. 2016 Aug.

Abstract

Context: The pathogenic effect of mutations in the aryl hydrocarbon receptor interacting protein (AIP) gene (AIPmuts) in pituitary adenomas is incompletely understood. We have identified the primary mechanism of loss of function for missense AIPmuts.

Objective: This study sought to analyze the mechanism/speed of protein turnover of wild-type and missense AIP variants, correlating protein half-life with clinical parameters.

Design and setting: Half-life and protein-protein interaction experiments and cross-sectional analysis of AIPmut positive patients' data were performed in a clinical academic research institution.

Patients: Data were obtained from our cohort of pituitary adenoma patients and literature-reported cases.

Interventions: Protein turnover of endogenous AIP in two cell lines and fifteen AIP variants overexpressed in HEK293 cells was analyzed via cycloheximide chase and proteasome inhibition. Glutathione-S-transferase pull-down and quantitative mass spectrometry identified proteins involved in AIP degradation; results were confirmed by coimmunoprecipitation and gene knockdown. Relevant clinical data was collected.

Main outcome measures: Half-life of wild-type and mutant AIP proteins and its correlation with clinical parameters.

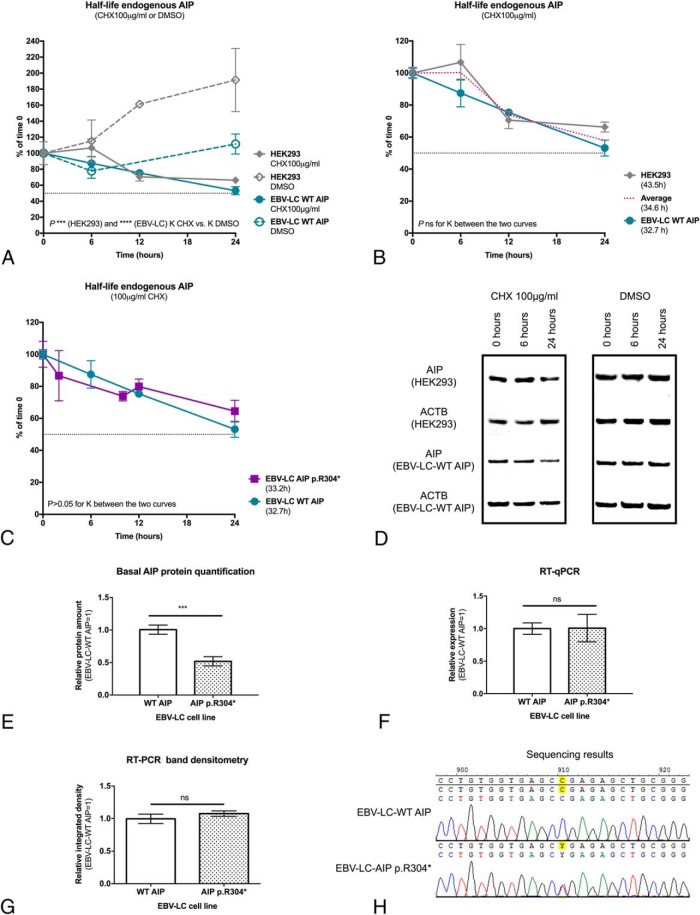
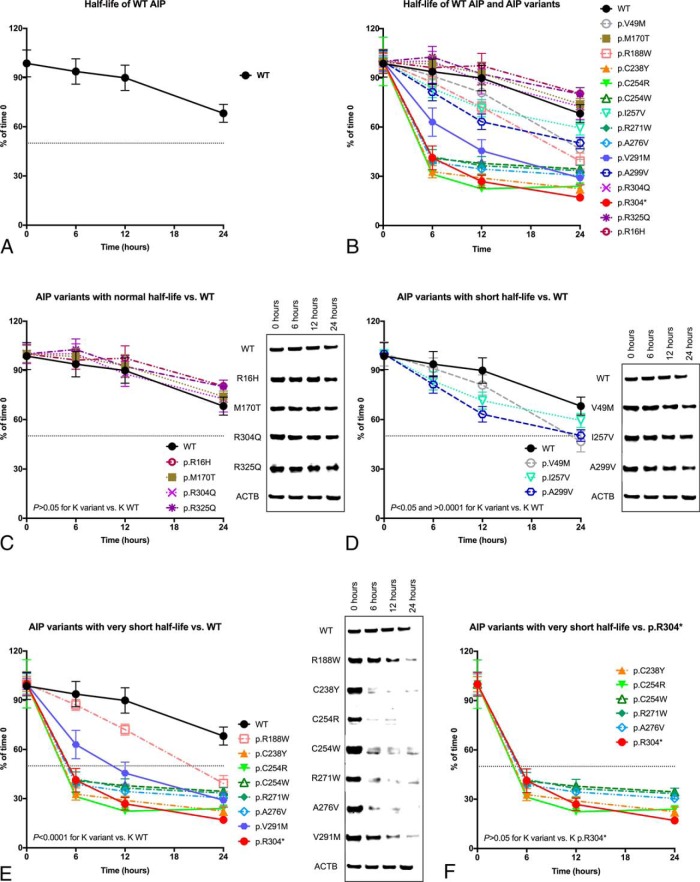
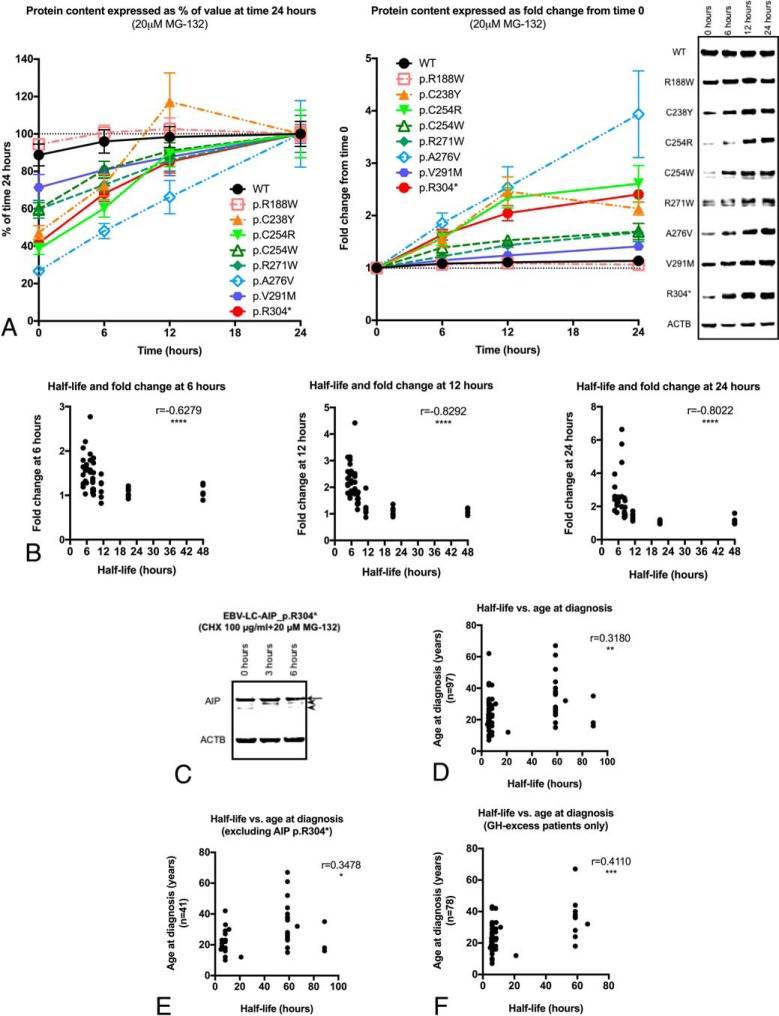
Results: Endogenous AIP half-life was similar in HEK293 and lymphoblastoid cells (43.5 and 32.7 h). AIP variants were divided into stable proteins (median, 77.7 h; interquartile range [IQR], 60.7-92.9 h), and those with short (median, 27 h; IQR, 21.6-28.7 h) or very short (median, 7.7 h; IQR, 5.6-10.5 h) half-life; proteasomal inhibition rescued the rapid degradation of mutant proteins. The experimental half-life significantly correlated with age at diagnosis of acromegaly/gigantism (r = 0.411; P = .002). The FBXO3-containing SKP1-CUL1-F-box protein complex was identified as the E3 ubiquitin-ligase recognizing AIP.

Conclusions: AIP is a stable protein, driven to ubiquitination by the SKP1-CUL1-F-box protein complex. Enhanced proteasomal degradation is a novel pathogenic mechanism for AIPmuts, with direct implications for the phenotype.

Trial registration: ClinicalTrials.gov NCT00461188.


Figures

Figure 1.
Figure 1.
Half-life of endogenous AIP in different cell lines. A, The measured AIP half-life in CHX-treated HEK293 and EBV-LC-AIP_WT cells was significantly shorter compared with DMSO controls in HEK293 and EBV-LC-AIP_WT cells (P < .0001 for both cell lines), confirming that the findings under these experimental conditions are due to the effect of CHX. ACTB, beta-actin. B, AIP half-life in HEK293 cells was not significantly different than the half-life in EBV-LC-AIP_WT. C, AIP half-life was almost identical in EBV-LC-AIP_WT and EBV-LC-AIP_p.304* cells, when considering band densitometry for the normal protein. D, In the half-life experiment using the EBV-LC-AIP_p.304* cells, the band for the p.R304* mutant (expected mass, 34.5 kDa) was not detected. In the representative WB images, the top panels are for the experiments with CHX and DMSO in HEK293 cells and the bottom panels are for EBV-LC-AIP_WT cells. WB bands for AIP (37.6 kDa) and the loading control beta-actin (ACTB) (41.7 kDa) are shown in each case. E, Protein quantification in basal conditions demonstrates a reduced level of the normal AIP protein in the EBV-LC-AIP_p.R304* cells, compared with the WT cell line. The differential expression of AIP observed in the two cell lines should be due to posttranslational regulation, the basal AIP mRNA levels are not different between the two cell lines, quantified by (F) RT-qPCR and (G) semiquantitative RT-PCR band densitometry. H, In concordance with these findings, the mutant cell line displays heterozygosity for AIP c.910C>T at the cDNA level.
Figure 2.
Figure 2.
Half-life of WT AIP and variants, overexpressed in HEK293 cells. A, Half-life curve for WT AIP. B, Half-life curves for all the variants studied, compared with WT AIP. Comparisons with the WT protein were established by means of the degradation speed (K) calculated from each half-life curve. C, Half-life curves for AIP variants with normal half-life (p.R16H, p.M170T, p.R304Q, and p.R325Q) and representative WB images, compared with WT AIP. D, Half-life curves for AIP variants with “short” half-life (p.V49M, p.I257V, p.A299V) and representative WB images, compared with WT AIP. E, Half-life curves for missense AIP variants with “very short” half-life (p.R188W, p.C238Y, p.C254R, p.C254W, p.R271W, p.A276V, p.V291M) and representative WB images, compared with the WT protein. F, Half-life curves for variants with half-life similar to the nonsense variant p.R304* (p.C238Y, p.C254R, p.C254W, p.R271W, p.A276V) and representative WB images, compared with AIP p.R304*. Myc-AIP, 39 kDa; Myc-AIP p.R304*, 35.8 kDa; ACTB, 41.7 kDa. ACTB loading control shown for the WT experiment in each case.
Figure 3.
Figure 3.
Blocking of proteasomal degradation with MG-132 (“rescue experiments”) and implications of AIP half-life for the phenotype in pituitary adenoma patients. A, Curves of protein contents for the experiments with the variants and WT protein, expressed as percentages (level at the 24-h time point was considered as 100% for each protein) or as fold change from time 0 (time 0 = 1) and representative WB images. The AIP variants p.R188W (fold change at 24 h, 1.1; global P = .5080) and p.V291M (fold change at 24 h, 1.4; global P = .1263) were stable. In contrast, levels of the other variants studied displayed a significant rise in response to MG-132: p.C238Y (fold change, 1.6 [P = .0403]; 2.5 [P = .0170]; and 2.1 [P = .0015] at 6, 12, and 24 h, respectively), p.C254R (fold change, 1.6 [P = .0087]; 2.3 [P = .0008]; and 2.6 [P = .0094]), p.C254W (fold change, 1.4 [P = .0910]; 1.5 [P = .0006]; and 1.7 [P = .0087]), p.R271W (fold change, 1.4 [P = .1796]; 1.5 [P = .0229]; and 1.7 [P = .0676]), p.A276V (fold change, 1.9 [P = .0072]; 2.5 [P = .0120]; and 3.9 [P = .0225]) and p.R304* (fold change, 1.6 [P = .0055]; 2 [P = .0041]; and 2.4 [P < .0001]). Myc-AIP, 39 kDa; Myc-AIP p.R304*, 35.8 kDa; ACTB, 41.7 kDa. ACTB loading control shown for the WT experiment in each case. B, Correlation between half-life and fold change after MG-132 treatment at 6, 12, and 24 h. A significant indirect correlation was found at the three time points, indicating proteins with shorter half-lives responded better to proteasome inhibition. C, MG-132 treatment of EBV-LC-AIP_p.R304* cells. In the AIP WB (using 40 μg of total protein) the strongest band (arrow) corresponds to the WT protein (37.6 kDa). Two faint extra bands can be observed: a first band that is absent at time 0 and appears after the treatment with MG-132 (top arrowhead) and a second, lower band (bottom arrowhead), which is more evident at time 0. Although both bands could correspond to degradation products, the heaviest one could possibly be given by a small amount of truncated protein, appearing after proteasomal degradation is inhibited (expected size, 34.5 kDa). Loading control: ACTB (41.7 kDa). D, The half-life of the studied AIP variants directly correlated with the age at diagnosis, (E) even when excluding patients with the p.R304* mutant; (F) the significance increased when considering only patients with acromegaly or gigantism.

References

    1. Vierimaa O, Georgitsi M, Lehtonen R, et al. Pituitary adenoma predisposition caused by germline mutations in the AIP gene. Science. 2006;312:1228–1230. - PubMed
    1. Daly AF, Vanbellinghen JF, Khoo SK, et al. Aryl hydrocarbon receptor-interacting protein gene mutations in familial isolated pituitary adenomas: Analysis in 73 families. J Clin Endocrinol Metab. 2007;92:1891–1896. - PubMed
    1. Leontiou CA, Gueorguiev M, van der Spuy J, et al. The role of the aryl hydrocarbon receptor-interacting protein gene in familial and sporadic pituitary adenomas. J Clin Endocrinol Metab. 2008;93:2390–2401. - PubMed
    1. Hernández-Ramírez LC, Gabrovska P, Dénes J, et al. Landscape of familial isolated and young-onset pituitary adenomas: prospective diagnosis in AIP mutation carriers. J Clin Endocrinol Metab. 2015;100:E1242–E1254. - PMC - PubMed
    1. Morgan RM, Hernández-Ramírez LC, Trivellin G, et al. Structure of the TPR domain of AIP: Lack of client protein interaction with the C-terminal alpha-7 helix of the TPR domain of AIP is sufficient for pituitary adenoma predisposition. PLoS One. 2012;7:e53339. - PMC - PubMed

Publication types

MeSH terms

Substances

Associated data