. 2017 May 4;11(3):211-232.
doi: 10.1080/19336918.2016.1195942. Epub 2016 Jun 2.

Desmoglein 3 regulates membrane trafficking of cadherins, an implication in cell-cell adhesion

Affiliations

Desmoglein 3 regulates membrane trafficking of cadherins, an implication in cell-cell adhesion

Hanan Moftah et al. Cell Adh Migr. .

Abstract

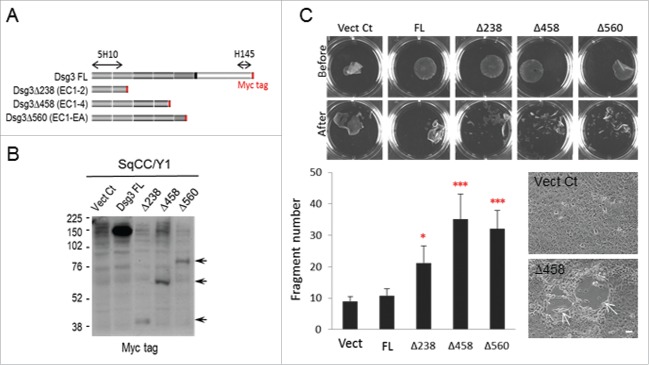
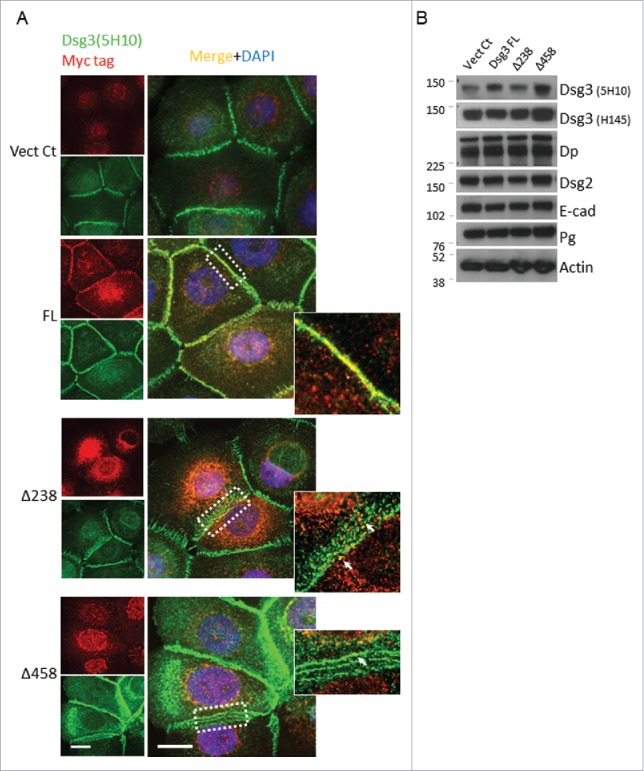
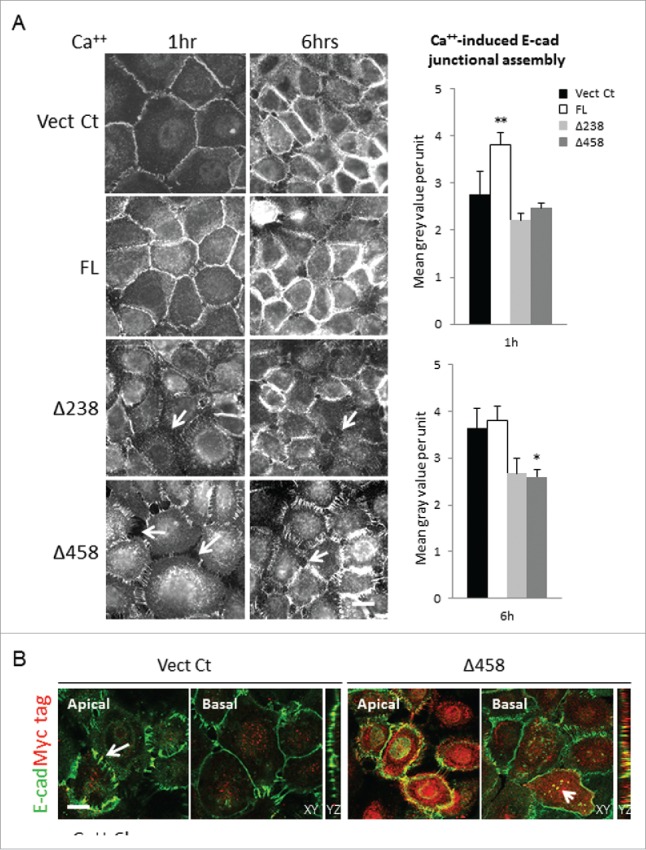
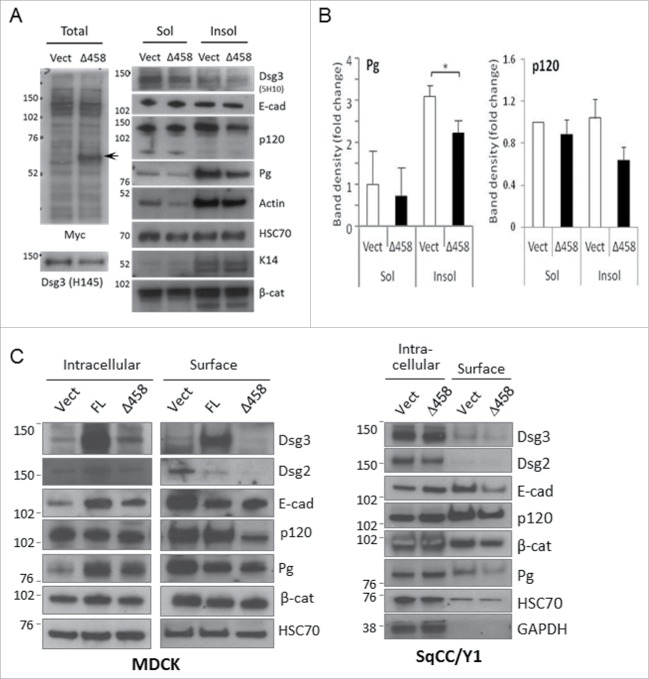
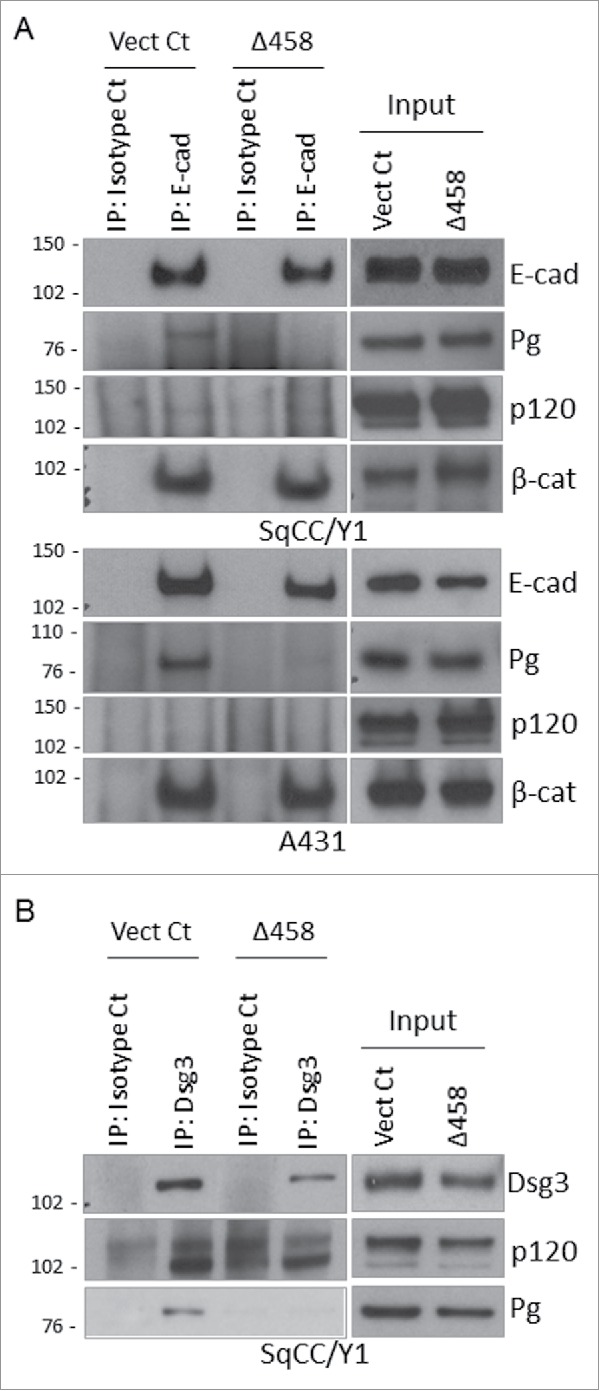
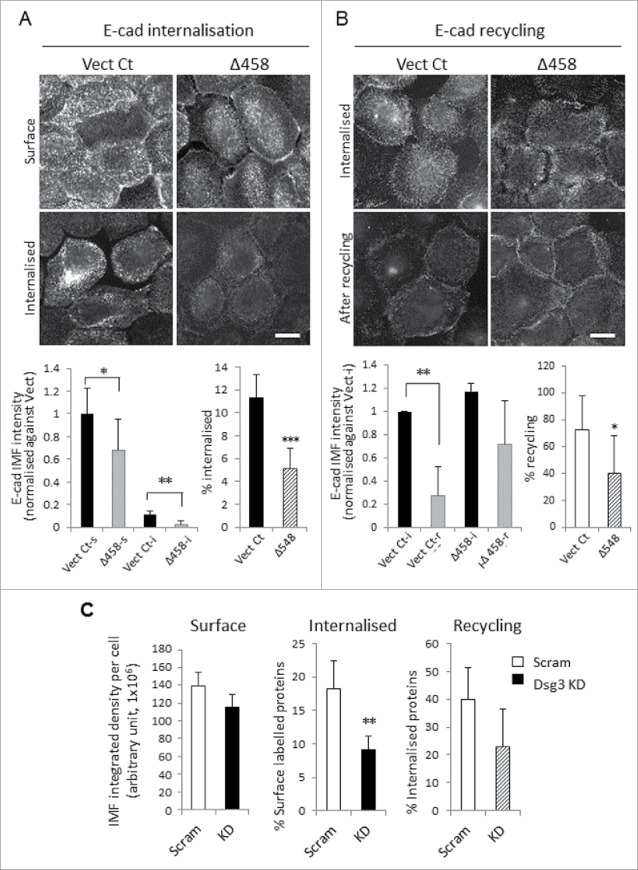
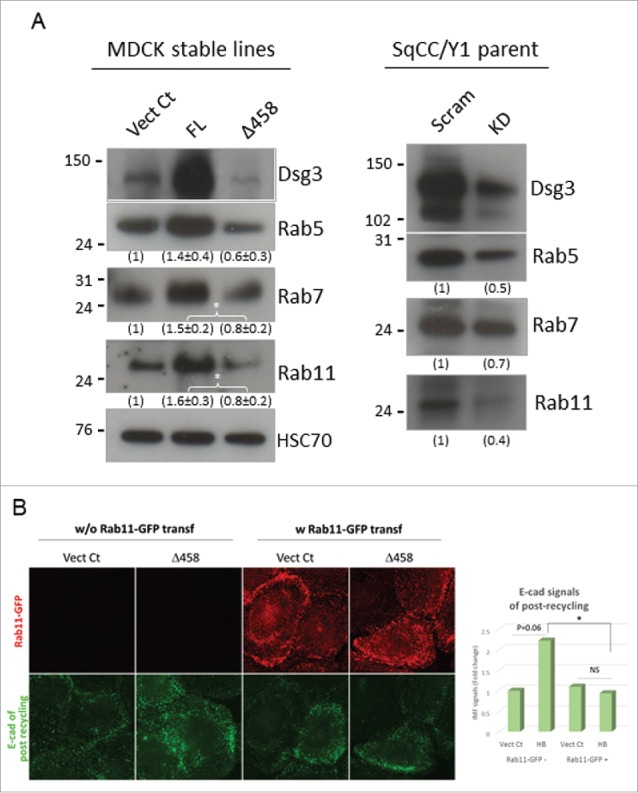
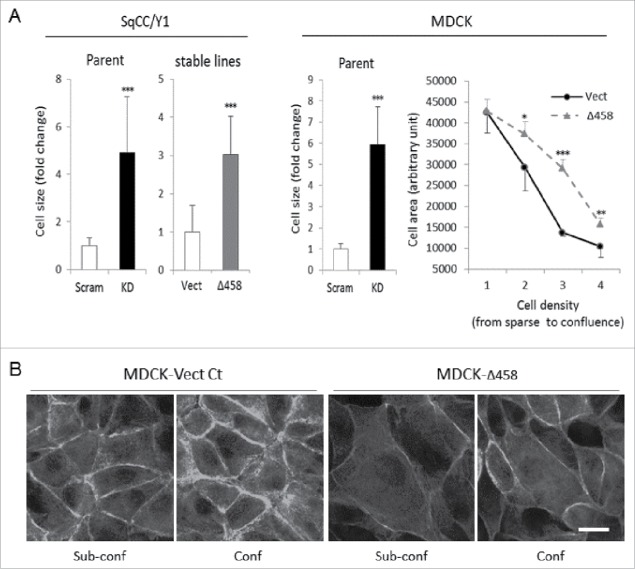
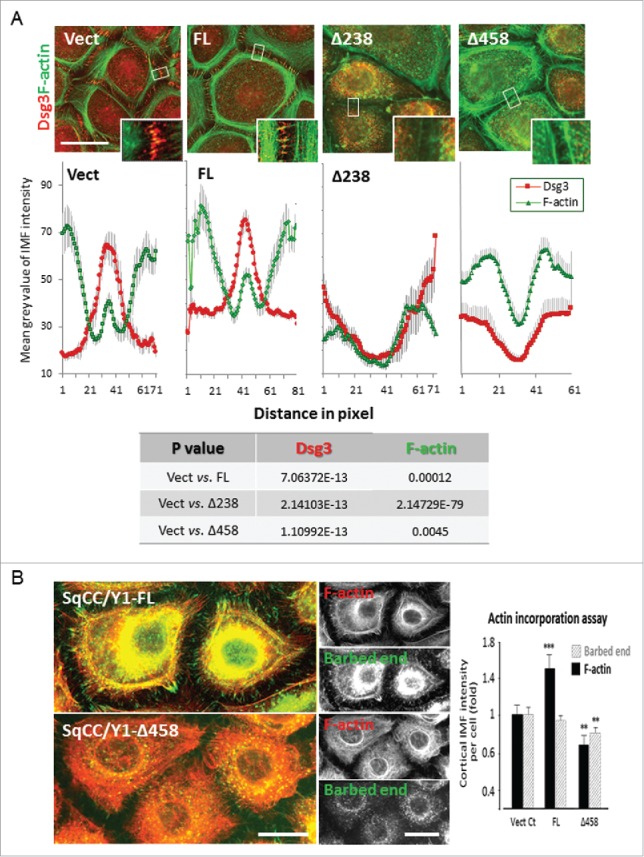
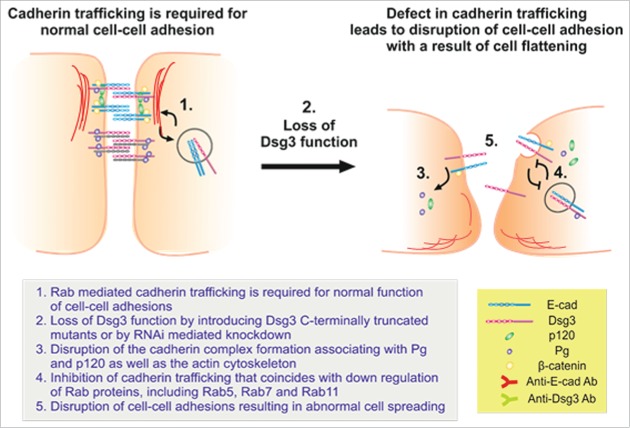
E-cadherin mediated cell-cell adhesion plays a critical role in epithelial cell polarization and morphogenesis. Our recent studies suggest that the desmosomal cadherin, desmoglein 3 (Dsg3) cross talks with E-cadherin and regulates its adhesive function in differentiating keratinocytes. However, the underlying mechanism remains not fully elucidated. Since E-cadherin trafficking has been recognized to be a central determinant in cell-cell adhesion and homeostasis we hypothesize that Dsg3 may play a role in regulating E-cadherin trafficking and hence the cell-cell adhesion. Here we investigated this hypothesis in cells with loss of Dsg3 function through RNAi mediated Dsg3 knockdown or the stable expression of the truncated mutant Dsg3ΔC. Our results showed that loss of Dsg3 resulted in compromised cell-cell adhesion and reduction of adherens junction and desmosome protein expression as well as the cortical F-actin formation. As a consequence, cells failed to polarize but instead displayed aberrant cell flattening. Furthermore, retardation of E-cadherin internalization and recycling was consistently observed in these cells during the process of calcium induced junction assembling. In contrast, enhanced cadherin endocytosis was detected in cells with overexpression of Dsg3 compared to control cells. Importantly, this altered cadherin trafficking was found to be coincided with the reduced expression and activity of Rab proteins, including Rab5, Rab7 and Rab11 which are known to be involved in E-cadherin trafficking. Taken together, our findings suggest that Dsg3 functions as a key in cell-cell adhesion through at least a mechanism of regulating E-cadherin membrane trafficking.

Keywords: E-cadherin trafficking; adherens junction; desmoglein 3; desmosome; epithelial cells; intercellular junction.


Figures

Figure 1.
Figure 1.
The expression of Dsg3 C-terminally truncated mutant compromised epithelial cell cohesion. (A) Schematic of Dsg3 full length (FL) and its 3 C-terminally truncated proteins (lacking the transmembrane domain and cytoplasmic tail) denoted as Δ238, Δ458 and Δ560, respectively, all of which are tagged with a Myc epitope at C-terminus. The binding sites of 3 antibodies used in the study are indicated by arrow lines or in red. (B) Western blotting of exogenous Dsg3 FL and truncated proteins in SqCC/Y1 oral keratinocyte lines with rabbit anti-Myc tag. The molecular weights of truncated proteins (indicated by arrows) were slightly larger than expected, i.e. 35 kDa for Δ238, 67 kDa for Δ458 and 80 kDa for Δ560. The weak bands shown in the Vect Ct and other lanes are likely to be non-specific bands detected by the rabbit antibody. (C) Dispase dissociation assay in SqCC/Y1 lines with stable expression of empty vector control (Vect Ct), FL and 3 truncated proteins that showed significantly enhanced fragmentation of epithelial sheets, after subjected to mechanical stress, in all 3 truncated cell lines compared to Vect Ct or FL cells whose integrity was largely intact. Cells were seeded at confluent density in 6-well plates and grew for 2 d before treated with dispase (2.4units/ml) for ∼30 min till completely detached (Before). The fragment data from 5 independent experiments were pooled before statistical analysis (n = 13∼16, mean ± SD, *p < 0.05, ***p < 0.001). The phase contrast micrographs showed disruption of cell-cell adhesion in Dsg3Δ458 cells during the course of dispase treatment (arrows) as opposed to control cells. Scale bar, 20 µm.
Figure 2.
Figure 2.
The expression of Dsg3ΔC proteins affects membrane distribution of native Dsg3. (A) SqCC/Y1 cells seeded on coverslips were double labeled with mouse anti-Dsg3 5H10 (green) and rabbit anti-Myc tag (red). The linear staining pattern of Dsg3 at the cell periphery was readily seen in both Vect Ct and FL cells (an enlarged image of dotted box is shown on the right). In contrast, a broad zone of abnormal, punctate staining was frequently observed in Dsg3ΔC cells with some dots displaying colocalisation of both channels (arrows). (B) Western blotting of total lysates of SqCC/Y1 cell lines with the indicated antibodies. No apparent reduction of Dsg3 and E-cadherin was observed in Dsg3ΔC cells as compared to control samples. Scale bar, 10 µm.
Figure 3.
Figure 3.
The E-cadherin junction assembly was perturbed in Dsg3ΔC cells. (A) SqCC/Y1 cell lines subjected to calcium switching (1.8 mM) for 1 hr and 6 hrs before immunostaining for E-cadherin with mAb HECD-1. Both Vect Ct and FL cells showed linear staining pattern at the cell borders at 1 hr of calcium switch and this was seen to be further enhanced at 6 hrs time point. However, in both Dsg3ΔC lines, the disrupted E-cadherin staining coupled with widened intercellular gaps was frequently seen in cell populations (arrows), indicating a retardation of E-cadherin junction assembly. Bar charts on the right were the quantitation of junctional cadherin that showed a significant increase in FL cells at 1 hr of calcium switch and a decrease in Dsg3Δ458 at 6 hrs, compared to Vect Ct (n > 50 cells, *p < 0.05, **p < 0.01). In addition, a trend of reduction of junctional cadherin was indicated in both Dsg3ΔC lines, compared to control or FL cells. (B) Confocal images of apical and basal frames as well as Z sections of Vect Ct and Δ458 cells with calcium switch for 6 hrs, and cells were double stained for E-cadherin (green) and Myc tag (red). The characteristic E-cadherin adhesion zippers were observed in the apical plane of control cells (arrows) but these were largely missing in Δ458 cells with abundant Myc positive, truncated protein expression. Colocalisation of both proteins was also observed in the cytoplasm of Δ458 cells (arrowhead in XY, and also YZ). Scale bar, 10 µm.
Figure 4.
Figure 4.
The Dsg3ΔC protein expression caused a reduction of cytoskeletal or membrane association of cadherins, Pg and p120-catenins. (A) Western blotting analysis of Triton soluble and insoluble fractions of MDCK Vect Ct and Δ458 lines that were subjected to calcium switch for 3 hrs. Left panels showed detection of Dsg3ΔC protein (top blot, arrow) and a slight reduction of native Dsg3 in Δ458 cells (bottom blot) compared to control with the indicated Abs. Reduced expression of Dsg3, Pg and p120 was observed in Δ458 cells, in particular in insoluble fraction, but no change was seen for E-cadherin, compared to control. (B) Densitometry of Pg and p120 blots in Triton soluble and insoluble fractions that showed a significant or a trend of reduction in insoluble fraction of Δ458 cells compared to the respective controls (n = 4, *p < 0.05). (C) Western blotting of purified surface vs intracellular proteins in MDCK and SqCC/Y1 cells subjected to calcium switch for 3 hrs. Reduced expression of cadherins, Pg and p120 was detected in surface pool of Δ458 cells compared to the respective control samples. Altered expression of cadherins was also seen in FL cells in both surface and intracellular pools.
Figure 5.
Figure 5.
Co-immunoprecipitation analysis showed a reduction of Pg and p120 in E-cadherin complex of Dsg3ΔC cells. (A) The E-cadherin complex in Vect Ct and Δ458 lines in both SqCC/Y1 and A431 purified with mAb HECD-1 was analyzed by Western blotting for Pg, p120 and β-catenins in addition to E-cadherin. Although little expression was seen for p120, an evident reduction of Pg, but not β-catenin, was detected in Δ458 cells relative to Vect Ct. (B) Western blotting analysis of immune complex purified with mAb 5H10 for Dsg3 in SqCC/Y1. A lack of detection for Pg and a reduction of p120 expression were observed in purified Dsg3 complex of Δ458 cells compared to control.
Figure 6.
Figure 6.
Altered E-cadherin internalization and recycling in cells with either Dsg3ΔC expression or Dsg3 depletion. (A, B) Analysis of E-cadherin internalization (A) and recycling (B) in live SqCC/Y1 Vect Ct and Δ458 lines. Cells seeded on coverslips were subjected to calcium switching (1.8 mM, keratinocyte growth medium) for 2 hrs prior to the internalization and recycling assays (details in Materials and Methods). For internalization, cells were surface labeled for E-cadherin with HECD-1 and then A488 conjugated mouse IgG on ice. A set of samples were fixed for determination of surface labeled proteins (Vect Ct-s and Δ458-s). Another set was incubated at 18°C for 30 min to allow surface labeled proteins to be internalized. Then, the remaining antibodies on the surface were quenched before fixation (Vect Ct-i and Δ458-i) and counterstained with DAPI. For recycling, the surface labeled E-cadherins were allowed to be internalized at 18°C for 30 min prior to surface antibodies quenching. A set of samples was fixed for later analysis of the internalized proteins (Vect Ct-i and Δ458-i) and the other was further incubated at 37°C for 30 min to allow internalized proteins to recycle back to the surface before another quench of the surface antibodies prior to fixation and DAPI staining (Vect Ct-r and Δ458-r). Images were acquired at arbitrary fields (≥ 5 fields/coverslip) and analyzed with ImageJ. Data were a representative of at least 3 independent experiments for both internalization and recycling assays (> 1000 cells per sample were included in the analysis, mean ± SD, *p < 0.05, **p < 0.01). Scale bar, 10 µm. (C) Reduced E-cadherin internalization and recycling were also detectable in SqCC/Y1 parent cells with Dsg3 knockdown (pooled of 2 experiments, >1000 cells per sample were included in the analysis, mean ± s.e.m, **p < 0.01).
Figure 7.
Figure 7.
Altered expression of Rab GTPases was shown in cells with either Dsg3ΔC expression or Dsg3 depletion. (A) Western blotting analysis of Rab5, Rab7 and Rab11 in total lysates of MDCK-Vect Ct, FL and Δ458 lines and also SqCC/Y1 parental cells treated with scrambled or Dsg3 siRNA. A trend of reduction of 3 Rabs was shown in Dsg3ΔC cells or cells with Dsg3 knockdown compared to the respective control cells. By contrast, an increase of all 3 Rabs was detected in MDCK FL cells with overexpression of Dsg3, compared to control. The densitometry data were shown underneath each blot (left: n = 3, *p < 0.05; right: n = 2). (B) E-cadherin recycling in SqCC/Y1-Vect Ct and Δ458 cells without or with transfection of Rab11-GFP. The result was a representative of 2 independent attempts (*p < 0.05) and showed a reduction of E-cadherin signals in Δ458 cells with transfection of Rab11-GFP compared to that without Rab11-GFP transfection.
Figure 8.
Figure 8.
Dsg3 knockdown and Dsg3ΔC expression caused an increase of cell size and abnormal spreading. (A) Quantitation of cell size (area) in SqCC/Y1 and MDCK cells with Dsg3 knockdown (KD) in parental cells or with stable expression of Dsg3Δ458 protein. A significant increase of cell size (≥ 3-fold) was consistently observed in both KD and Dsg3ΔC cells compared to the respective controls. Right graph shows result of MDCK Vect Ct and Δ458 cells that were seeded at a series of densities with the highest reaching confluent monolayer. All cells were subject to calcium switch for 3 hrs before F-actin staining with A488-phalloidin. Significantly increased cell size was readily detectable in Δ458 at all seeding densities except for the sparsest cultures, compared to controls. (n > 100 cells/sample, mean ± SD, *p < 0.05, **p < 0.01, ***p < 0.001) (B) Fluorescent images of F-actin staining in sub-confluence (Sub-conf) and confluence (Conf) MDCK cells subjected to calcium switch for 3 hrs. Augmented cell size coupled with reduced F-actin periphery staining (quantitation data not shown) was shown in Δ458 cells compared to control in both cell densities. Overall, an enhanced cortical F-actin formation was seen in confluent cultures relative to sub-confluence in both conditions. Scale bar, 10 µm.
Figure 9.
Figure 9.
Dsg3 is required for cortical F-actin assembly. (A) Quantitation of Dsg3 and F-actin staining at the junctions in cells with 1 hr calcium switch with ImageJ by a line scan tool across the junctions (the line width set at 50 pixels and the line length at 60 pixels as indicated by small white boxes that cover the junctional and part of the peripheral bundles of actin). Dsg3 was found to be relocated at the interface between cell-cell contacts (large peak) along with the junctional actin (small peak) in Vect control cells and these were significantly enhanced in FL cells. In striking contrast, a significant reduction of both Dsg3 and actin was detected in mutants. Data were mean±s .e.m and the results of Student t-test is shown in the table below. Scale bar, 20 µm. (B) Actin incorporation assay indicated a significant decrease of newly formed G-actin near the junctions in mutant compared to control and FL cells (**p < 0.01). Live cells subjected to 1 hr calcium switch were saponin-permeabilized followed by incorporation of Alexa 488-G-actin as described in Materials and Methods. Total F-actin was labeled with Rhodamine-phalloidin after fixation. Again, FL cells showed an enhanced F-actin staining near the cell periphery (***p < 0.001) and in contrast, this was significantly reduced in mutant cells (**p < 0.01).
Figure 10.
Figure 10.
A model that summarizes the major findings of the study. E-cadherin trafficking is required for normal cell-cell adhesions and junction stability, and this process seemed to be Dsg3-dependent. In cells with loss of Dsg3 function, either by RNAi mediated knockdown or by the expression of Dsg3ΔC dominant negative mutant, cell-cell adhesion is disrupted due to a lack of surface junction protein assembly, impaired cadherin complex formation and their association with the actin cytoskeleton, and a retardation of cadherin trafficking that is caused, at least in part, by the altered expression of Rab proteins. As a consequence, cell-cell junction cannot form properly resulting in augmented cell flattening and a failure in cell polarization.

References

    1. Hennings H, Holbrook KA. Calcium regulation of cell-cell contact and differentiation of epidermal cells in culture. An ultrastructural study. Exp. Cell Res 1983; 143 (1):127-42; PMID:6186504; https://doi.org/10.1016/0014-4827(83)90115-5 - DOI - PubMed
    1. Watt FM, Mattey DL, Garrod DR. Calcium-induced reorganization of desmosomal components in cultured human keratinocytes. J Cell Biol 1984; 99 (6):2211-5; PMID:6209289; https://doi.org/10.1083/jcb.99.6.2211 - DOI - PMC - PubMed
    1. Garrod D, Chidgey M. Desmosome structure, composition and function. Biochim Biophys Acta 2008; 1778 (3):572-87; PMID:17854763; https://doi.org/10.1016/j.bbamem.2007.07.014 - DOI - PubMed
    1. Kanno M, Isa Y, Aoyama Y, Yamamoto Y, Nagai M, Ozawa M, Kitajima Y. P120-catenin is a novel desmoglein 3 interacting partner: identification of the p120-catenin association site of desmoglein 3. Exp Cell Res 2008; 314(8):1683-92; PMID:18343367; https://doi.org/10.1016/j.yexcr.2008.01.031 - DOI - PubMed
    1. Nanes BA, Chiasson-MacKenzie C, Lowery AM, Ishiyama N, Faundez V, Ikura M, Vincent PA, Kowalczyk AP. p120-catenin binding masks an endocytic signal conserved in classical cadherins. J Cell Biol 2012; 199 (2):365-80; PMID:23071156; https://doi.org/10.1083/jcb.201205029 - DOI - PMC - PubMed

Publication types