RAB2A controls MT1-MMP endocytic and E-cadherin polarized Golgi trafficking to promote invasive breast cancer programs
- PMID: 27255086
- PMCID: PMC4931572
- DOI: 10.15252/embr.201642032
RAB2A controls MT1-MMP endocytic and E-cadherin polarized Golgi trafficking to promote invasive breast cancer programs
Abstract
The mechanisms of tumor cell dissemination and the contribution of membrane trafficking in this process are poorly understood. Through a functional siRNA screening of human RAB GTPases, we found that RAB2A, a protein essential for ER-to-Golgi transport, is critical in promoting proteolytic activity and 3D invasiveness of breast cancer (BC) cell lines. Remarkably, RAB2A is amplified and elevated in human BC and is a powerful and independent predictor of disease recurrence in BC patients. Mechanistically, RAB2A acts at two independent trafficking steps. Firstly, by interacting with VPS39, a key component of the late endosomal HOPS complex, it controls post-endocytic trafficking of membrane-bound MT1-MMP, an essential metalloprotease for matrix remodeling and invasion. Secondly, it further regulates Golgi transport of E-cadherin, ultimately controlling junctional stability, cell compaction, and tumor invasiveness. Thus, RAB2A is a novel trafficking determinant essential for regulation of a mesenchymal invasive program of BC dissemination.
Keywords: RAB GTPases; RAB2A; cancer migration and invasion; membrane trafficking.
© 2016 The Authors.
Figures

- A
Primary siRNA screening analysis. MDA‐MB‐231 cells were reverse‐transfected with siRNA pools against MT1‐MMP, TKS5, or each human RAB GTPase and were plated on fluorescein‐labeled gelatin‐coated optical microplates. Degradation activity was measured by counting the number of cells degrading gelatin identified as dark black foci (similar results were obtained by measuring the area of degradation/number of cells). The inset shows representative images of degraded Oregon green gelatin (upper panels) and merged images with TRITC‐phalloidin (red) and DAPI (blue) in scrambled siRNA (NC), or siRNA against RAB28‐ or RAB42‐transfected cells (lower panel). Data are means ± SEM of 3 independent experiments. Scale bar, 50 μm.
- B
Secondary siRNA screening analysis was performed on candidate RAB GTPases selected from the primary screen using 3 individual deconvoluted siRNAs. Data are mean ± SD (n > 5 different fields/experiment).
- C–E
Tertiary siRNA screening. Pooled siRNAs against candidate RAB GTPases identified from the secondary screen or TKS5, used as control, were transfected into MCF10.DCIS.com cells. Cells plated onto fluorescently conjugated gelatin (red) were stimulated with 100 ng/ml HGF overnight in the presence or absence of GM6001, followed by staining with FITC‐phalloidin (green) and DAPI (blue) (C). Efficacy of targeted gene silencing was verified by qPCR (E). Scale bar, 50 μm. Data are the mean ± SEM (n > 100 cells/experiment in at least 4 independent ones). *P < 0.05, **P < 0.01, ***P < 0.001.
- F–H
Inverse invasion assay. An equal number of MDA‐MB‐231 cells were reverse‐transfected with a mixture of three individual siRNA oligonucleotides targeting interest genes. Invasive activity is shown as the average number of cells/field that migrates into fibronectin‐supplemented (25 μg/ml) Matrigel further than 20 μm (F, G). Efficacy of targeted gene silencing was verified by qPCR (H). Scale bar, 250 μm. Data are mean ± SD from three different fields from one representative experiment out of 5 that were performed. *P < 0.05, ***P < 0.001.
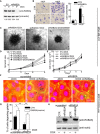
- A
Doxycycline‐inducible empty vector (EV) or RAB2A‐shRNA MDA‐MB‐231 cells were cultured in the absence (−) or presence (+) of doxycycline for 3 days and immunoblotted with anti‐RAB2A and anti‐actin antibodies. The intensity of RAB2A relative to actin is shown on the bottom. Relative density in uninduced EV cells was set to 1.
- B
Doxycycline‐inducible RAB2A‐shRNA MDA‐MB‐231 cells were cultured in the absence (CTR) or presence (shRAB2A) of doxycycline for three days. Invasion of MDA‐MB‐231 cells through Matrigel‐coated transwells toward HGF was assessed after 24 h. Representative images are shown. Scale bar, 200 μm. Data are the mean ± SD (n = 10 field/condition in at least 3 experiments). ***P < 0.001.
- C–E
EV and shRAB2A MDA‐MB‐231 cells were embedded in spheroid formation ECMR in the absence (−) or presence (+) of doxycycline and/or GM6001. After 3 days, the cells were transferred into Invasive MatrixR. Phase contrast images of representative spheroids are shown after 9 days (C). Dashed circle indicates the size of spheroids at day 0. Scale bars, 500 μm. Invasive activity into ECM was expressed as total spheroid area (relative to control cells at day 0) quantified by ImageJ (D). The number of cells at the indicated days was quantified by CyQUANTR Cell Proliferation Assay Kit (E). Data are the mean ± SD (n = 3 independent experiments). *P < 0.05.
- F–H
Doxycycline‐inducible murine RAB2A (mRAB2A) expression MCF10.DCIS.com cells were transfected with scrambled siRNA or siRNA against human RAB2A (siRAB2A) in the absence (−) or presence (+) of doxycycline. Serum‐starved cells were plated onto fluorescently conjugated gelatin (red), stimulated with HGF (100 ng/ml) overnight, and stained with phalloidin (green) and DAPI (blue) (f). Scale bar, 50 μm. Silencing of endogenous RAB2A protein (lower band) and ectopic RAB2A expression (upper band) was verified by immunoblotting (H). Data are the mean ± SEM (error bars; n > 100 cells/experiment in 4 independent ones) (G). *P < 0.05, **P < 0.01.
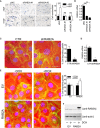
- A, B
MDA‐MB‐231 cells were transfected with scrambled siRNA (siNC) or siRNAs against RAB2A (siRAB2A #1 or #2). Invasion of MDA‐MB‐231 cells through Matrigel‐coated transwells toward HGF assessed after 24 h. Representative images are shown (A). Efficacy of RAB2A silencing was verified by qPCR (B). Scale bar, 200 μm. Data are the mean ± SD (n = 10 field/condition). **P < 0.01, ***P < 0.001, NS, not significant.
- C, D
Doxycycline‐inducible RAB2A‐shRNA MCF10.DCIS.com cells were cultured in the absence (CTR) or presence (shRAB2A) of doxycycline for three days. Serum‐starved cells were then plated onto fluorescently conjugated gelatin (red), stimulated with HGF (100 ng/ml) overnight, and stained with phalloidin (green) and DAPI (blue). Efficacy of RAB2A gene silencing was verified by qPCR (D). Scale bar, 50 μm. Data are the mean ± SEM (n > 100 cells/experiment in three independent ones). *P < 0.05.
- E, F
ECM degradation activities of doxycycline‐inducible empty vector (EV) or RAB2A expression MCF10.DCIS.com cells cultured in the absence (−) or presence (+) of doxycycline were quantified. Total cell lysate was immunoblotted with anti‐RAB2A and anti‐actin antibodies (F). Scale bar, 50 μm. Data are the mean ± SEM (n > 100 cells in at least 3 independent experiments). *P < 0.05.

- A
Images are representative of RAB2A expression scoring according to intensity staining in TMA. In tumor tissues, the IHC signals were associated with the tumor cell component and not with the adjacent or infiltrating stroma.
- B
Correlation of RAB2A expression with clinicopathological parameters. Only for 520 of 622 samples, expression data for RAB2A were available. Note that the number of scored cases is lower than the total number of cases since: i) in some cases, individual cores detached from the slides during the manipulations; ii) clinical information was not available for all patients. In tumor tissues, the IHC signal was associated with the tumor cell component and not with the adjacent or infiltrating stroma.
- C, D
Kaplan–Meier distant recurrence‐free interval survival (DRFI 70) (C) and univariate and multivariate Cox regression analysis (D) show that in BC patients, high levels of RAB2A protein predict a poor prognosis and that RAB2A expression is an independent predictor of higher risk of developing a distant metastatic recurrence.
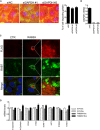
- A, B
MCF10.DCIS.com cells were transfected with scrambled siRNA (siNC) or siRNAs against GAPDH (siGAPDH). Serum‐starved cells were then plated onto fluorescently conjugated gelatin (red), stimulated with HGF (100 ng/ml) overnight, and stained with phalloidin (green) and DAPI (blue). Efficacy of GAPDH gene silencing was verified by qPCR (B). Scale bar, 50 μm. Data are the mean ± SEM (n > 100 cells/experiment in three independent ones). ***P < 0.001.
- C
Doxycycline‐inducible RAB2A expression MCF10A cells were cultured in the absence (CTR) or presence (RAB2A) of doxycycline and immunostained with anti‐FLAG (red) and anti‐RAB7 (green) antibodies. Merged images with DAPI (blue) are shown on the bottom. Scale bar, 10 μm (inset, 2 μm).
- D
Doxycycline‐inducible empty vector (EV) or RAB2A expression MCF10A cells were cultured in the absence (−Dox) or presence (+Dox) of doxycycline for three days, and the expression of E‐cadherin and mesenchymal genes was quantified by qPCR. Data are the mean ± SEM (n = 3 independent experiments). ***P < 0.001.
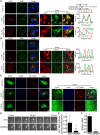
- A, B
MCF10.DCIS.com cells were transfected with FLAG empty vector (EV), constitutively active RAB2A‐Q65L, or dominant‐negative RAB2A‐S20N mutant. Cells were immunostained with anti‐FLAG (red) and RAB7 (A, green) or anti‐EEA1 (B, green) antibodies. Merged images with DAPI (blue) are shown on the right. Enlarged endosomes in the boxed region are highly magnified in the insets. Diameters of RAB7‐positive vesicles are also shown. n, number of cells scored for each cell population. The RGB profiler plugin from ImageJ was used to plot colocalization in the lines drawn in the inset images. Scale bars, 10 μm (inset, 2 μm). Data are shown as a box and whiskers diagram. ***P < 0.001.
- C
MDA‐MB‐231 cells were transfected with EGFP‐fused EV, RAB2A‐Q65L, or RAB2A‐S20N. Cells are immunostained with anti‐RAB7 (blue) and anti‐MT1‐MMP (red) antibodies, and their merged images are shown on the right. Enlarged endosomes containing MT1‐MMP in the boxed region are highly magnified in the insets. Note that RAB2A‐Q65L‐ and RAB7‐positive vesicles contain MT1‐MMP (arrows). Scale bars, 10 μm (inset, 2 μm).
- D–F
MDA‐MB‐231 cells expressing MT1‐MMP‐pHluorin transfected with scrambled siRNA (siNC) or siRNA against RAB2A were seeded on type I collagen, and images were acquired for 20‐min period by TIRF microscope. Frequency of MT1‐MMP‐pHluorin exocytic events was quantified (E). The corresponding time‐lapse series are shown in Movie EV1, while an entire cell is shown in Movie EV2. Efficacy of RAB2A gene silencing was verified by qPCR (F). Scale bars, 2 μm. Data are the mean ± SD of 5‐10 cells of least three independent experiments. **P < 0.01.
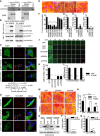
- A
Total cell lysates from HEK293T cells transfected with myc‐VPS39 or VPS41 were incubated with GST empty vector (EV), RAB2A‐S20N (SN), or RAB2A‐Q65L (QL) proteins bound to glutathione sepharose beads. Immunoblotting was performed with anti‐myc antibody. Input lysates are also shown. GST proteins loaded in gels were stained with CBB.
- B
FLAG EV or RAB2A was transiently co‐transfected with EGFP‐VPS39 or VPS41 into HEK293T cells. Immunoprecipitated (IP) fraction from cell lysates with anti‐FLAG antibody and total lysates was immunoblotted with the antibodies indicated on the right.
- C, D
MDA‐MB‐231 cells were transfected with EGFP‐fused EV, VPS39, or VPS41. Cells were immunostained with RAB7 (C, red) or anti‐MT1‐MMP (D, red) antibodies. Merged images with DAPI (blue) are shown on the right. Enlarged endosomes in the boxed region are highly magnified in the insets. Diameters of RAB7‐positive vesicles are also shown. n, number of cells scored for each cell population. Scale bars, 10 μm (inset, 5 μm). Data are shown as a box and whiskers diagram. ***P < 0.001.
- E–I
Scrambled siRNA (siNC) or siRNA against RAB2A (siRAB2A), VPS39 (siVPS39), or VPS41 (siVPS41) was transfected into MCF10.DCIS.com cells. Serum‐starved cells were then plated onto fluorescently conjugated gelatin (red), stimulated with HGF (100 ng/ml) overnight, and stained with phalloidin (green) and DAPI (blue). Quantification of gelatin degradation (F) and efficacy of targeted gene silencing verified by qPCR (G–I). Data are the mean ± SEM (n > 100 cells/experiment in at least 4 independent ones). Scale bars, 50 μm. **P < 0.01, ***P < 0.001.
- J–L
Inverse invasion assay of MDA‐MB‐231 cells transfected with siRNA oligonucleotides targeting interest genes. Invasive activity is the numbers of cells/field that migrate through Matrigel further than 50 μm (K). Efficacy of targeted gene silencing was verified by qPCR (L). Scale bar, 250 μm. Data are mean ± SD from 3 different fields. **P < 0.01, ***P < 0.001.
- M–Q
Doxycycline‐inducible murine RAB2A expression MCF10.DCIS.com cells were transfected with siNC, siRAB2A, or siVPS39 in the absence (CTR) or presence (RAB2A) of doxycycline. Their ECM degradation activities were quantified (n). Total cell lysates were immunoblotted with anti‐RAB2A and anti‐tubulin antibodies (O). Efficacy of targeted gene silencing was verified by qPCR (P, Q). Scale bar, 50 μm. Data are the mean ± SEM (n > 100 cells/experiment in 3 independent ones). *P < 0.05, **P < 0.01, ***P < 0.001, NS, not significant.

- A
Doxycycline‐inducible RAB2A‐shRNA MCF10.DCIS.com cells were incubated on a thick layer of Matrigel for 4 days to allow spheroid formation in the absence (CTR) or presence (shRAB2A) of doxycycline. Cells were stimulated with 5 ng/ml EGF and 20 ng/ml HGF (EGF+HGF) or left starved (STV) for 9 days. Representative phase contrast images are shown. Invasive activity of the cells was expressed by circularity (with a value of 1 representing perfect circularity = no invasion) of each acinus. Scale bar, 100 μm. Data are the mean ± SEM (n > 100 spheroids in 4 independent experiments. ***P < 0.001, NS, not significant.
- B–D
MCF10.DCIS.com cells (104 cells) transfected with scrambled siRNA (siNC) or siRNA against RAB2A (siRAB2A) were plated onto 6‐well dish. Representative phase contrast images (B) and the distribution of cell numbers per cluster of the indicated cell number (C) are shown. Efficacy of RAB2A gene silencing was verified by qPCR (D). Scale bar, 200 μm. Data are means ± SD of 10 fields (n > 60 cells/field) of independent 4 independent experiments. ***P < 0.001.
- E
Doxycycline‐inducible RAB2A‐shRNA MCF10.DCIS.com cells were cultured in the absence (CTR) or presence (shRAB2A) of doxycycline for three days and immunostained with antibodies indicated on the top (green) and DAPI (blue). Scale bar, 10 μm.
- F, G
MCF‐10AneoT (E) and MCF10‐CA1a (F) cells were transfected with scrambled siRNA (siNC) or siRNA against RAB2A, and immunostained with antibodies indicated on the top (green) and DAPI (blue). Scale bars, 10 μm.
- H
Total cell lysates from (E, F and G) were immunoblotted with anti‐E‐cadherin, RAB2A, and anti‐actin antibodies.
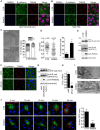
- A, B
Doxycycline‐inducible RAB2A expression MCF10.DCIS.com (A) and MCF10A (B) cells were cultured in the absence (CTR) or presence (RAB2A) of doxycycline, and immunostained with anti‐RAB2A (blue), anti‐E‐cadherin (green), and anti‐TGN46 (red) antibodies. Merged images with DAPI (magenta) are shown on the right. Scale bars, 10 μm.
- C
CTR and RAB2A MCF10A cells (104 cells) were plated onto 6‐well dish. Representative phase contrast images (left) and the distribution of cell numbers per cluster composed of the indicated number of cells are shown. Scale bar, 100 μm. Data are means ± SD of 10 fields (n > 20 cells/field) from 3 independent experiments. ***P < 0.001.
- D
The circularity of CTR and RAB2A MCF10A cells and the percentage of cells with protrusive structure were quantified. Data are means ± SD of ten independent fields (n > 100 cells/field). n, number of cells scored for each cell population. ***P < 0.001.
- E
Total cell lysates from (C) were immunoblotted with antibodies anti‐E‐cadherin, which recognize either an epitope in the cytoplasmic domain (IC), an epitope in the extracellular domain of mature E‐cadherin (SHE78‐7), respectively, or anti‐RAB2A, and anti‐actin. An arrow indicates the unprocessed form of E‐cadherin.
- F–H
MCF10A cells were transfected with scrambled siRNA (siNC) or siRNA against furin, and immunostained with anti‐E‐cadherin (green) and anti‐TGN46 (red) antibodies. Merged images with DAPI (blue) are shown on the right (F). Scale bar, 20 μm. Total cell lysates were immunoblotted with antibodies indicated on the right (G). Efficacy of furin silencing was verified by qPCR (H). Data are the mean ± SEM of three independent experiments. ***P < 0.001.
- I
Representative electron micrographs of Golgi stacks (arrows) of CTR and RAB2A MCF10.DCIS.com cells. Scale bars, 1 μm.
- J
CTR and RAB2A MCF10A cells were transfected with Str‐KDEL_SBP‐EGFP‐E‐cadherin (green). At the indicated time points after the addition of biotin, cells were fixed and stained without permeabilization with anti‐GFP antibody, followed by Alexa Fluor 568‐conjugated secondary antibody (red). The cell surface and total levels of SBP‐EGFP‐E‐cadherin at 60 min after the addition of biotin were quantified using ImageJ software on non‐saturated images, and surface/total ratio was expressed as a surface GFP index (relative to control cells). Scale bar, 20 μm. Data are the mean ± SEM (n = 10 cells of 3 independent experiments). ***P < 0.001.

- A–F
Doxycycline‐inducible murine RAB2A expression MCF10.DCIS.com cells were transfected with scrambled siRNA (siNC) or siRNA against VPS39 (siVPS39) (A–C) or GAPDH (siGAPDH) (D–F) in the absence (CTR) or presence (RAB2A) of doxycycline. Cells were immunostained with anti‐E‐cadherin (green) and anti‐TGN46 (red) antibodies (A, D). Merged images with DAPI (blue) are shown on the right. Total cell lysate was immunoblotted with antibodies indicated on the right (B, E). Pro‐region form of E‐cadherin is shown as an arrow. Efficacy of targeted gene silencing was verified by qPCR (C and F). Scale bars, 20 μm. Data are the mean ± SEM (n = 3 independent experiments). **P < 0.01, ***P < 0.001.

- A–D
Doxycycline‐inducible RAB2A expression MCF10A cells were cultured in the absence (CTR) or presence (RAB2A) of doxycycline and immunostained with anti‐RAB2A (red) and anti‐calnexin (A, green), anti‐ERGIC53 (B, green), anti‐GM130 (C, green), or anti‐TGN46 (D, green) antibodies. Merged images with DAPI (blue) are shown on the right. Scale bars, 10 μm.
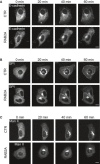
- A–C
Doxycycline‐inducible RAB2A expression MCF10A cells cultured in the absence (CTR) or presence (RAB2A) of doxycycline were transfected with Str‐KDEL_SBP‐EGFP‐E‐cadherin (A), Str‐KDEL_SBP‐EGFP‐GPI (B), or Str‐KDEL_ManII‐SBP‐EGFP (C). Biotin was added to the media to release the reporters from the hook Str‐KDEL at the ER synchronously. Still images are from Movies EV3, EV4, and EV5. Scale bars, 10 μm.
Similar articles
-
Harnessing membrane trafficking to promote cancer spreading and invasion: The case of RAB2A.Small GTPases. 2018 Jul 4;9(4):304-309. doi: 10.1080/21541248.2016.1223990. Epub 2017 Jan 27. Small GTPases. 2018. PMID: 28060560 Free PMC article. Review.
-
Protrudin-mediated ER-endosome contact sites promote MT1-MMP exocytosis and cell invasion.J Cell Biol. 2020 Aug 3;219(8):e202003063. doi: 10.1083/jcb.202003063. J Cell Biol. 2020. PMID: 32479595 Free PMC article.
-
CLIC3 controls recycling of late endosomal MT1-MMP and dictates invasion and metastasis in breast cancer.J Cell Sci. 2014 Sep 15;127(Pt 18):3893-901. doi: 10.1242/jcs.135947. Epub 2014 Jul 11. J Cell Sci. 2014. PMID: 25015290
-
MT1-MMP targeting to endolysosomes is mediated by upregulation of flotillins.J Cell Sci. 2018 Sep 5;131(17):jcs218925. doi: 10.1242/jcs.218925. J Cell Sci. 2018. PMID: 30111578
-
Matrix invasion by tumour cells: a focus on MT1-MMP trafficking to invadopodia.J Cell Sci. 2009 Sep 1;122(Pt 17):3015-24. doi: 10.1242/jcs.034561. J Cell Sci. 2009. PMID: 19692588 Review.
Cited by
-
Recent advances in conventional and unconventional vesicular secretion pathways in the tumor microenvironment.J Biomed Sci. 2022 Aug 5;29(1):56. doi: 10.1186/s12929-022-00837-8. J Biomed Sci. 2022. PMID: 35927755 Free PMC article. Review.
-
Nucleobindin-1 regulates ECM degradation by promoting intra-Golgi trafficking of MMPs.J Cell Biol. 2020 Aug 3;219(8):e201907058. doi: 10.1083/jcb.201907058. J Cell Biol. 2020. PMID: 32479594 Free PMC article.
-
LncRNA SOX2-OT regulates miR-192-5p/RAB2A axis and ERK pathway to promote glioblastoma cell growth.Cell Cycle. 2021 Oct;20(19):2010-2020. doi: 10.1080/15384101.2021.1965722. Epub 2021 Sep 1. Cell Cycle. 2021. PMID: 34470582 Free PMC article.
-
The role of vesicle trafficking genes in osteoblast differentiation and function.Sci Rep. 2023 Sep 26;13(1):16079. doi: 10.1038/s41598-023-43116-8. Sci Rep. 2023. PMID: 37752218 Free PMC article.
-
Golgi integral membrane protein 4 manipulates cellular proliferation, apoptosis, and cell cycle in human head and neck cancer.Biosci Rep. 2018 Aug 31;38(4):BSR20180454. doi: 10.1042/BSR20180454. Print 2018 Aug 31. Biosci Rep. 2018. PMID: 30068697 Free PMC article.
References
-
- Friedl P, Locker J, Sahai E, Segall JE (2012) Classifying collective cancer cell invasion. Nat Cell Biol 14: 777–783 - PubMed
-
- Hotary KB, Allen ED, Brooks PC, Datta NS, Long MW, Weiss SJ (2003) Membrane type I matrix metalloproteinase usurps tumor growth control imposed by the three‐dimensional extracellular matrix. Cell 114: 33–45 - PubMed
MeSH terms
Substances
Grants and funding
LinkOut - more resources
Full Text Sources
Other Literature Sources
Medical

