. 2016 Jun 3:6:27072.
doi: 10.1038/srep27072.

A 3D in vitro model to explore the inter-conversion between epithelial and mesenchymal states during EMT and its reversion

Affiliations

A 3D in vitro model to explore the inter-conversion between epithelial and mesenchymal states during EMT and its reversion

S J Bidarra et al. Sci Rep. .

Abstract

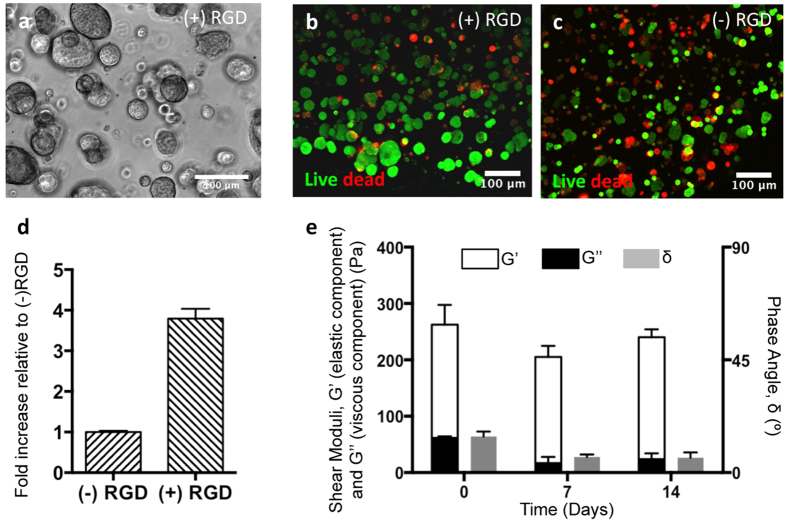
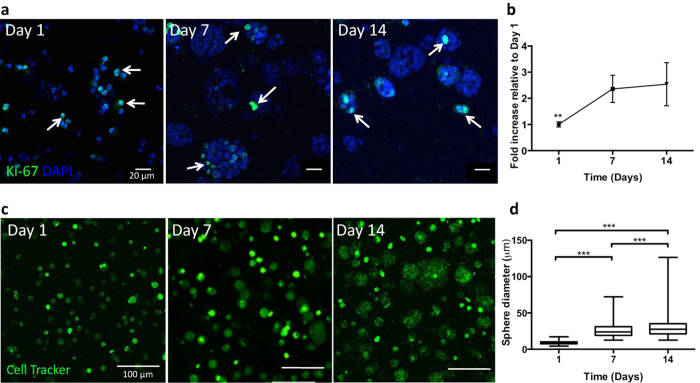
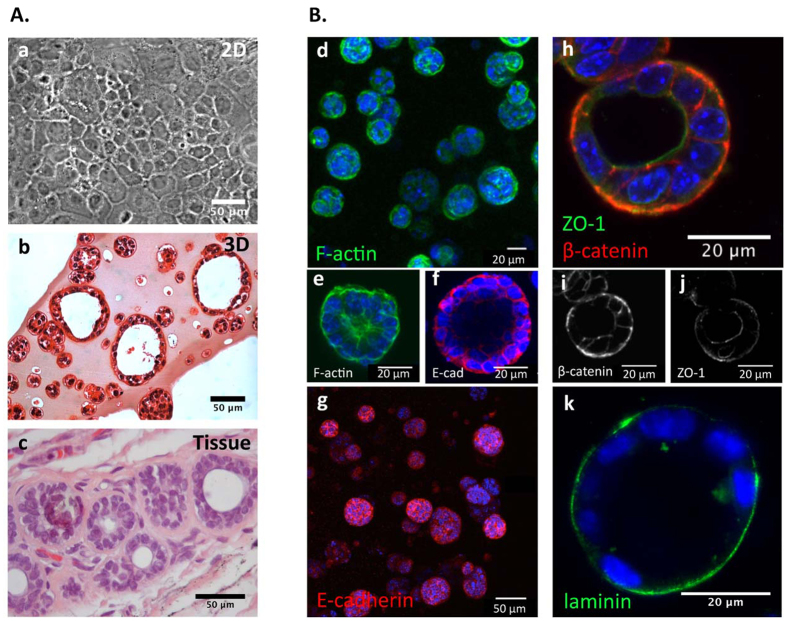
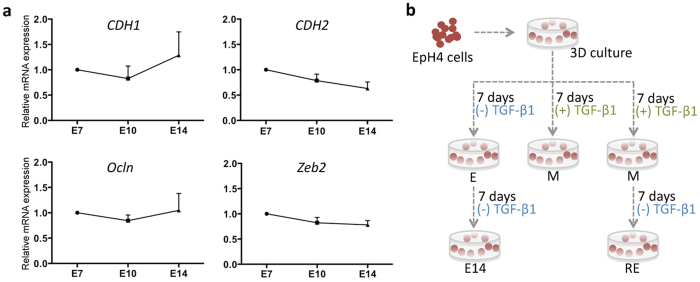
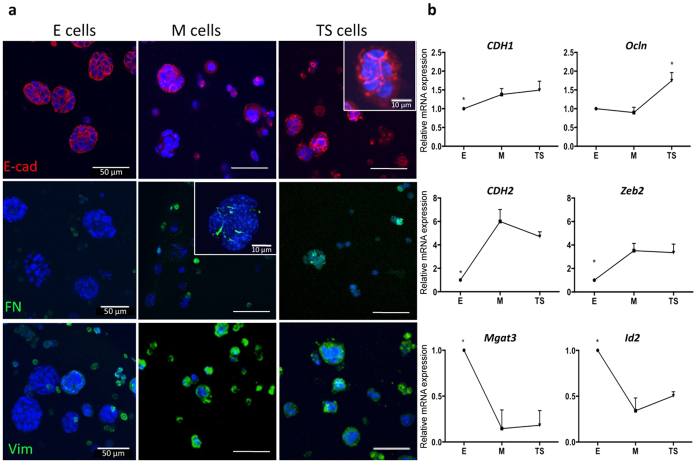
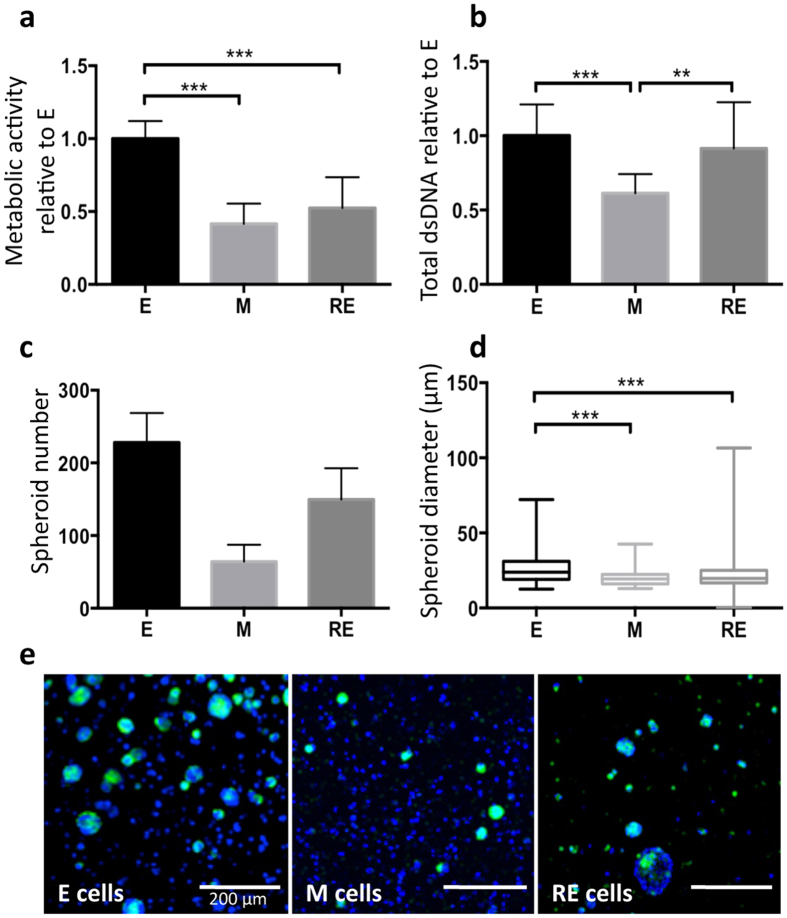
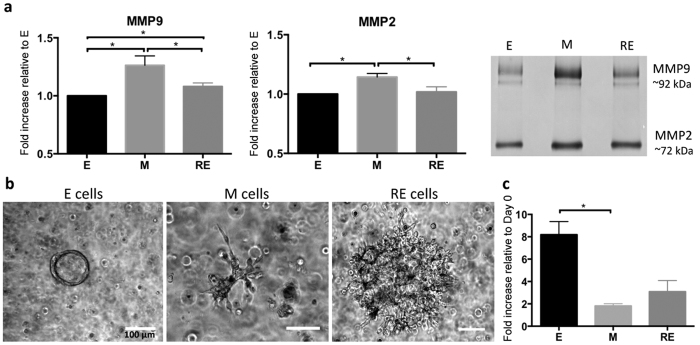
Epithelial-to-mesenchymal transitions (EMT) are strongly implicated in cancer dissemination. Intermediate states, arising from inter-conversion between epithelial (E) and mesenchymal (M) states, are characterized by phenotypic heterogeneity combining E and M features and increased plasticity. Hybrid EMT states are highly relevant in metastatic contexts, but have been largely neglected, partially due to the lack of physiologically-relevant 3D platforms to study them. Here we propose a new in vitro model, combining mammary E cells with a bioengineered 3D matrix, to explore phenotypic and functional properties of cells in transition between E and M states. Optimized alginate-based 3D matrices provided adequate 3D microenvironments, where normal epithelial morphogenesis was recapitulated, with formation of acini-like structures, similar to those found in native mammary tissue. TGFβ1-driven EMT in 3D could be successfully promoted, generating M-like cells. TGFβ1 removal resulted in phenotypic switching to an intermediate state (RE cells), a hybrid cell population expressing both E and M markers at gene/protein levels. RE cells exhibited increased proliferative/clonogenic activity, as compared to M cells, being able to form large colonies containing cells with front-back polarity, suggesting a more aggressive phenotype. Our 3D model provides a powerful tool to investigate the role of the microenvironment on metastable EMT stages.


Figures

Figure 1
Figure 1
(a) Bright field image of EpH4 cells culture in 3D alginate matrices with 200 μM of RGD (+) during 14 days. Viability of Eph4 within 3D alginate matrices (b) with RGD (+) and (c) without RGD (−) during 14 days. Live cells are stained by calcein AM (green) and dead cells by ethidium homodimer-1 (red). Scale bars: 100 μm. (d) Metabolic activity of EpH4 cultured in 3D alginate matrices with (+) and without (−) RGD peptides after 7 days in culture. Data normalized for metabolic activity values obtained for cells in 3D alginate matrices without RGD. (e) Viscoelastic properties (elastic, G’ and viscous, G” components of the shear moduli, and phase angle, δ) of 1 wt.% RGD-alginate with EpH4 cells during 14 days of culture. Data are presented as mean ± standard deviation (n = 3).
Figure 2
Figure 2. Behavior of normal mammary EpH4 epithelial cells within an artificial 3D RGD-alginate matrix.
(a) Proliferating epithelial cells (Ki-67 positive cells, arrows) were detected within the matrix at all time points (scale bars: 20 μm). (b) The metabolic activity profile showed a significantly increase after 1 week of culture (n = 3) (c) Eph4 cells (labeled with CellTrackerTM green) formed spheroids that increased in size and number along 14 days of culture (scale bar: 100 μm). (d) After 14 days of culture, spheroids reached an average diameter of 20 μm (n = 1876 spheroids). Data is presented as mean ± standard deviation. Statistical significance, **p < 0.01, ***p < 0.001.
Figure 3
Figure 3
(A) Bridging the gap between 2D and tissue. (a) Phase contrast microscopy image of EpH4 cells growing in polystyrene forming a 2D monolayer. Hematoxylin and eosin stained formalin-fixed and paraffin-embedded sections of (b) EpH4-laden 3D alginate matrices after 14 days in culture; and (c) normal breast tissue. Alginate-based 3D in vitro model recapitulates the structural architecture (acinar-like structures) of normal breast tissue, supporting epithelial morphogenesis. (B) CLSM images of 3D-cultured epithelial cells at day 14 (d and g) composed of 22 Z-stacks projected onto a single plane (representing a total thickness of 105 μm) show spheroids formation and images of 1 Z-stack from the central part of the spheroid revealed lumenization (e,f,h,I,j). (d,e) Eph4 stained for F-actin (green) and nuclei (blue). (f,g) Expression of the classical epithelial marker E-cadherin (red) and nuclei (blue). (h) 3D culture EpH4 show sphere lumenization and polarization, staining for basolateral marker β-catenin (red, (i)) and for apical marker ZO-1 (green, (j)). (k) Immunostaining for laminin (green) show that entrapped cells were able to secrete laminin. Scale bars (a,b,c,g) 50 μm and (d,e,f,h,i,j,k) 20 μm.
Figure 4
Figure 4
(a) qRT-PCR quantification of relative mRNA expression of CDH1 and Ocln (E markers), CDH2 (M marker) and Zeb2 (EMT inducer). Expression of the different markers was not significantly altered during the 14 days of culture. Data normalized for E cells and presented as mean ± standard deviation (n = 4 biological replicas). (b) Schematic representation of TGFβ1-driven EMT and its reversion in a 3D in vitro model. EpH4 were immobilized within 1 wt.% alginate matrix biofunctionalized with 200 μM RGD. To study epithelial morphogenesis, cells were kept in standard culture medium during 14 days (E cells). For EMT induction, medium was supplemented with TGFβ1 during 7 days (M cells). To revert the attained phenotype, TGFβ1 was removed and cells were maintained in culture for another week (RE cells).
Figure 5
Figure 5. Expression of E and M markers during 3D EMT and its reversion, at mRNA and protein levels.
(a) At protein level, E cells display the classical E-cadherin expression at cell membrane; M cells show decreased E-cadherin expression and delocalization into the cytoplasm; and RE cells display recovery of E-cadherin expression at the cell membrane. E cells did not express fibronectin (green), while M cells not only expressed intracellular fibronectin but also assembled pericellular fibronectin within small cellular aggregates (inset). RE cells showed decreased fibronectin expression, as compared to M cells, but higher expression that E cells. The higher levels of vimentin expression (green) were detected in M cells, with RE cells presenting intermediate expression levels as compared with E and M cells. Cell nuclei, blue. Scale bars: 50 μm (inset images: 10 μm). (b) At mRNA level, CDH1 (E marker) expression was increased in M and RE cells, as compared with E cells; Ocln (E marker) slightly decreased in M cells and was recovered in RE cells; CDH2 (M marker) was significantly increased in M cells and then slightly decreased in RE cells; Zeb2 (EMT inducer) was significantly increased in M cells as compared with E cells, supporting EMT occurrence; Mgat3, an epithelial-associated marker, was significantly decreased in M cells and slightly increased in RE cells (in comparison with M cells); and Id2 (negative regulator of TGFβ-induced EMT), was significantly decreased in M cells and then increased in RE cells. Data was normalized for E cells and presented as mean ± standard deviation (n = 4 biological replicas, from 4 independent experiments). Statistical significance, *p < 0.05.
Figure 6
Figure 6. Morphological and functional features of E, M and RE cells in 3D.
(a) The metabolic activity and (b) total dsDNA profiles showed a significantly decrease in M cells, followed by a significantly increase in RE cells. Results were normalized for E cells (n = 3 biological replicates from 3 independent experiments). (c) Quantification of spheroid number and (d) spheroid diameter (3 replicas per condition and a total of 1316 spheroids). (e) Representative CLSM images of Eph4 spheroids during EMT and its reversion. Cell nuclei: blue, F-actin: green. Scale bars: 200 μm. All data were presented as mean ± standard deviation. Statistical significance, *p < 0.05, **p < 0.01, ***p < 0.001.
Figure 7
Figure 7. E, M and RE cells express different levels of MMPs activity and display different invasive behavior.
(a) Activity of MMP2 and MMP9 secreted by 3D-cultured E, M and RE cells analyzed by gelatin zymography. Both MMPs were significantly increased in M cells; RE cells showed a significantly decrease in both MMPs in comparison with M cells, albeit MMP9 secretion was significantly higher in RE than in E cells. Data was normalized to E cells and presented as mean ± standard deviation (n = 3 biological replicates from 3 independent experiments). Statistical significance, *p ≤ 0.05. (b) Bright-field images of E, M and RE cells cultured for 7 days in MatrigelTM after recovery from RGD-alginate 3D matrices. E cells formed organized spheroids with lumen, while M and RE cells formed star-like structures (associated with an invasive phenotype), which were larger in RE cells. Scale bars: 100 μm. (c) Fold increase (in relation to day 0) in E, M and RE cells metabolic activity after 1 week of culture in MatrigelTM: E cells showed the highest increase in metabolic activity, followed by RE cells and then M cells. Data normalized for cells at day 0 and presented as mean ± standard deviation (n = 3 replicas).

Similar articles

Cited by

References

    1. Tomaskovic-Crook E., Thompson E. W. & Thiery J. P. Epithelial to mesenchymal transition and breast cancer. Breast Cancer Res 11, 213 (2009). - PMC - PubMed
    1. Yang J. & Weinberg R. A. Epithelial-Mesenchymal Transition: At the Crossroads of Development and Tumor Metastasis. Dev Cell 14, 818–829 (2008). - PubMed
    1. Thiery J. P. Epithelial-mesenchymal transitions in tumour progression. Nat Rev Cancer 2, 442–454 (2002). - PubMed
    1. Kalluri R. & Weinberg R. A. The basics of epithelial-mesenchymal transition. J Clinical Invest 119, 1420–1428 (2009). - PMC - PubMed
    1. Brabletz T. EMT and MET in Metastasis: Where Are the Cancer Stem Cells? Cancer Cell 22, 699–701 (2012). - PubMed

Publication types

MeSH terms