. 2016 Sep;28(34):7340-64.
doi: 10.1002/adma.201601498. Epub 2016 Jun 3.

Hierarchical Targeting Strategy for Enhanced Tumor Tissue Accumulation/Retention and Cellular Internalization

Affiliations

Hierarchical Targeting Strategy for Enhanced Tumor Tissue Accumulation/Retention and Cellular Internalization

Sheng Wang et al. Adv Mater. 2016 Sep.

Abstract

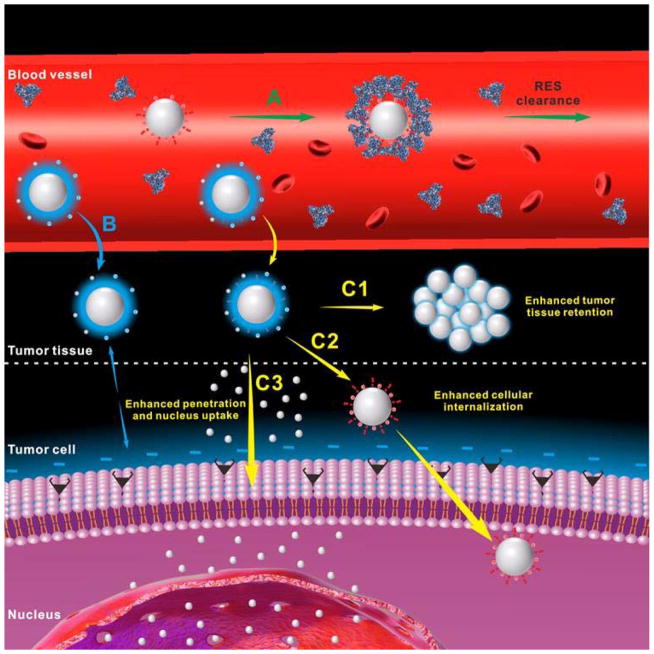
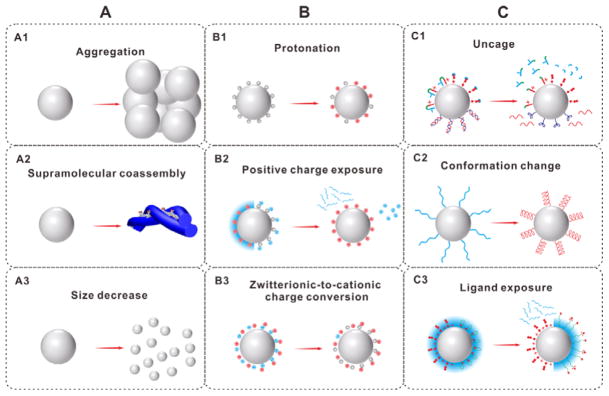
Targeted delivery of therapeutic agents is an important way to improve the therapeutic index and reduce side effects. To design nanoparticles for targeted delivery, both enhanced tumor tissue accumulation/retention and enhanced cellular internalization should be considered simultaneously. So far, there have been very few nanoparticles with immutable structures that can achieve this goal efficiently. Hierarchical targeting, a novel targeting strategy based on stimuli responsiveness, shows good potential to enhance both tumor tissue accumulation/retention and cellular internalization. Here, the recent design and development of hierarchical targeting nanoplatforms, based on changeable particle sizes, switchable surface charges and activatable surface ligands, will be introduced. In general, the targeting moieties in these nanoplatforms are not activated during blood circulation for efficient tumor tissue accumulation, but re-activated by certain internal or external stimuli in the tumor microenvironment for enhanced cellular internalization.

Keywords: activatable surface ligands; changeable particle sizes; hierarchical targeting; stimuli-responsive nanoplatforms; switchable surface charges.


Figures

Figure 1
Figure 1
Schematic illustration of the drug delivery procedure of positively charged or ligand modified nanoparticles (A), neutral or negatively charged nanoparticles modified with hydrophilic ‘stealth’ polymers (B) and hierarchical targeting nanoparticles (C) which can achieve enhanced tumor tissue retention (C1), enhanced cellular internalization (C2), enhanced tumor penetration and nucleus uptake (C3).
Figure 2
Figure 2
Hierarchical targeting nanoplatforms based on changeable particle size (A), switchable surface charge (B) and activatable surface ligand (C).
Figure 3
Figure 3
(A) Schematic of the pH-responsive AuNP-C10-CN4-X:Y. (B) Schematic and TEM images of the AuNPs at different pH. (C) Accumulation of the AuNPs in KB tumor-bearing mice at different time postinjection. (D) Normalized tumor accumulation of the AuNPs. Reproduced with permission.[21] Copyright 2013 American Chemical Society.
Figure 4
Figure 4
(A) TEM image of the micelles (scale bar: 1 μm). (B) Schematic of in situ supramolecular coassembly. (C) TEM image of the nanofibers (scale bar: 100 nm). (D) Fluorescence images of the ICG (1) and nanofibers (5) on HeLa tumor-bearing mice at different time postinjection. (E) 3D PA images of the 1 and 5 on HeLa tumor-bearing mice at 24 h postinjection. (F) Tumor growth curves and survival curves of different groups. Reproduced with permission.[13] Copyright 2015 American Chemical Society.
Figure 5
Figure 5
(A) Schematic illustration showing the tumor stimuli-triggered structural change of iCluster/Pt. (B) TEM images iCluster/Pt with pH 6.8 solution treatment for 0, 4 and 24 h. (C) Confocal images of RhBiClusterFlu and RhBClusterFlu in BxPC-3 xenograft tumor at 4 h postinjection (scale bar: 50 μm). PAMAM: Flu (green); the core of the nanoparticles: RhB (red); blood vessels: platelet endothelial cell adhesion molecule 1 (PECAM-1) and CFL-647 secondary antibody (yellow). Reproduced with permission.[26] Copyright 2016 National Academy of Sciences.
Figure 6
Figure 6
(A) Schematic of the size-photocontrollable NP/NR nanoassembly for enhanced nucleus uptake. (B) TEM image of the NP/NR nanoassembly. (C) Confocal images of CEM cells incubated with the TMR-NP/Cy5-NR nanoassembly without (1) or with (2) laser irradiation. (D) Viability of K562/D cells after different treatments. Reproduced with permission.[28] Copyright 2015 American Chemical Society.
Figure 7
Figure 7
(A) Schematic of cellular delivery of the samples at different pH. (B) Zeta potential changes of the samples at different pH. (C) T2-weighted imaging of T6–17 cells after incubation with the samples at different pH. Reproduced with permission.[30] Copyright 2011 American Chemical Society.
Figure 8
Figure 8
(A) Schematic of pHe-triggered surface charge switch of ICG/DOX-loaded NHTPNs. (B) Flow cytometric (FCM) analysis TRAMP-C1 cells incubated with ICG/DOX-loaded TPNs and NHTPNs at pH 7.4 or 6.3 for 2 h. (C) Fluorescence images of TRAMP-C1 cells incubated with ICG/DOX-loaded TPN and NHTPNs at pH 7.4 or 6.3 for 1.5 h. Cell cytoskeleton: F-actin marker (green); nuclei: Hoechst (blue). (D) Cell viability of TRAMP-C1 cells incubated with ICG-loaded NHTPNs and ICG/DOX-loaded NHTPNs at pH 7.4 or 6.3. Reproduced with permission.[33] Copyright 2016 Ivyspring International Publisher.
Figure 9
Figure 9
(A) Schematic of pH-triggered cellular internalization of PPC-Hyd-DOX-DA. (B) 1H NMR spectra of polymer incubated at pH 6.8 for different time. (C) Zeta potential changes of PPC-Hyd-DOX-DA at different pH values. (D) Confocal images of MDA-MB-231 cells incubated with DOX-loaded nanoparticle at different pH values for 1 h. Cell cytoskeleton: Alexa 488 (green); nuclei: DAPI (blue). Reproduced with permission.[36] Copyright 2011 American Chemical Society.
Figure 10
Figure 10
(A) Schematic of the shedding process of PPC coating. At the pHe, the positively charged PPC would be shedded because of electrostatic repulsion and the PEI/siRNA would be re-exposed. (B) Zeta-potential changes of S-NP and unS-NP at different pH. (C) Confocal images of MDA-MB-231 cells incubated with S-NP and unS-NP at different pH. Nanoparticles carrying FAM-siRNA (green); cell cytoskeleton: Alexa Fluor 568 phalloidin (red); nuclei: DAPI (blue). (D, E) FCM analysis of MDA-MB-231 cells incubated with S-NP (D) and unS-NP (E) at pH 7.4 or 6.8. Reproduced with permission.[39] Copyright 2011 American Chemical Society.
Figure 11
Figure 11
(A) Chemical structure of the monolayer-protected AuNPs and schematic of pH-responsive delivery. (B) Zeta potential of 1 and 2 at different pH values. (C) Viability of HeLa cells after incubation with 1 and 2 for 72 h. Reproduced with permission.[42] Copyright 2015 Wiley.
Figure 12
Figure 12
(A) Schematic of the preparation pH- controlled photothermal therapeutic efficiency of mixed-charge GNSs. (B) Zeta potentials of GNS-N/C 3-7, GNS-NH2 and GNS-COOH at different pH values. (C) Cellular uptake of GNSs after incubation with samples at different pH values for 4 h. (D) Viability of HeLa cells after incubation with different concentration of samples for 4 h at pH 7.4 (left) or 6.4 (right) and subsequent 808 nm laser irradiation (2 W cm−2, 3 min). Reproduced with permission.[45] Copyright 2015 Wiley.
Figure 13
Figure 13
(A) Schematic of a phototargeted NP. Upon UV light irradiation, the caged YIGSR will be activated, and the NP can bind to the cells. (B) FTIR spectra of caged NPs with or without UV light illumination. (C) Absorbance spectra of free DMNB. (D, E) Fluorescent images of cells incubated with caged NPs with (D) or without (E) UV light illumination. Reproduced with permission.[48] Copyright 2010 American Chemical Society.
Figure 14
Figure 14
(A) Schematic of NIR light-induced cellular internalization of caged UCNP@SiO2. Upon NIR light irradiation, the caging molecules would be removed, leading to the activation of folate. (B) Confocal images of HeLa cells incubated with different samples: (a) cells alone, (b) uncaged DOX-loaded NPs, (c) caged DOX-loaded NPs, and (d) caged DOX-loaded NPs with an irradiation of NIR light. Cell cytoskeleton: Alexa 488 (green); nuclei: DAPI (blue). Reproduced with permission.[51b] Copyright 2013 American Chemical Society.
Figure 15
Figure 15
(A) Schematic of the light-activable targeted nanorod conjugated with ssDNA caged aptamers. (B) Dark-field images of CCRF-CEM cells incubated with different samples: GNRs, GNRs-Apt, and GNRs-Apt/DNA with (+L) and without NIR light irradiation. Reproduced with permission.[54] Copyright 2015 Tsinghua University Press and Springer-Verlag Berlin Heidelberg.
Figure 16
Figure 16
(A) Schematic of HAuNS-pHLIP-Ce6 for pH induced translocation. (B) Fluorescent images of cells incubated with HAuNS-pHLIP-Ce6 at different pH for 4 h. Reproduced with permission.[61] Copyright 2015 American Chemical Society.
Figure 17
Figure 17
(A) Schematic of the shedding of PEG coating as well as the exposure of folate at acidic microenvironment. (B) Fluorescence images and FCM analysis of HeLa cells incubated with FITC-labeled FPPLVs. Nuclei: DAPI (blue). Reproduced with permission.[63] Copyright 2014 Royal Society of Chemistry.
Figure 18
Figure 18
(A) Schematic of the polymeric vector and its tumor pHe-reponsive change. (B) PEG release from the Dm-NP incubated at pH 7.4 and 6.5. (C) Zeta potential changes of NP and Dm-NP incubated at pH 7.4 and 6.5. (D) FCM analysis of A549 cells incubated with FAM-siRNA-loaded NP and Dm-NP at pH 7.4 and 6.5 for 2 h. (E) The relative mRNA expression of mutant A549 cells treated with different samples at pH 7.4 and 6.5. Reproduced with permission.[68] Copyright 2015 American Chemical Society.
Figure 19
Figure 19
(A) Schematic of the DNA-controlled morphology change of assemblies. (B) TEM images of the assemblies with different morphologies. (C) Schematic of the DNA-controlled cellular internalization of the assemblies. (D) Cellular uptake efficiencies of the assemblies without or with FA modification in different morphologies. Reproduced with permission.[72] Copyright 2016 American Association for the Advancement of Science.
Figure 20
Figure 20
(A) Schematic of the pH-triggered unbunding of biotin. (B) Confocal images of MCF-7 cells incubated with FITC-labeled DOX-loaded micelles at different pH. Reproduced with permission.[73] Copyright 2005 American Chemical Society.
Figure 21
Figure 21
(A) Schematic of the UV light-activated, tumor-targeting drug delivery. (B) Confocal images of HeLa cells treated with P123, 10p and 20p with (UV+) or without (UV−) UV light irradiation. (C) FCM analysis of 10p (left) and 20p (right) with (gray filled) or without (black line) UV light irradiation. (D) Comparison of UV light-activated cell uptake of different samples (*p < 0.05). Reproduced with permission.[76] Copyright 2014 Wiley.

References

    1. Peer D, Karp JM, Hong S, Farokhzad OC, Margalit R, Langer R. Nat Nanotechnol. 2007;2:751. - PubMed
    1. Cheng Z, Al Zaki A, Hui JZ, Muzykantov VR, Tsourkas A. Science. 2012;338:903. - PMC - PubMed
    1. Petros RA, DeSimone JM. Nat Rev Drug Discovery. 2010;9:615. - PubMed
    1. Matsumura Y, Maeda H. Cancer Res. 1986;46:6387. - PubMed
    1. Sherlock SP, Tabakman SM, Xie L, Dai H. ACS Nano. 2011;5:1505. - PMC - PubMed
    2. Chen Q, Liang C, Wang C, Liu Z. Adv Mater. 2015;27:903. - PubMed
    3. Wang W, Cheng D, Gong F, Miao X, Shuai X. Adv Mater. 2012;24:115. - PubMed