

Trade and investment liberalization, food systems change and highly processed food consumption: a natural experiment contrasting the soft-drink markets of Peru and Bolivia
- PMID: 27255275
- PMCID: PMC4890476
- DOI: 10.1186/s12992-016-0161-0
Trade and investment liberalization, food systems change and highly processed food consumption: a natural experiment contrasting the soft-drink markets of Peru and Bolivia
Abstract
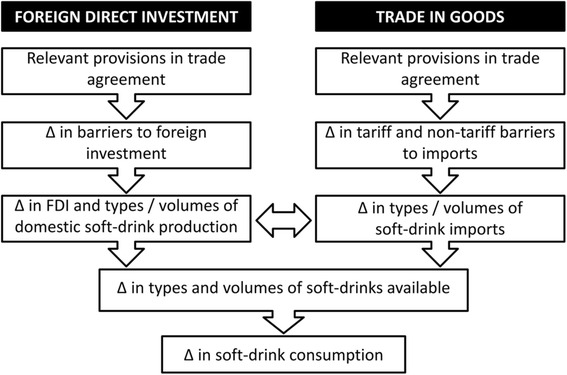
Background: Free trade agreements (FTAs) can affect food environments and non-communicable disease risks through altering the availability of highly-processed foods. Few studies have quantified such effects. Using a natural experiment this paper quantifies changes in Peru's soft-drink market before/after entry into the US-Peru FTA, compared with Bolivia, a county with no such agreement.
Methods: Difference-in-difference models were used to test for between country differences in the rate of per capita foreign direct investment (FDI) inflows, soft-drink imports, the volumes of various soft-drinks sold, and the volumes of sugar from soft-drinks before/after FTA ratification (2006) and enforcement (2009).
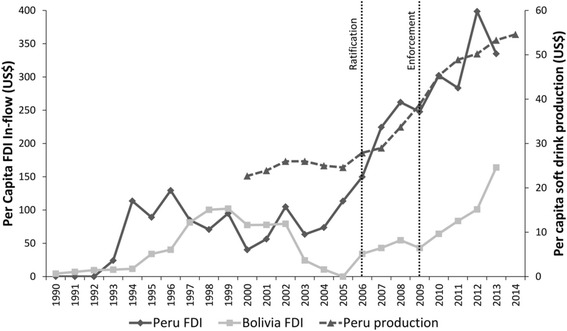
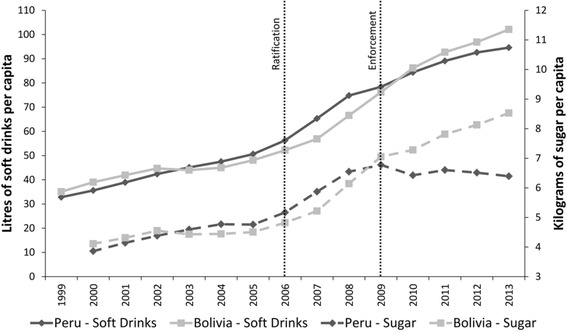
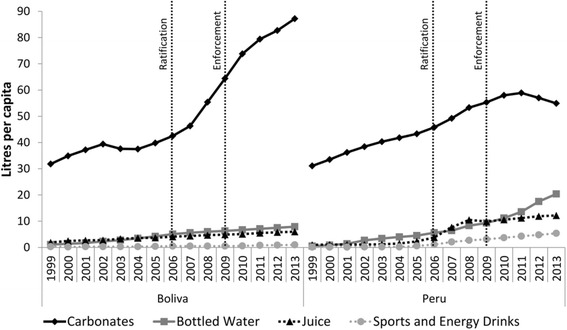
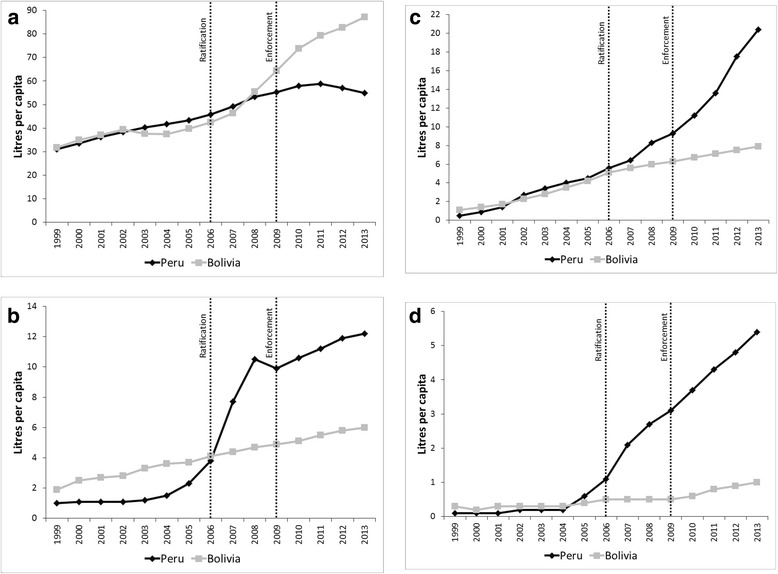
Results: In Peru average per capita FDI-inflows rose from US$103.11 in the pre-ratification period to US$269.79 post-ratification, with little change in Bolivia. This corresponded with a 122 % increase in Peruvian soft-drink production. There was a significant between-country difference in FDI-inflows pre-/post-ratification (DID:1.07, 95 % CI:0.19-1.96; p = 0.01). Despite little difference in total per capita soft-drink sales volumes there was a significant between-country difference in per capita sugar from soft-drinks pre-/post enforcement (DID:-0.99, 95 % CI: -1.91-0.06; p = 0.03) with stagnated growth in Peru and continued growth in Bolivia. This resulted from stagnated sugar sweetened carbonates growth and increased bottled water, juice and sports & energy drinks growth in Peru, with continued carbonates growth in Bolivia. There was a significant between-country difference in per capita carbonates (DID: -1.44, 95 % CI: -2.52-0.36, p = 0.01) and bottled water (DID:0.63; 95 % CI: -0.01-1.26; p = 0.04) sales volumes.
Conclusions: The FTA may have resulted in increased FDI-inflows and soft-drink production and also contributed to the diversification of soft drinks produced and sold in Peru with some positive (stagnated carbonates and increased bottled water) and some negative (increased juice and sports & energy drinks) implications for nutrition. These changes were not evident in Bolivia. These results should be interpreted cautiously given the study design limitations.
Keywords: Latin America; Natural experiment; Non-communicable diseases; Soft-drinks; Trade and investment.
Figures
References
-
- Swinburn B, et al. Diet, nutrition and the prevention of excess weight gain and obesity. Public Health Nutr. 2007;7(1a):123–146. - PubMed
-
- World Health Organization . Diet, nutrition and the prevention of chronic diseases. report of a joint WHO/FAO expert consultation. Geneva: World Health Organization; 2003.
-
- Hawkes C. Globalization, food and nutrition transitions. Geneva: Commission on Social Determinants of Health, World Health Organization; 2007.
MeSH terms
Substances
LinkOut - more resources
Full Text Sources
Other Literature Sources
