. 2017 Mar;27(3):907-917.
doi: 10.1007/s00330-016-4412-5. Epub 2016 Jun 2.

Prediction of infarction development after endovascular stroke therapy with dual-energy computed tomography

Affiliations

Prediction of infarction development after endovascular stroke therapy with dual-energy computed tomography

Tanja Djurdjevic et al. Eur Radiol. 2017 Mar.

Abstract

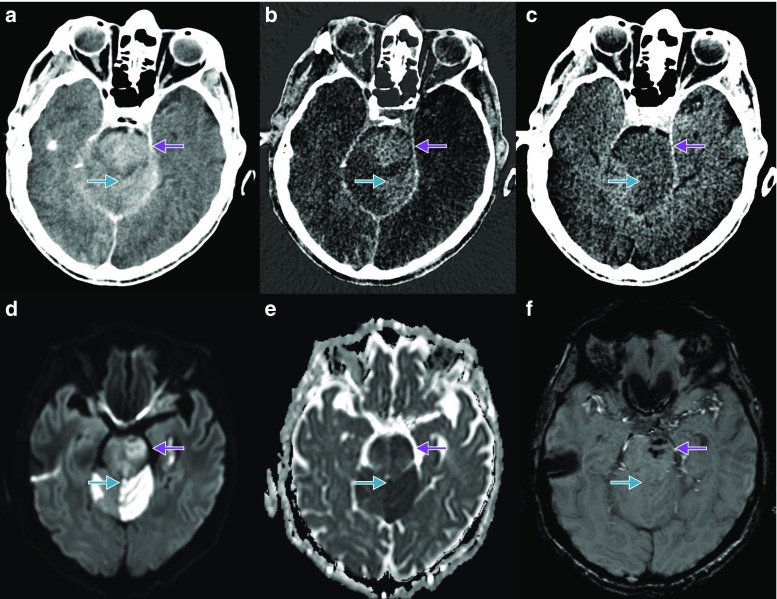
Objectives: After intraarterial recanalisation (IAR), the haemorrhage and the blood-brain barrier (BBB) disruption can be distinguished using dual-energy computed tomography (DECT). The aim of the present study was to investigate whether future infarction development can be predicted from DECT.

Methods: DECT scans of 20 patients showing 45 BBB disrupted areas after IAR were assessed and compared with follow-up examinations. Receiver operator characteristic (ROC) analyses using densities from the iodine map (IM) and virtual non-contrast (VNC) were performed.

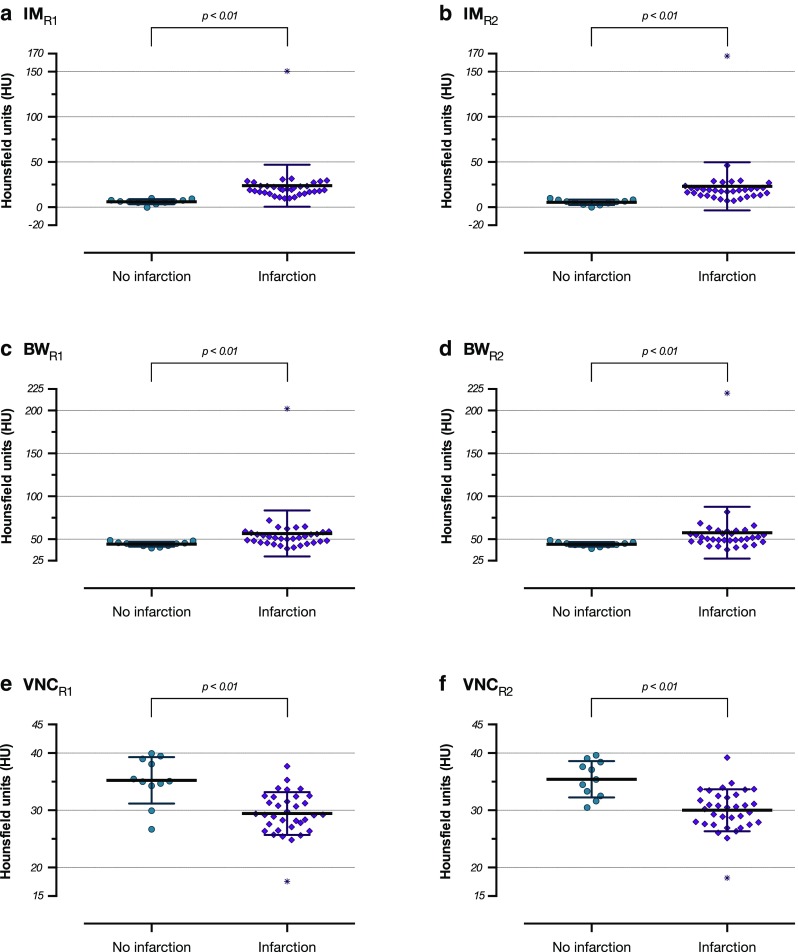
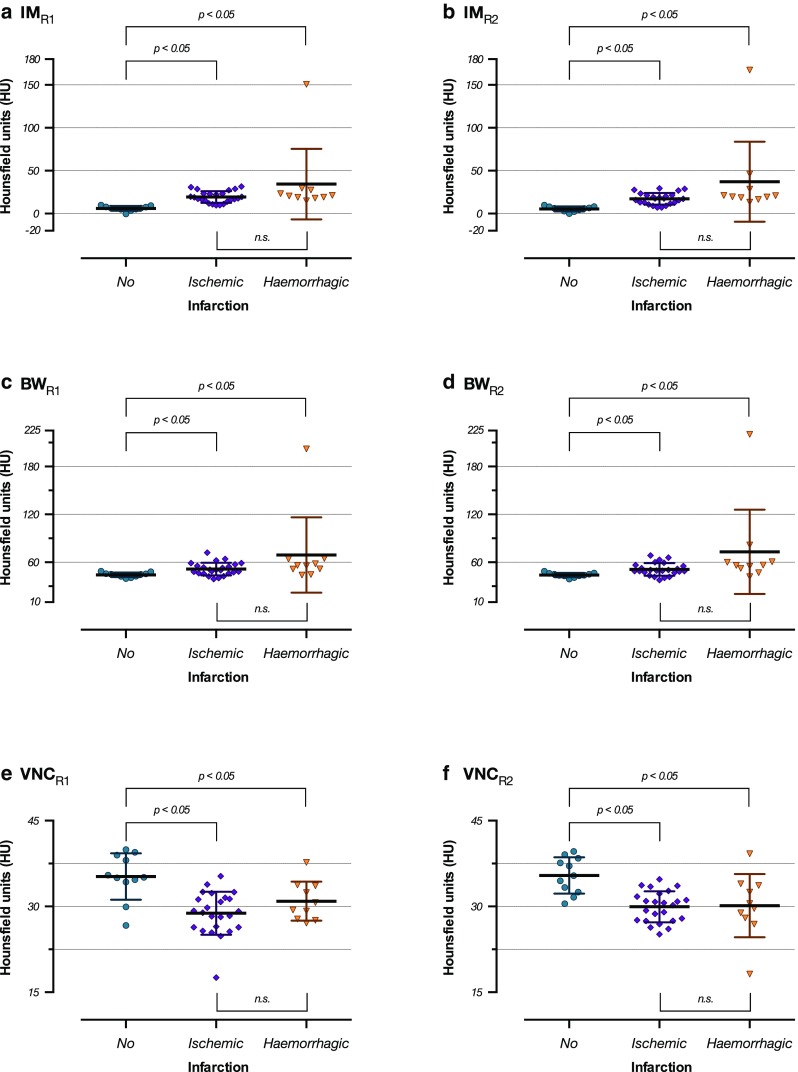
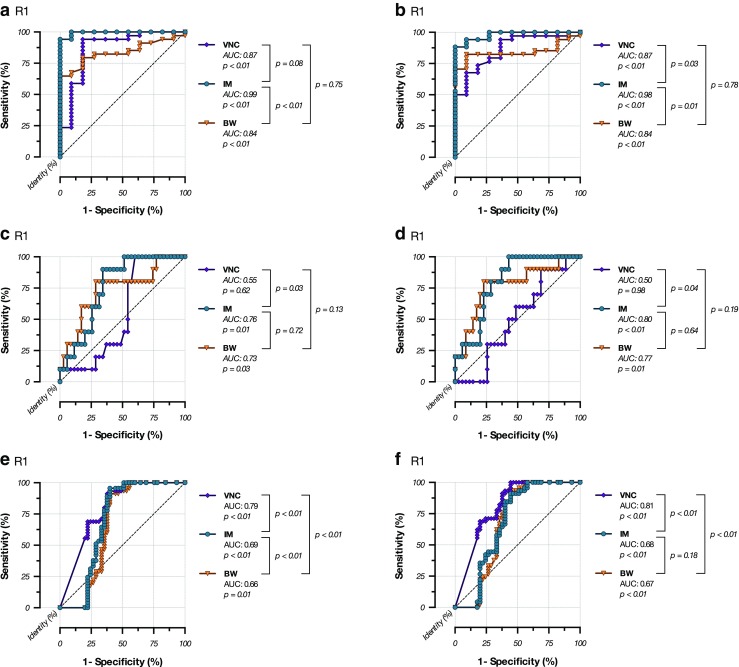
Results: Future infarction areas are denser than future non-infarction areas on IM series (23.44 ± 24.86 vs. 5.77 ± 2.77; p < 0.0001) and more hypodense on VNC series (29.71 ± 3.33 vs. 35.33 ± 3.50; p < 0.0001). ROC analyses for the IM series showed an area under the curve (AUC) of 0.99 (cut-off: <9.97 HU; p < 0.05; sensitivity 91.18 %; specificity 100.00 %; accuracy 0.93) for the prediction of future infarctions. The AUC for the prediction of haemorrhagic infarctions was 0.78 (cut-off >17.13 HU; p < 0.05; sensitivity 90.00 %; specificity 62.86 %; accuracy 0.69). The VNC series allowed prediction of infarction volume.

Conclusions: Future infarction development after IAR can be reliably predicted with the IM series. The prediction of haemorrhages and of infarction size is less reliable.

Key points: • The IM series (DECT) can predict future infarction development after IAR. • Later haemorrhages can be predicted using the IM and the BW series. • The volume of definable hypodense areas in VNC correlates with infarction volume.

Keywords: Blood-brain barrier disruption; Cerebral infarction; Dual-energy computed tomography; Endovascular stroke therapy; Intracranial haemorrhage.


Figures

Fig. 1
Fig. 1
af Example of a patient with a left cerebellar haemispheric infarction (blue arrow) and a left pontine infarction (violet arrow), which became haemorrhagic 2 days after the IAR. The infarctions are hyperdense on BW series (Figure 1a), hyperdense on IM series (Figure 1b), hypodense on VNC series (Figure 1c), hyperintense on diffusion weighted imaging (DWI B1000, Figure 1d), hypointense on the apparent diffusion coefficient map (ADC map, Figure 1e), hypointense on susceptibility weighted imaging (pontine, haemorrhage), or isointense (cerebellar, no haemorrhage; Figure 1f) in the follow-up imaging
Fig. 2
Fig. 2
af Scattergrams of the density means ± standard deviations in the groups “no infarction” and “infarction” on the iodine map series for reader 1 (Figure 2a) and reader 2 (Figure 2b), brain window series for reader 1 (Figure 2c) and reader 2 (Figure 2d), and virtual non-contrast series for reader 1 (Figure 2e) and reader 2 (Figure 2f). There are significant differences between the groups (Mann-Whitney tests)
Fig. 3
Fig. 3
af Scattergrams of the density means ± standard deviations in the groups “no infarction”, “ischemic infarction”, and “haemorrhagic” infarction on the iodine map series for reader 1 (Figure 3a) and reader 2 (Figure 3b), brain window series for reader 1 (Figure 3c) and reader 2 (Figure 3d), and the virtual non-contrast series for reader 1 (Figure 3e) and reader 2 (Figure 3f). There are significant differences between the groups “no infarction” and “ischemic infarction” and “no infarction” and “haemorrhagic infarction”, but not between “ischemic infarction” and “haemorrhagic infarction” (Kruskal-Wallis tests with Dunn’s post hoc tests)
Fig. 4
Fig. 4
af Receiver operating characteristic analyses. Figure 4a and b; rater 1 and 2: Infarction prediction using densities from IM, VNC, and BW series. The cut-off value for the prediction of an infarction is 10.4 HU (reader 1) and 10.3 HU (reader 2). Figure 4c and d; reader 1 and 2: Haemorrhage prediction using densities from IM, VNC, and BW series. Figure 4e and f; reader 1 and 2: Infarction volume prediction using lesion volumes from IM, VNC, and BW series

References

    1. Chiro GD, Brooks RA, Kessler RM, et al. Tissue signatures with dual-energy computed tomography. Radiology. 1979;131:521–523. doi: 10.1148/131.2.521. - DOI - PubMed
    1. Millner MR, McDavid WD, Waggener RG, Dennis MJ, Payne WH, Sank VJ. Extraction of information from CT scans at different energies. Med Phys. 1979;6:70–71. doi: 10.1118/1.594555. - DOI - PubMed
    1. Genant HK, Boyd D. Quantitative bone mineral analysis using dual energy computed tomography. Invest Radiol. 1977;12:545–551. doi: 10.1097/00004424-197711000-00015. - DOI - PubMed
    1. Postma AA, Das M, Stadler AA, Wildberger JE. Dual-Energy CT: what the Neuroradiologist Should Know. Curr Radiol Rep. 2015;3:16. doi: 10.1007/s40134-015-0097-9. - DOI - PMC - PubMed
    1. Gupta R, Phan CM, Leidecker C, et al. Evaluation of dual-energy CT for differentiating intracerebral hemorrhage from iodinated contrast material staining. Radiology. 2010;257:205–211. doi: 10.1148/radiol.10091806. - DOI - PubMed

LinkOut - more resources