. 2016 Aug;44(3):2015-27.
doi: 10.1111/ejn.13288. Epub 2016 Jun 22.

Mechanisms, pools, and sites of spontaneous vesicle release at synapses of rod and cone photoreceptors

Affiliations

Mechanisms, pools, and sites of spontaneous vesicle release at synapses of rod and cone photoreceptors

Karlene M Cork et al. Eur J Neurosci. 2016 Aug.

Abstract

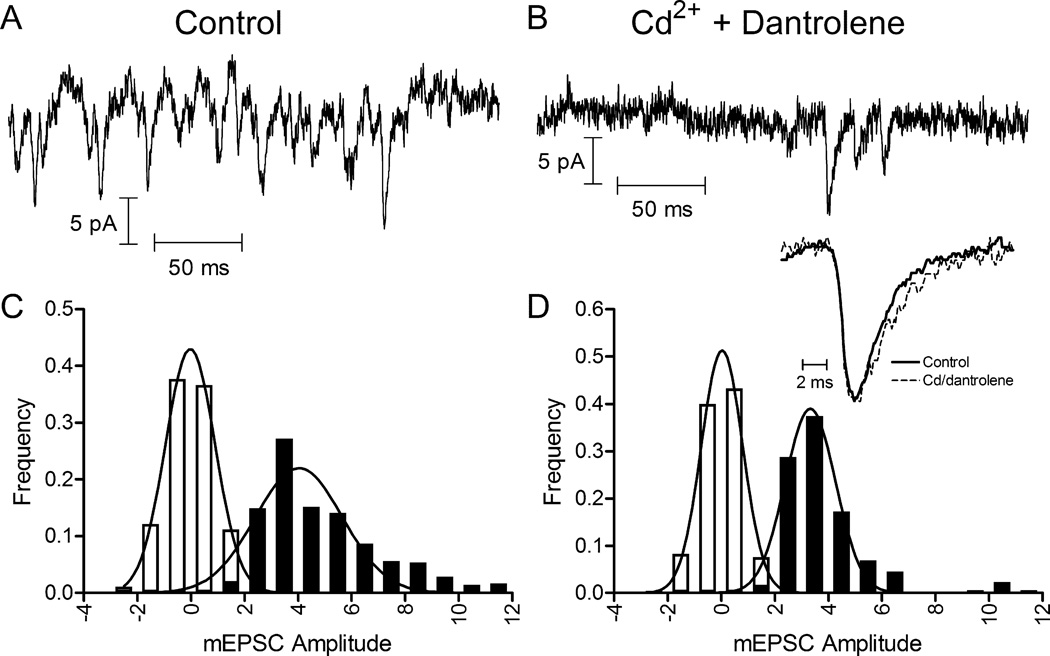
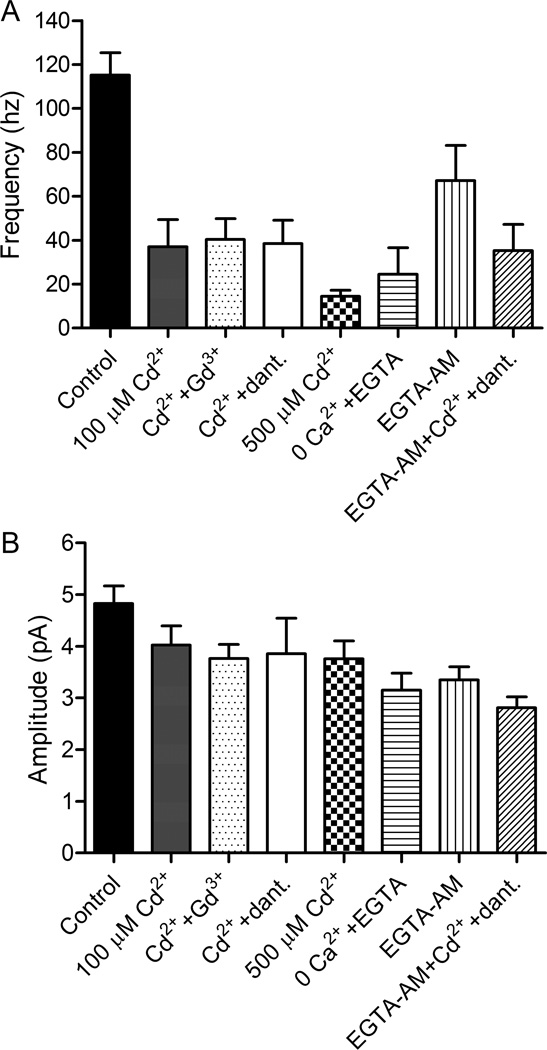
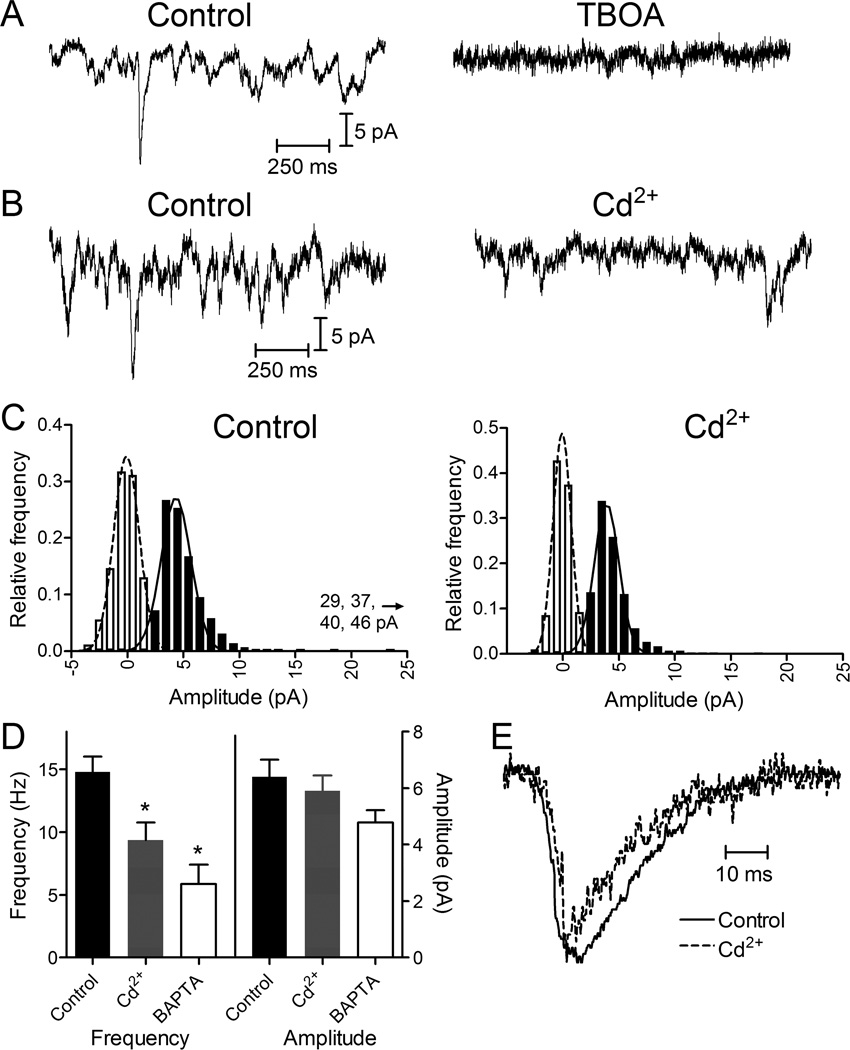
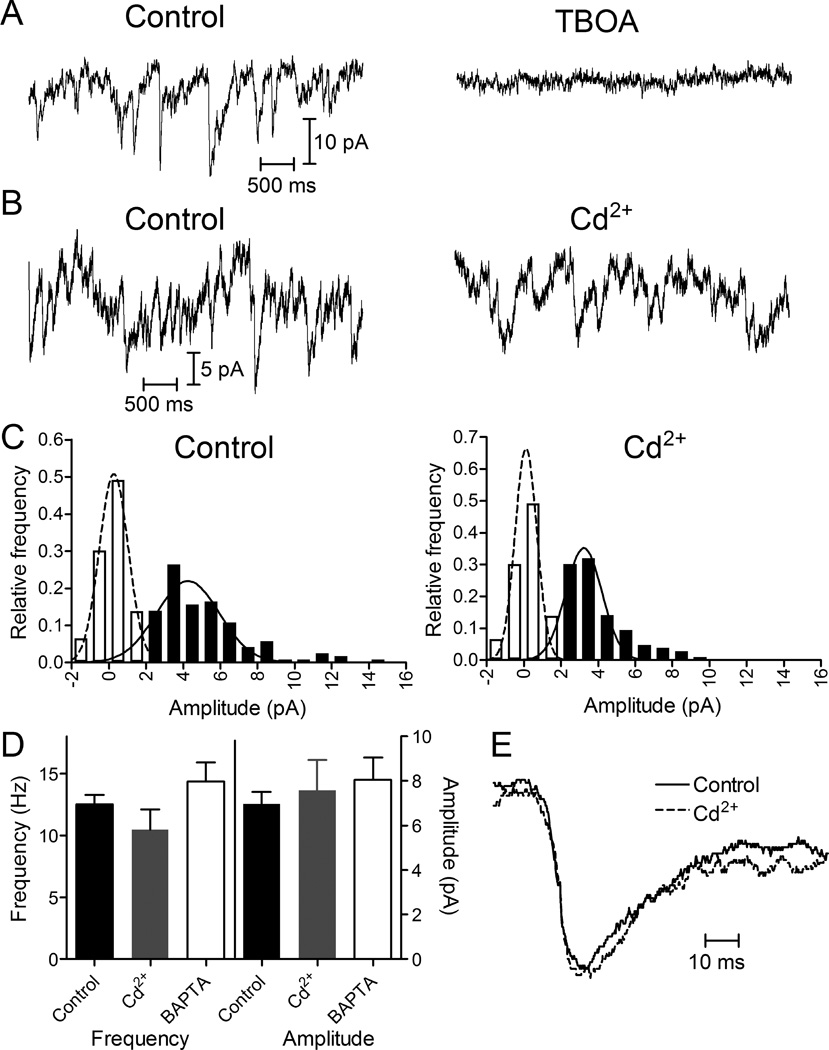
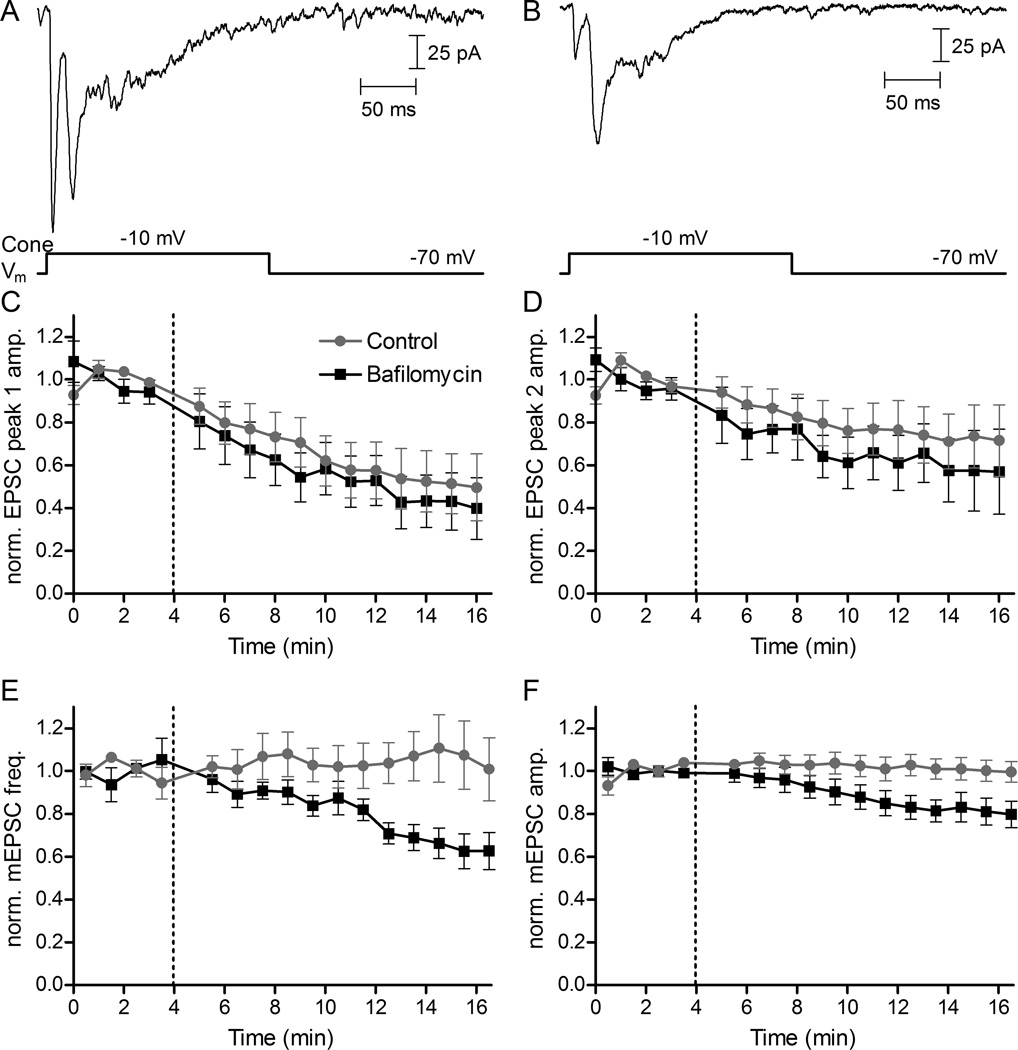
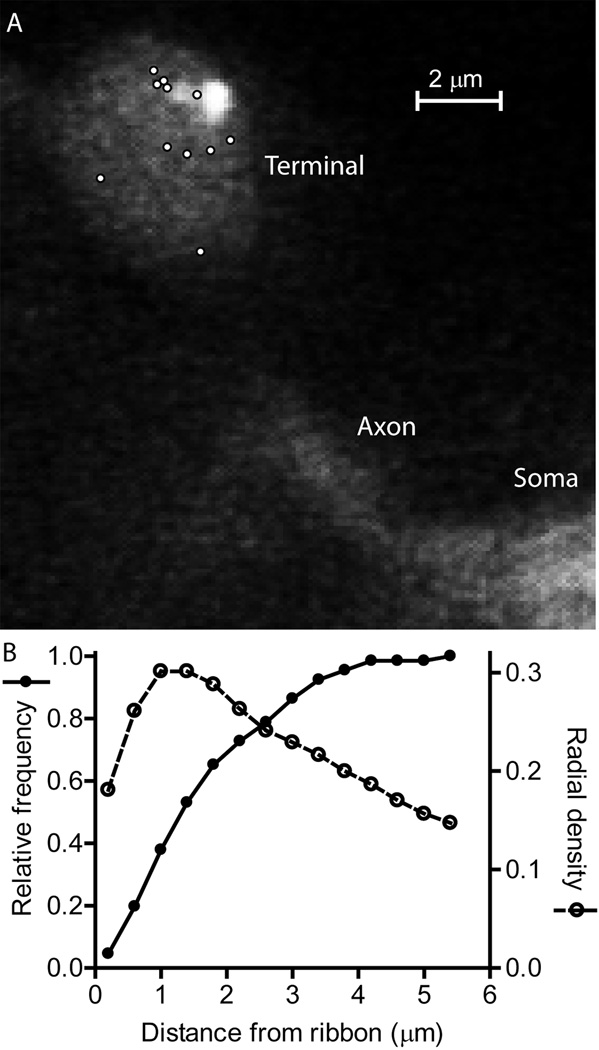
Photoreceptors have depolarized resting potentials that stimulate calcium-dependent release continuously from a large vesicle pool but neurons can also release vesicles without stimulation. We characterized the Ca(2+) dependence, vesicle pools, and release sites involved in spontaneous release at photoreceptor ribbon synapses. In whole-cell recordings from light-adapted horizontal cells (HCs) of tiger salamander retina, we detected miniature excitatory post-synaptic currents (mEPSCs) when no stimulation was applied to promote exocytosis. Blocking Ca(2+) influx by lowering extracellular Ca(2+) , by application of Cd(2+) and other agents reduced the frequency of mEPSCs but did not eliminate them, indicating that mEPSCs can occur independently of Ca(2+) . We also measured release presynaptically from rods and cones by examining quantal glutamate transporter anion currents. Presynaptic quantal event frequency was reduced by Cd(2+) or by increased intracellular Ca(2+) buffering in rods, but not in cones, that were voltage clamped at -70 mV. By inhibiting the vesicle cycle with bafilomycin, we found the frequency of mEPSCs declined more rapidly than the amplitude of evoked excitatory post-synaptic currents (EPSCs) suggesting a possible separation between vesicle pools in evoked and spontaneous exocytosis. We mapped sites of Ca(2+) -independent release using total internal reflectance fluorescence (TIRF) microscopy to visualize fusion of individual vesicles loaded with dextran-conjugated pHrodo. Spontaneous release in rods occurred more frequently at non-ribbon sites than evoked release events. The function of Ca(2+) -independent spontaneous release at continuously active photoreceptor synapses remains unclear, but the low frequency of spontaneous quanta limits their impact on noise.

Keywords: calcium; exocytosis; retina; ribbon synapse; spontaneous synaptic release; tiger salamander.


Figures

Figure 1
Figure 1
mEPSCs persisted after blocking Ca2+ channels with Cd2+ (100 μM) and CICR with dantrolene (10 μM). mEPSCs were measured by whole-cell patch clamp recording in horizontal cells (HCs). Representative traces show mEPSCs in control conditions (A) and following application of Cd2+ plus dantrolene in the same cell (B). (C) and (D) show mEPSC amplitude histograms from the same cell. The filled bars show event histograms and open bars show baseline noise histograms. Distributions were fit with Gaussian curves. Control data (C ; 482 events) were fit with a mean amplitude of 4.03 pA and standard deviation of 1.63 pA. Cd2+ plus dantrolene data (D ; 174 events) were fit with a mean amplitude of 3.33 pA and standard deviation of 0.94 pA. Inset shows average waveforms for well-isolated mEPSCs in control (N = 50 events) and Cd2+ plus dantrolene (N = 26) conditions. Waveforms were normalized to their peak amplitudes.
Figure 2
Figure 2
HC mEPSCs were reduced in frequency but not abolished when Ca2+ influx was inhibited. mEPSCs were recorded in HCs voltage clamped at −60 mV. (A) HC mEPSCs in control conditions had a frequency of 115.2 ± 10.1 (N = 28 HCs). Application of Cd2+ (100 μM) reduced the frequency of mEPSCs to 37.0 ± 12.4 Hz (N = 8 HCs). Cd2+ (100 μM) plus Gd3+ (30 μM) reduced the frequency to 40.5 ± 9.4 Hz (N = 7 HCs). Cd2+ (100 μM) plus dantrolene (10 μM) reduced the frequency to 38.5 ± 10.7 Hz (N = 11 HCs). A higher concentration of Cd2+ (500 µM) caused a somewhat greater reduction (14.5 ± 2.7 Hz, N=8; median = 15.8 Hz; P = 0.078 compared to Cd2+ plus dantrolene, unpaired t-test). In Ca2+-free extracellular solution with EGTA (1 mM), mEPSCs had a frequency of 24.5 ± 6.28 Hz (N = 5 HCs). After incubating retinas in EGTA-AM (100 μM) for 2 hours, the frequency of mEPSCs was reduced to 67.2 ± 16.0 Hz, N = 10 HCs). Addition of Cd2+ plus dantrolene to slices incubated in EGTA-AM reduced mEPSC frequency to 35.3 ± 12.0 Hz (N = 9 HCs). Frequencies in all of these conditions were significantly lower than control conditions (P<0.05 for EGTA-AM, P < 0.001 for all other comparisons, Bonferroni’s multiple comparison test). With the exception of 0 Ca2+ plus EGTA (P = 0.113), frequencies of all conditions were significantly non-zero (P < 0.005, one-sided t-tests). (B) In control conditions, mEPSCs had an amplitude of 4.8 ± 0.34 pA (N = 28 HCs). Event amplitudes averaged: 100 µM Cd2+ (4.0 ± 0.37 pA, N=8), 100 µM Cd2+ plus 30 µM Gd3+ (3.8 ± 0.27 pA, N=7), 100 µM Cd2+ plus dantrolene (3.9 ± 0.68 pA, N=11), 500 µM Cd2+ (3.8 ± 0.35 pA, N=8), 0 Ca2+ plus 1 mM EGTA (3.2 ± 0.33 pA, N=5), EGTA-AM (3.4 ± 0.26 pA, N=9), and EGTA-AM plus 100 µM Cd2+ and dantrolene (2.8 ± 0.21 pA, N=9). The amplitude of spontaneous release events measured in the presence of these various blockers were not significantly smaller than control (P > 0.05, Bonferroni’s multiple comparison test) with the exception of EGTA-AM plus 100 µM Cd2+ (P < 0.01).
Figure 3
Figure 3
Presynaptic release events detected in rods by glutamate transporter anion currents. (A) Presynaptic quantal transporter currents in rods voltage clamped at −70 mV were blocked by inhibiting the glutamate transporter with TBOA (100 μM). (B) Representative trace from an individual rod before and after application of Cd2+ (100 μM) showing a reduction in the frequency of presynaptic events. (C) Amplitude histograms of release events from the same rod in control and Cd2+. The filled bars show event histograms and open bars show baseline noise histograms. Distributions were fit with Gaussian curves. Control data (291 events) were fit with a mean amplitude of 5.54 pA and standard deviation of 4.57 pA. Cd2+ data (301 events) were fit with a mean amplitude of 4.54 pA and standard deviation of 2.64 pA. The ordinate was plotted to 25 pA, but four events with larger amplitudes of 29, 37, 40 and 46 pA were also observed in control conditions. (D) Bar graph illustrating frequency and amplitudes of rod presynaptic events in control (14.8 ± 1.2 Hz, 6.42 ± 0.48 pA, N = 23), Cd2+ (100 µM; 9.35 ± 1.4 Hz, 5.90 ± 0.55 pA, N = 13), and after introduction of 10 mM BAPTA into the rod through a patch pipette (5.86 ± 1.5 Hz, 4.78 ± 0.43 pA, N = 9). Reduction in frequency with Cd2+ (paired t-test, N=12 pairs, P = 0.0011) and BAPTA (unpaired t-test, P = 0.0003) were both significant relative to control. (E) Average waveforms for well-isolated rod transporter currents in control (N = 42 events) and Cd2+ (N = 28) conditions. Waveforms were normalized to their peak amplitudes.
Figure 4
Figure 4
Presynaptic release events detected in cones by glutamate transporter anion currents. (A) Presynaptic quantal transporter currents in cones voltage clamped at −70 mV were blocked by inhibiting the glutamate transporter with TBOA (100 μM). (B) Cone transporter currents before and after application of Cd2+ (100 μM). (C) Amplitude histograms of release events from the same cone in control and Cd2+. Filled bars show event histograms and open bars show baseline noise histograms. Distributions were fit with Gaussian curves. Control data (121 events) were fit with a mean amplitude of 4.26 pA and standard deviation of 1.69 pA. Cd2+ data (106 events) were fit with a mean amplitude of 3.23 pA and standard deviation of 0.97 pA. (D) Bar graph illustrating frequency and amplitudes of rod presynaptic events in control (12.5 ± 0.77 Hz, 6.96 ± 0.55 pA, N = 6), Cd2+ (100 µM; 10.5 ± 1.6 Hz, 7.57 ± 1.38 pA, N = 6), and after introduction of 10 mM BAPTA into the cone through a patch pipette (14.4 ± 1.5 Hz, 8.03 ± 1.01 pA, N = 7). Changes in frequency and amplitude with Cd2+ or BAPTA were not significant relative to control (paired t-tests comparing Cd2+ and control; also Bonferroni’s multiple comparison test). (E) Average waveforms for well-isolated cone transporter currents in control (N = 53) and Cd2+ (N = 36) conditions. Waveforms were normalized to their peak amplitudes.
Figure 5
Figure 5
Using the vesicular ATPase inhibitor bafilomycin to block refilling of vesicles with glutamate caused different rates of decline in EPSCs and mEPSCs. (A) A representative EPSC in control conditions evoked in an HC by a 200-ms depolarizing step from −70 to −10 mV applied to a simultaneously voltage-clamped rod. The depolarizing step evoked an initial fast EPSC due to release from ribbons followed by a second slower peak due to non-ribbon release (Chen et al., 2014). (B) An EPSC evoked in the same rod/HC pair 15 min after application of bafilomycin (7 μM) showed a decrease in amplitude of both EPSC peaks. (C) EPSC amplitude and mEPSC frequency and amplitude were normalized to the average of four responses obtained prior to bafilomycin application at 4 minutes (dashed vertical lines). The 1st and 2nd EPSC peaks both declined in control conditions due to rundown. The declines in amplitude of the 1st (C) and 2nd (D) EPSC peaks were accelerated slightly but not significantly by bafilomycin (comparing the change in normalized EPSC amplitude of the first 3 vs. last 3 responses from rod/HC pairs in control N=9 vs. bafilomycin N=8: peak 1, P = 0.65; peak 2, P=0.44, unpaired t-tests). In contrast to changes in EPSC amplitude, HC mEPSC frequency (E) and amplitude (F) both declined significantly during application of bafilomycin (average of the first 3 vs. last 3 records in control vs. bafilomycin, frequency: P < 0.04; amplitude: P < 0.04; N = 7 HCs in bafilomycin, N = 8 HCs in control, unpaired t-tests). HC mEPSCs were collected in 10 s trials in which the rod was voltage clamped at −70 mV. EPSC and mEPSC trials alternated every 30 s.
Figure 6
Figure 6
Locations of individual spontaneous release events and synaptic ribbons visualized by TIRF microscopy. (A) A representative rod terminal with sites of individual spontaneous release events indicated by white circles. The elliptical footprint of the synaptic terminal membrane as well as some of the axon and soma emitted a faint fluorescent glow (525 nm emission) when excited with the 488 nm laser. One can also see two neighboring ribbons labeled with fluorescent Hylite488-conjugated ribeye-binding peptide (80 μM) in the upper right portion of the terminal. To detect release events, synaptic vesicles were loaded with 10 kD dextran-conjugated pHrodo loaded and visualized with 561 nm excitation/609 nm emission. Ca2+-independent spontaneous release events were measured in isolated rods voltage clamped at −70 mV in the presence of Cd2+ (100 μM) plus dantrolene (10 μM). (B) The relative frequency of Ca2+-independent spontaneous release events at different distances from the synaptic ribbon. The distance between individual release events and the center of the nearest ribbon averaged 1.80 ± 0.14 μm (N = 66 events in 9 rods). We calculated the radial density distribution of events, d(r), using the following formula d(r) = N(r)/π[(r + n/2)2 – (r - n/2)2] where r is the radial distance to the center of each bin in the histogram from the center of the nearest ribbon, n is the width of each bin (400 nm), and N(r) is the number of events in each bin. A sizable percentage of release events (>60%), occurred more than 1 μm away from the nearest synaptic ribbon, but the highest density of events occurred 1–1.4 µm from the nearest ribbon.

References

    1. Arancillo M, Min SW, Gerber S, Münster-Wandowski A, Wu YJ, Herman M, Trimbuch T, Rah JC, Ahnert-Hilger G, Riedel D, Südhof TC, Rosenmund C. Titration of Syntaxin1 in mammalian synapses reveals multiple roles in vesicle docking, priming, and release probability. The Journal of Neuroscience. 2013;33(42):16698–16714. - PMC - PubMed
    1. Atasoy D, Ertunc M, Moulder KL, Blackwell J, Chung C, Su J, Kavalali ET. Spontaneous and evoked glutamate release activates two populations of NMDA receptors with limited overlap. The Journal of Neuroscience. 2008;28(40):10151–10166. - PMC - PubMed
    1. Babai N, Morgans CW, Thoreson WB. Calcium-induced calcium release contributes to synaptic release from mouse rod photoreceptors. Neuroscience. 2010;165(4):1447–1456. - PMC - PubMed
    1. Bartoletti TM, Babai N, Thoreson WB. Vesicle pool size at the salamander cone ribbon synapse. Journal of Neurophysiology. 2010;103(1):419–423. - PMC - PubMed
    1. Bartoletti TM, Jackman SL, Babai N, Mercer AJ, Kramer RH, Thoreson WB. Release from the cone ribbon synapse under bright light conditions can be controlled by the opening of only a few Ca(2+) channels. Journal of Neurophysiology. 2011;106(6):2922–2935. - PMC - PubMed

Publication types