. 2016 Jul 29;291(31):16328-38.
doi: 10.1074/jbc.M115.709626. Epub 2016 Jun 2.

Short Term Palmitate Supply Impairs Intestinal Insulin Signaling via Ceramide Production

Affiliations

Short Term Palmitate Supply Impairs Intestinal Insulin Signaling via Ceramide Production

Thi Thu Trang Tran et al. J Biol Chem. .

Abstract

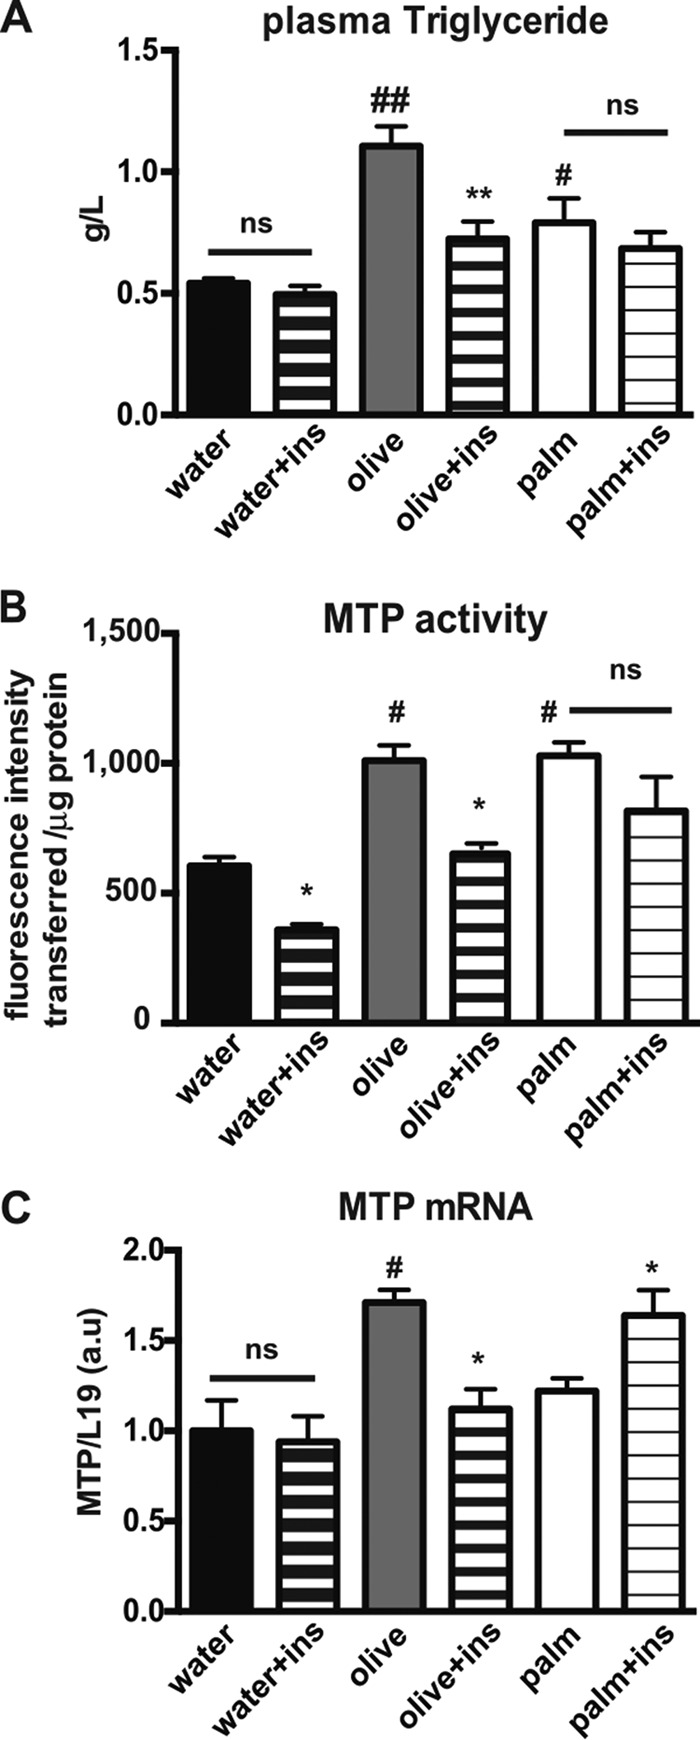
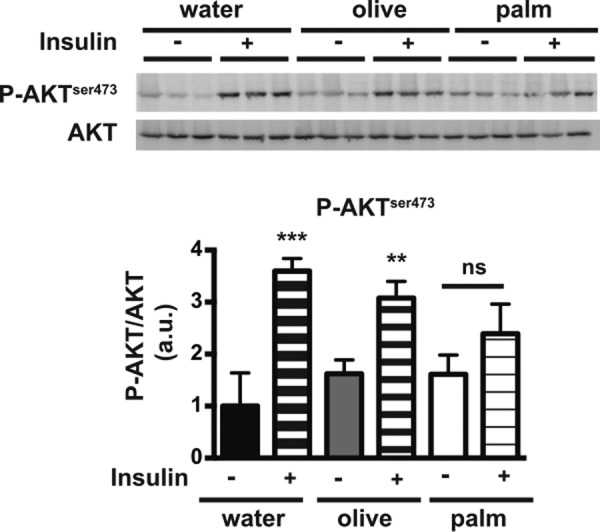
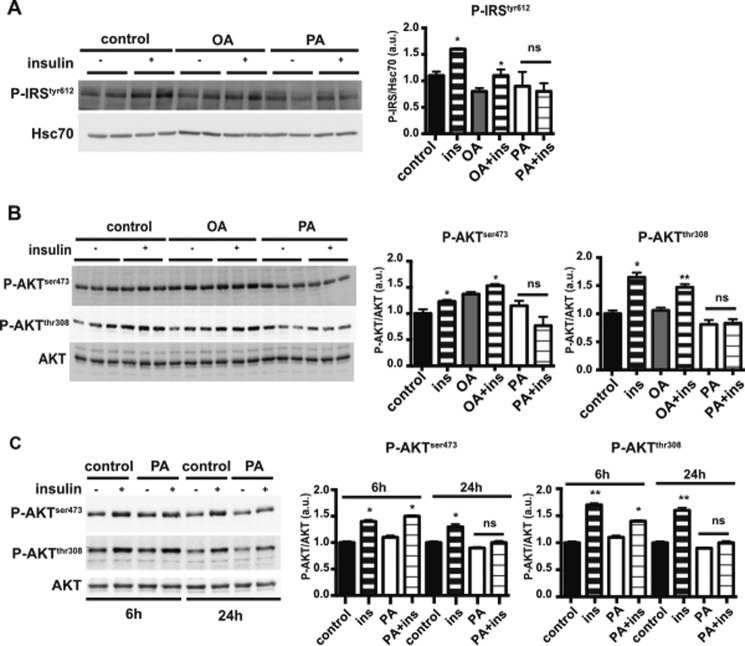
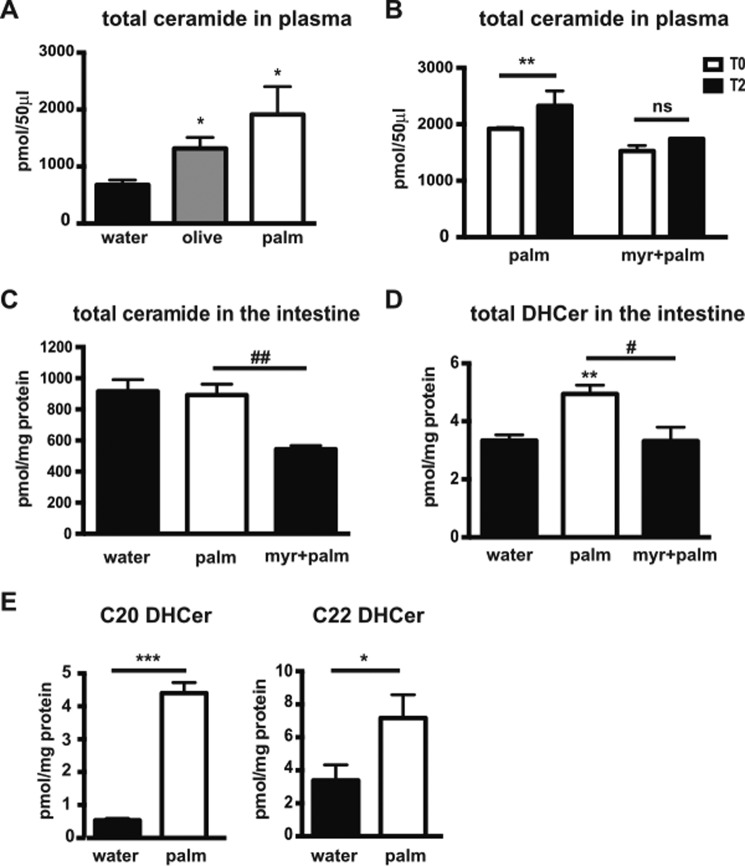
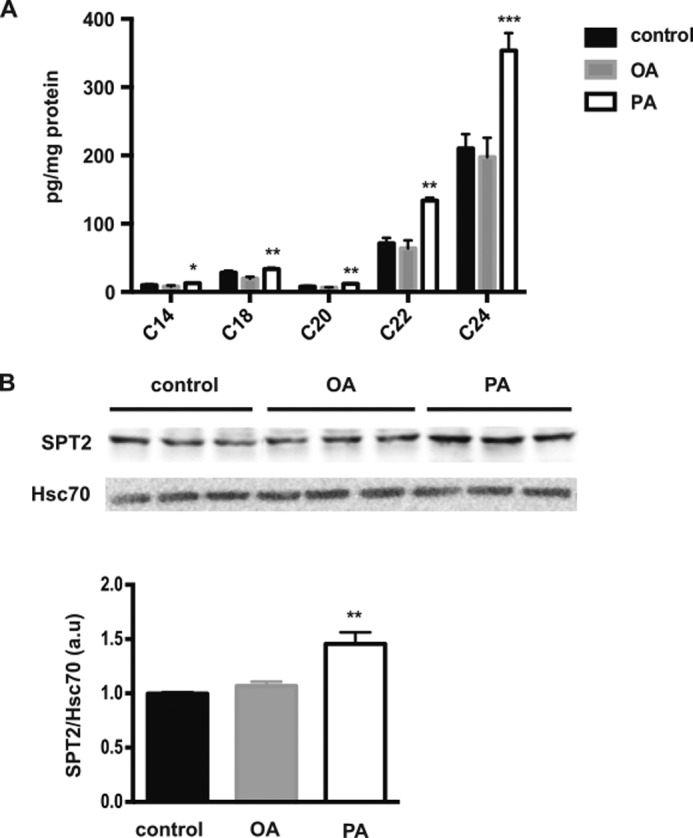
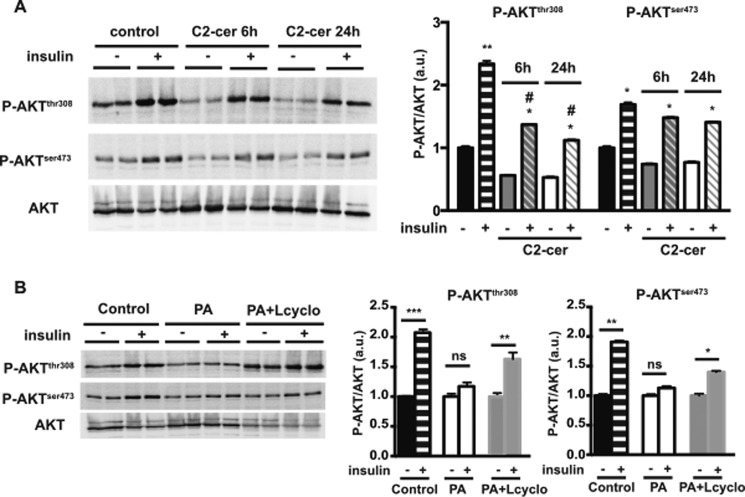
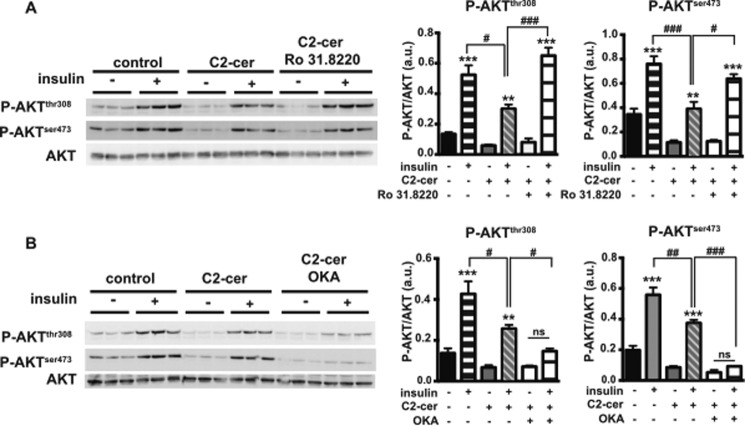
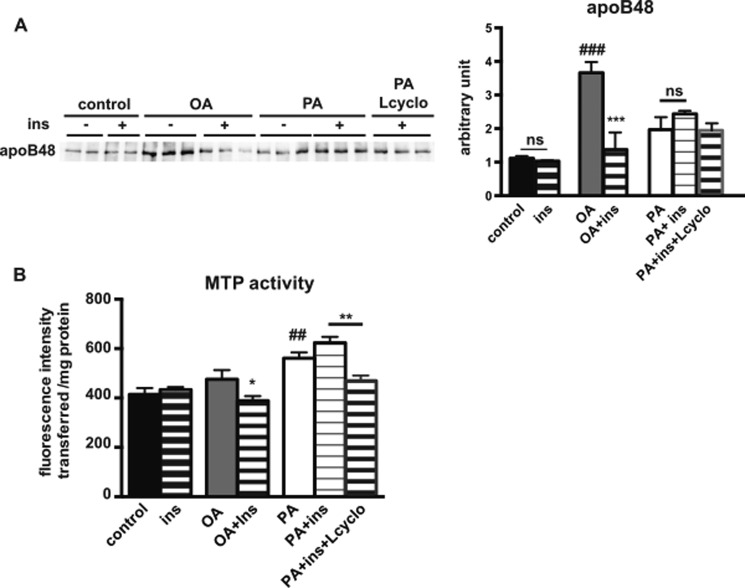
The worldwide prevalence of metabolic diseases is increasing, and there are global recommendations to limit consumption of certain nutrients, especially saturated lipids. Insulin resistance, a common trait occurring in obesity and type 2 diabetes, is associated with intestinal lipoprotein overproduction. However, the mechanisms by which the intestine develops insulin resistance in response to lipid overload remain unknown. Here, we show that insulin inhibits triglyceride secretion and intestinal microsomal triglyceride transfer protein expression in vivo in healthy mice force-fed monounsaturated fatty acid-rich olive oil but not in mice force-fed saturated fatty acid-rich palm oil. Moreover, when mouse intestine and human Caco-2/TC7 enterocytes were treated with the saturated fatty acid, palmitic acid, the insulin-signaling pathway was impaired. We show that palmitic acid or palm oil increases ceramide production in intestinal cells and that treatment with a ceramide analogue partially reproduces the effects of palmitic acid on insulin signaling. In Caco-2/TC7 enterocytes, ceramide effects on insulin-dependent AKT phosphorylation are mediated by protein kinase C but not by protein phosphatase 2A. Finally, inhibiting de novo ceramide synthesis improves the response of palmitic acid-treated Caco-2/TC7 enterocytes to insulin. These results demonstrate that a palmitic acid-ceramide pathway accounts for impaired intestinal insulin sensitivity, which occurs within several hours following initial lipid exposure.

Keywords: Akt PKB; ceramide; fatty acid; insulin; intestine; lipid; palmitic acid; signaling.


Figures

FIGURE 1.
FIGURE 1.
Effects of palm and olive oils on insulin-dependent intestinal lipid absorption in mice. A, fasted mice were force-fed water, olive oil, or palm oil and either subjected or not to an intraperitoneal injection of insulin (ins) 30 min later. Blood was collected 1 h after the bolus. Plasma triglyceride levels were quantified. #, p < 0.05, and ##, p < 0.01, as compared with water; **, p < 0.01 as compared with the same condition without insulin, ns, not significant, mean ± S.E., n = 8. B, fasted mice were force-fed either water, olive oil, or palm oil and were either subjected or not to an intraperitoneal insulin (ins) injection 4 h later. Mice were euthanized 30 min after insulin injection. MTP activity was assayed in cellular homogenates of intestinal epithelial cells. Results display mean ± S.E., n = 4, for each condition. #, p < 0.05 as compared with water; *, p < 0.05, as compared with the same condition without insulin; ns, not significant. C, fasted mice were force-fed water, olive oil, or palm oil and were either subjected or not to an intraperitoneal insulin (ins) injection at the same time as lipid bolus. Four hours later, mice were euthanized, and the jejunum was collected. MTP mRNA levels were quantified by RT-PCR in mouse intestinal epithelial cells, and by using L19 mRNA as a reference. Results display mean ± S.E., n = 4, for each condition. #, p < 0.05, as compared with water; *, p < 0.05, as compared with the same condition without insulin; ns, not significant.
FIGURE 2.
FIGURE 2.
Effects of palm and olive oils on insulin signaling in the mouse intestine. Fasted mice were force-fed water, olive oil, or palm oil, and 4 h later were either subjected or not to an intraperitoneal insulin injection. Mice were euthanized 30 min after insulin injection, and cell lysates from intestinal epithelial cells were analyzed by Western blotting for AKT phosphorylation (P-AKT) at serine 473 (top panel). AKT phosphorylation was reported as the ratio of P-AKT to total AKT content (arbitrary units, a.u.) (bottom panel). The P-AKT/AKT ratio obtained in the water condition without insulin was set at 1. Results display mean ± S.E., n = 4, for each condition. **, p < 0.01, and ***, p < 0.001, compared with the same treatment without insulin; ns, not significant.
FIGURE 3.
FIGURE 3.
Effects of palmitic or oleic acid on AKT phosphorylation in cultured human Caco-2/TC7 enterocytes. A, Caco-2/TC7 cells were incubated with oleic acid- or palmitic acid-containing lipid micelles (OA and PA, respectively) for 24 h. As indicated, insulin (ins) was added to the culture 10 min prior to harvesting. Cell lysates were used for Western blotting analysis of IRS phosphorylation at tyrosine 612, with Hsc70 as loading control (left panel). Ratios of phosphorylated IRS to Hsc70 protein, expressed as arbitrary units (a.u.), are reported in the right panel. Results display mean ± S.E., n = 4. *, p < 0.05, as compared with the same condition without insulin; ns, not significant. B, Caco-2/TC7 cells were cultured in the presence or absence of OA- or PA-containing lipid micelles for 24 h. Cells were incubated with or without insulin (ins) for 10 min prior to harvest. AKT phosphorylation at serine 473 (P-AKTSer-473) or threonine 308 (P-AKTThr-308) was analyzed by Western blotting (left panel) using specific antibodies against the phosphorylated residues. Total AKT was used as control, and the ratios of the respective P-AKT to total AKT content are reported (right panels). The P-AKT/AKT ratio obtained under control conditions (without lipid micelles and insulin) was set at 1. *, p < 0.05; **, p < 0.01, as compared with the same conditions without insulin. ns, not significant, mean ± S.E., n = 4. C, Caco-2/TC7 cells were incubated in the presence or absence of palmitic acid-containing lipid micelles (PA) for 6 or 24 h and treated or not with insulin for 10 min prior to harvest. AKT phosphorylation in cell lysates was analyzed by Western blotting (left panel). Quantification of AKT phosphorylation was expressed as the ratio of P-AKT to total AKT (right panels) in arbitrary units (a.u.). Results display mean ± S.E., n = 4. *, p < 0.05, and **, p < 0.01, as compared with the same conditions without insulin. ns, not significant.
FIGURE 4.
FIGURE 4.
Effects of palm oil on ceramide production in mouse intestinal epithelial cells. A, total ceramide was quantified in mouse plasma 4 h after a water, olive oil, or palm oil bolus. Results (mean ± S.E.) are expressed as pmol/50 μl plasma. *, p < 0.05 versus water, n = 4, for each condition. B–E, mice received or not myriocin (myr) by gavage and a bolus of water or palm oil 30 min later. These treatments were repeated for four consecutive days (n = 4, for each condition). On the 4th day of the experiment, ceramides and dihydroceramides were quantified in plasma and intestinal epithelial cells by mass spectrometry. B, total plasma ceramides were quantified before (T0, white boxes) and 2 h after the gavage (T2, black boxes). Results (mean ± S.E.) are expressed as pmol/50 μl plasma. **, p < 0.01, as compared with palm oil at T0. C, total ceramide content was quantified in intestinal epithelial cells 2 h after the final water or palm oil gavage, with or without myriocin treatment. Results (mean ± S.E.) are expressed as pmol/mg of protein. ##, p < 0.01, as compared with palm oil. D, total DHCers were quantified in mouse intestinal epithelial cells 2 h after the final gavage. Results (mean ± S.E.) are expressed as pmol/mg of protein. **, p < 0.01, as compared with control; #, p < 0.05, as compared with palm oil. E, quantification of C20- and C22-dihydroceramides (C20 DHCer and C22 DHCer, respectively) was carried out in mouse intestinal epithelial cells 2 h after the bolus. Results (mean ± S.E.) are expressed as pmol/mg of protein. *, p < 0.05, and ***, p < 0.001, as compared with water.
FIGURE 5.
FIGURE 5.
Effects of palmitic acid on ceramide production in Caco-2/TC7 enterocytes. A, cellular ceramide species content was quantified in control cells and in cells treated for 24 h with OA- or PA-containing lipid micelles. Results (mean ± S.E.) are expressed as pg/mg protein. *, p < 0.05; **, p < 0.01, and ***, p < 0.001 as compared with control cells, n = 4. B, representative Western blot of SPT2 (upper panel) in cell lysates from Caco-2/TC7 cells cultured under the same conditions as in A. Hsc70 protein was used as loading control. The lower panel represents the quantification of SPT2 protein levels expressed as the SPT2/Hsc70 ratio in arbitrary units (a.u.), the control value being set to 1. Results display mean ± S.E., n = 6; **, p < 0.01, as compared with control.
FIGURE 6.
FIGURE 6.
Effects of C2-ceramide addition and de novo ceramide synthesis inhibition on insulin-dependent AKT phosphorylation. A, Caco-2/TC7 cells were incubated for 6 or 24 h with or without C2-ceramide. For some conditions, insulin was added 10 min prior to harvest. AKT phosphorylation in cell lysates was analyzed by Western blotting (left panel). Specific antibodies against phosphorylated serine 473 (P-AKTSer-473) and threonine 308 (P-AKTThr-308) AKT residues were used. Total AKT was used as control. The quantification of AKT phosphorylation is displayed in the right panel. Results are expressed as the P-AKT/total AKT ratio in arbitrary units (a.u.). Results represent mean ± S.E., n = 4. *, p < 0.05, and **, p < 0.01, as compared with the same condition without insulin. #, p < 0.05, as compared with control cells in the presence of insulin. B, Caco-2/TC7 cells were incubated 24 h with or without palmitic acid-containing lipid micelles (PA). For some conditions, cells were pre-treated with l-cycloserine for 1 h before incubation with PA-containing lipid micelles (PA+Lcyclo). When appropriate, insulin was added 10 min prior to harvest. AKT phosphorylation in cell lysates was analyzed by Western blotting (left panels). Specific antibodies against phosphorylated serine 473 (P-AKTSer-473) and threonine 308 (P-AKTThr-308) AKT residues were used. Total AKT was used as control. Quantification of AKT phosphorylation (right panels) was expressed as the P-AKT/total AKT ratio in arbitrary units (a.u.); the ratio value obtained without insulin for each condition was set at 1. *, p < 0.05; **, p < 0.01, and ***, p < 0.001, as compared with the same condition without insulin, ns, not significant, n = 4.
FIGURE 7.
FIGURE 7.
Effects of PKC and PP2A inhibitors on insulin-dependent AKT phosphorylation. Caco-2/TC7 cells were incubated with or without 100 μm C2-ceramide (C2-cer) for 6 h. For some conditions, insulin was added 10 min prior to harvest. When indicated, cells were treated for 24 h with 5 μm Ro 31.8220 (A) or 100 nm OKA (B). AKT phosphorylation in cell lysates was analyzed by Western blotting (left panels). Specific antibodies against phosphorylated serine 473 (P-AKTSer-473) and threonine 308 (P-AKTThr-308) AKT residues were used. Total AKT was used as control. Quantifications of AKT phosphorylation are displayed in the right panels. Results are expressed as the P-AKT/total AKT ratio in arbitrary units (a.u.). Results represent mean ± S.E., n = 3. **, p < 0.01, and ***, p < 0.001, as compared with the same condition without insulin; #, p < 0.05, ##, p < 0.01, and ###, p < 0.001, as compared with the indicated condition.
FIGURE 8.
FIGURE 8.
Effects of de novo ceramide synthesis inhibition on MTP activity and apoB48 secretion in Caco-2/TC7 cells. Caco-2/TC7 cells were incubated with or without OA- or PA-containing lipid micelles (PA) for 24 h. When indicated, l-cycloserine was added 1 h before incubation with PA-containing lipid micelles (PA+Lcyclo). Insulin (ins) was added 30 min prior to harvest. A, apoB48 secretion in basal culture medium was determined by Western blotting (left panel). Quantification of the Western blotting is displayed in the right panel. Results are expressed as arbitrary units (mean ± S.E., n = 6). ***, p < 0.001, as compared with the same condition without insulin; ###, p < 0.001, as compared with control; ns, not significant. B, MTP activity was assayed in cell homogenates. Results display mean ± S.E., n = 6, for each condition. *, p < 0.05, as compared with the same condition without insulin; **, p < 0.01, as compared with the indicated condition; ##, p < 0.01, as compared with control.

Similar articles

Cited by

References

    1. Bansal S., Buring J. E., Rifai N., Mora S., Sacks F. M., and Ridker P. M. (2007) Fasting compared with nonfasting triglycerides and risk of cardiovascular events in women. JAMA 298, 309–316 - PubMed
    1. Nordestgaard B. G., Benn M., Schnohr P., and Tybjaerg-Hansen A. (2007) Nonfasting triglycerides and risk of myocardial infarction, ischemic heart disease, and death in men and women. JAMA 298, 299–308 - PubMed
    1. Duez H., Pavlic M., and Lewis G. F. (2008) Mechanism of intestinal lipoprotein overproduction in insulin resistant humans. Atherosclerosis 9, 33–38 - PubMed
    1. Phillips C., Madigan C., Owens D., Collins P., and Tomkin G. H. (2002) Defective chylomicron synthesis as a cause of delayed particle clearance in diabetes? Int. J. Exp. Diabetes Res. 3, 171–178 - PMC - PubMed
    1. Adeli K., and Lewis G. F. (2008) Intestinal lipoprotein overproduction in insulin-resistant states. Curr. Opin. Lipidol. 19, 221–228 - PubMed