. 2016 Oct;21(9):887-96.
doi: 10.1177/1087057116652064. Epub 2016 Jun 2.

A Novel Automated High-Content Analysis Workflow Capturing Cell Population Dynamics from Induced Pluripotent Stem Cell Live Imaging Data

Affiliations

A Novel Automated High-Content Analysis Workflow Capturing Cell Population Dynamics from Induced Pluripotent Stem Cell Live Imaging Data

Maximilian Kerz et al. J Biomol Screen. 2016 Oct.

Abstract

Most image analysis pipelines rely on multiple channels per image with subcellular reference points for cell segmentation. Single-channel phase-contrast images are often problematic, especially for cells with unfavorable morphology, such as induced pluripotent stem cells (iPSCs). Live imaging poses a further challenge, because of the introduction of the dimension of time. Evaluations cannot be easily integrated with other biological data sets including analysis of endpoint images. Here, we present a workflow that incorporates a novel CellProfiler-based image analysis pipeline enabling segmentation of single-channel images with a robust R-based software solution to reduce the dimension of time to a single data point. These two packages combined allow robust segmentation of iPSCs solely on phase-contrast single-channel images and enable live imaging data to be easily integrated to endpoint data sets while retaining the dynamics of cellular responses. The described workflow facilitates characterization of the response of live-imaged iPSCs to external stimuli and definition of cell line-specific, phenotypic signatures. We present an efficient tool set for automated high-content analysis suitable for cells with challenging morphology. This approach has potentially widespread applications for human pluripotent stem cells and other cell types.

Keywords: CellProfiler; HipDynamics; high-content screening; iPSC; live imaging.


Conflict of interest statement

The authors declared no potential conflicts of interest with respect to the research, authorship, and/or publication of this article.

Figures

Figure 1.
Figure 1.
High-level overview of typical live-image analysis workflows compared with the novel one described in this study. (A) Manual: Manual cell counting, data curation, and quality assessment. (B) Semi-automated workflow with automated image segmentation requiring multichannel images (IAPMCI), followed by manual data curation to account for time dimension. (C) Automated workflow: Involves automated image segmentation of single-channel images (IAPSCI), time-dimensionality reduction (HipDynamics), and downstream analyses.
Figure 2.
Figure 2.
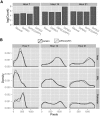
Key performance indicators (KPIs) for quantitative comparison of image analysis pipeline for multichannel images (IAPMCI) and image analysis pipeline for single-channel images (IAPSCI). (A) KPI 1: Number of objects identified by manual count, IAPMCI, IAPSCI (green fluorescents protein [GFP]), and IAPSCI at hour 7, 14, and 21 on a log scale. IAPSCI does not depend on expression of GFP and identifies a larger number of objects compared with the others, both similar to a manual count. (B) KPI 2: Area, minor axis length (MAL), and perimeter density of all objects identified by IAPMCI and equivalent objects identified by IAPSCI (GFP) at hour 7, 14, and 21. There is an overall similarity in the density for both pipelines demonstrating comparable performance.
Figure 3.
Figure 3.
A descriptive example of visualization and dimensionality reduction for distinct features obtained by HipDynamics. (A) A condition-level view of the effect of fibronectin (FN) concentrations on area for induced pluripotent stem cell (iPSC) cultures (from top to bottom: CTR-M2-O2 P45, CTR-M2-O2 P45, and IELY). The increase in objects area with time due to spreading and formation of clumps takes place at different rates, depending on the extracellular condition (from left to right: 1, 5, or 25 µg/mL). (B) Computation of time dimensionality–reduced data point, the gradient of the linear curve, of the IELY cell line at (FN) 25 µg/mL. The gradient of the red curve is computed using the mean of all interquartile ranges (IQRs) for each hour. The same methodology is applied at every condition level for each cell line to all features.
Figure 4.
Figure 4.
Characterization of cell lines using HipDynamic’s feature signature vectors. (A) Cell lines’ signature vectors constructed from the gradients of each measure at different fibronectin (FN) concentrations (from left to right: 1 µg/mL, 5 µg/mL, and 25 µg/mL). Some features are FN dependent, and the IELY signature appears distinct. The red arrows highlight one specific feature (cell edge intensity) as an example. (B) The feature signature vectors were assembled in correlation matrices according to their FN concentration (condition level).

References

    1. Stephens D. J., Allan V. J. Light Microscopy Techniques for Live Cell Imaging. Science 2003, 300, 82–87. - PubMed
    1. Meijering E. Cell Segmentation: 50 Years down the Road. IEEE Signal Processing Magazine 2012, 29, 140–145.
    1. Wu Q., Merchant F. A., Castleman K. R. Microscope Image Processing; Academic Press: Burlington (MA), 2008.
    1. Carpenter A. E., Jones T. R., Lamprecht M. R., et al. CellProfiler: Image Analysis Software for Identifying and Quantifying Cell Phenotypes. Genome Biol. 2006, 7, R100. - PMC - PubMed
    1. Bray M.-A., Vokes M. S., Carpenter A. E. Using CellProfiler for Automatic Identification and Measurement of Biological Objects in Images. Curr. Protoc. Mol. Biol. 2016, 108, 14.17.1–14.17.13. - PMC - PubMed

MeSH terms