. 2016 Aug 25:330:267-90.
doi: 10.1016/j.neuroscience.2016.05.052. Epub 2016 May 30.

The intercalated nuclear complex of the primate amygdala

Affiliations

The intercalated nuclear complex of the primate amygdala

Basilis Zikopoulos et al. Neuroscience. .

Abstract

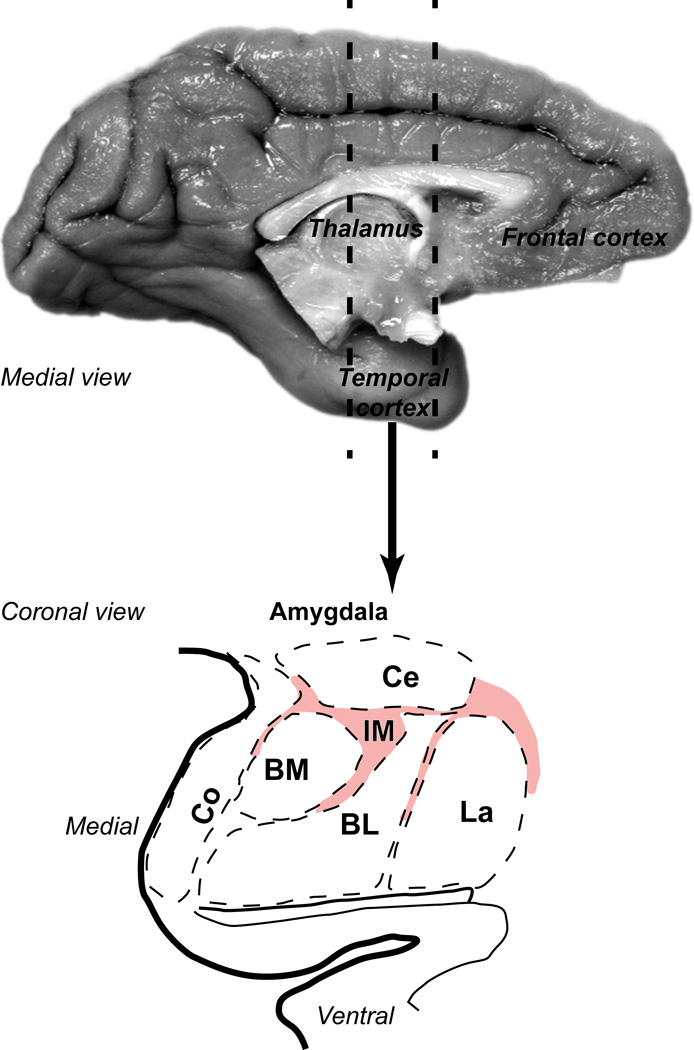
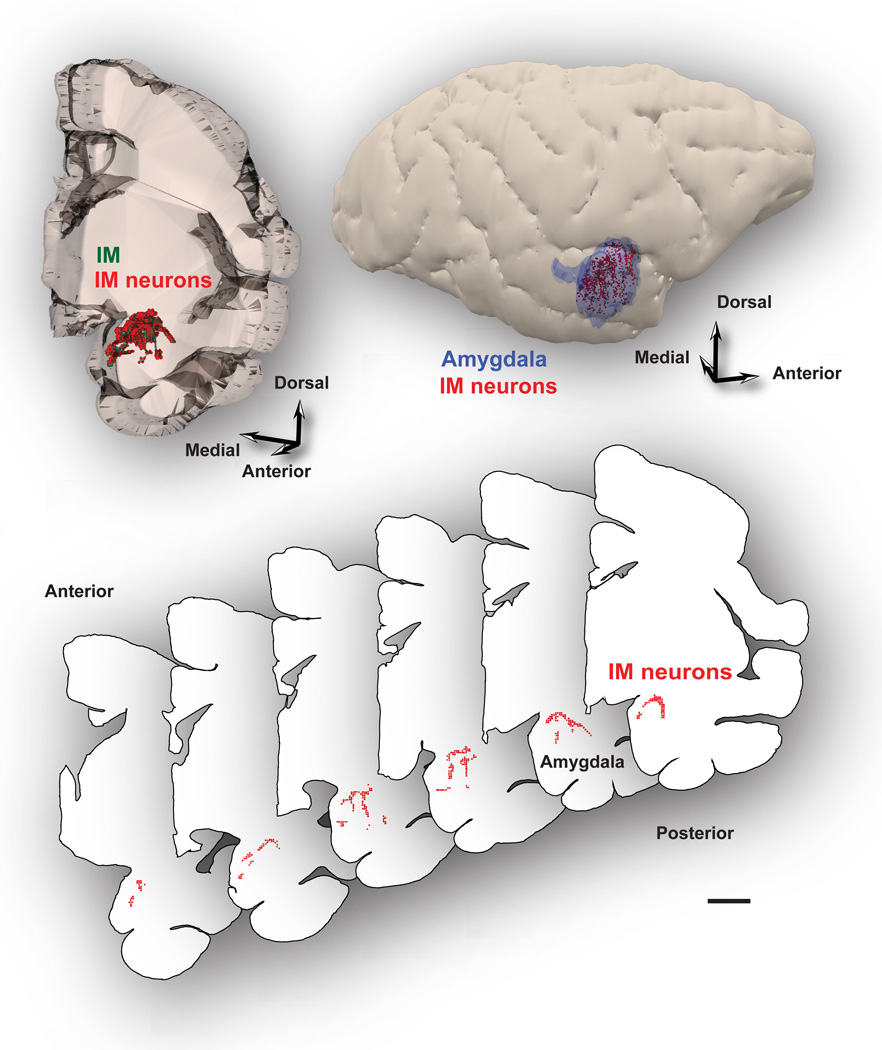
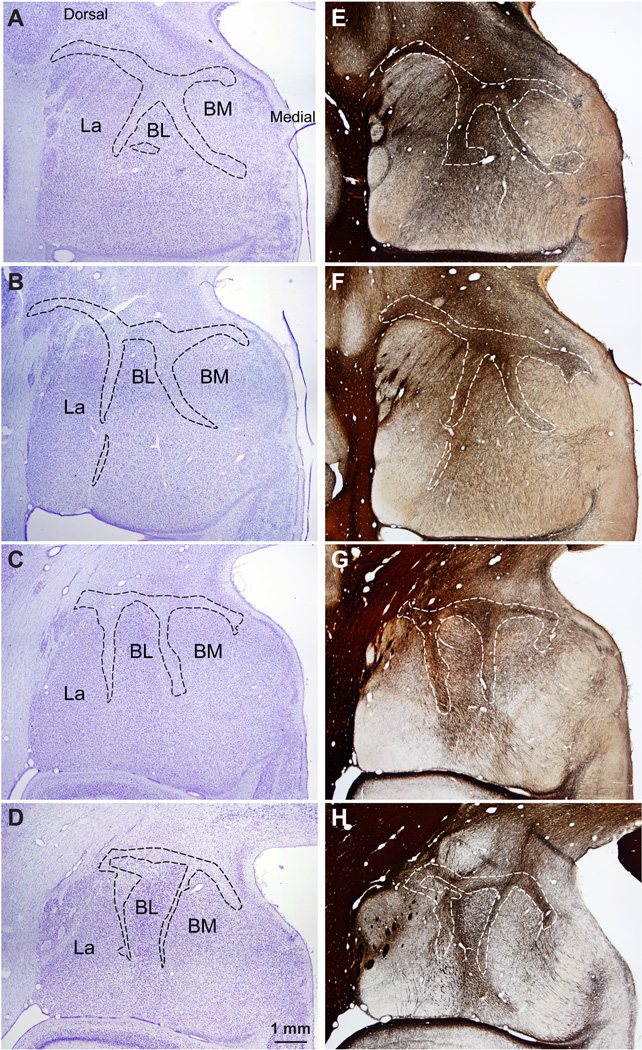
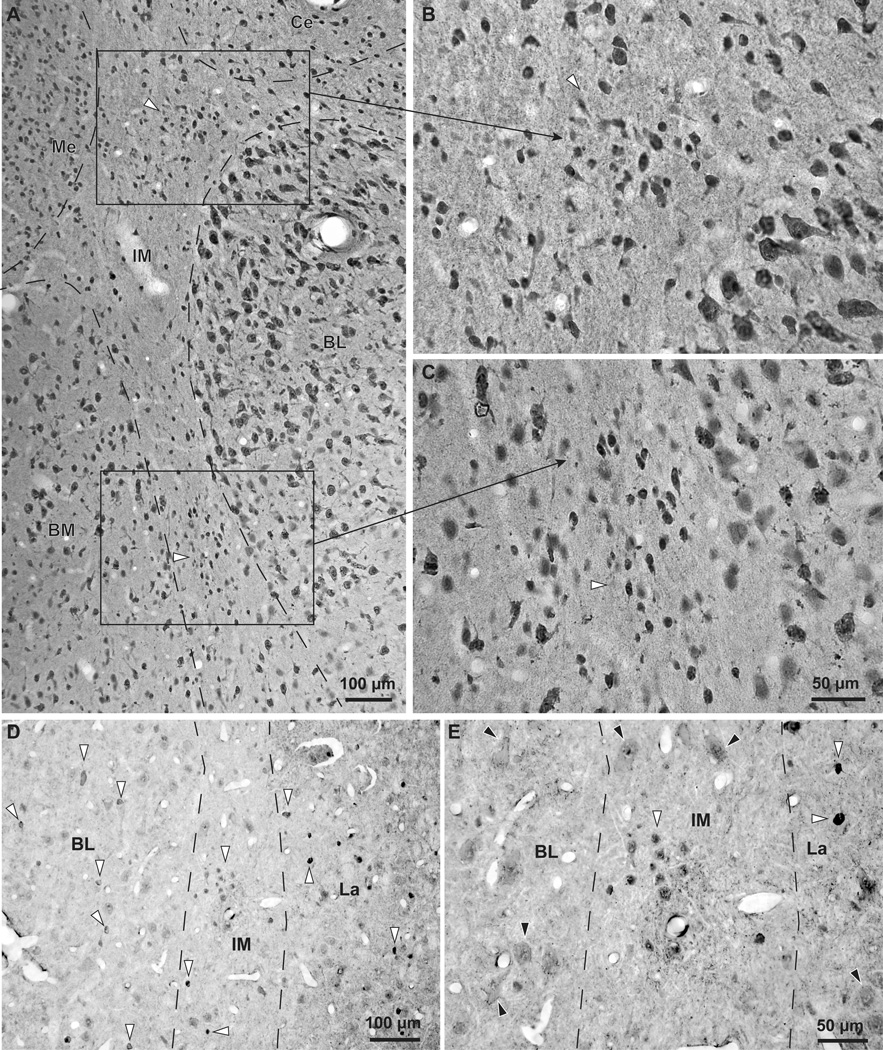
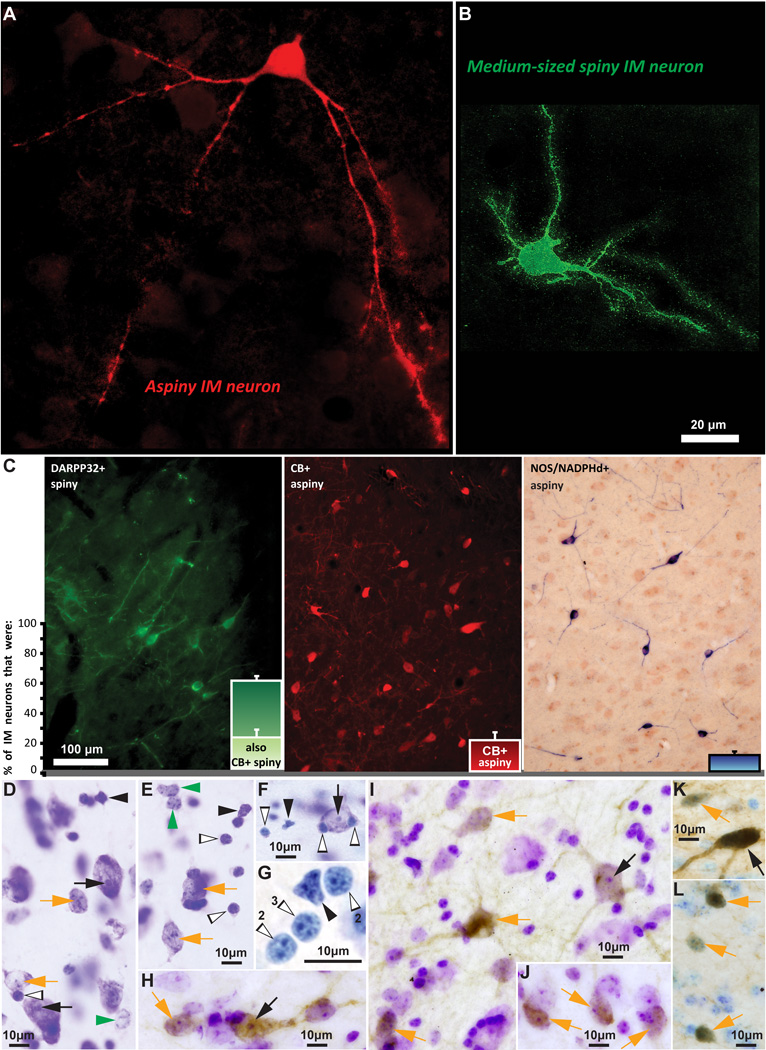
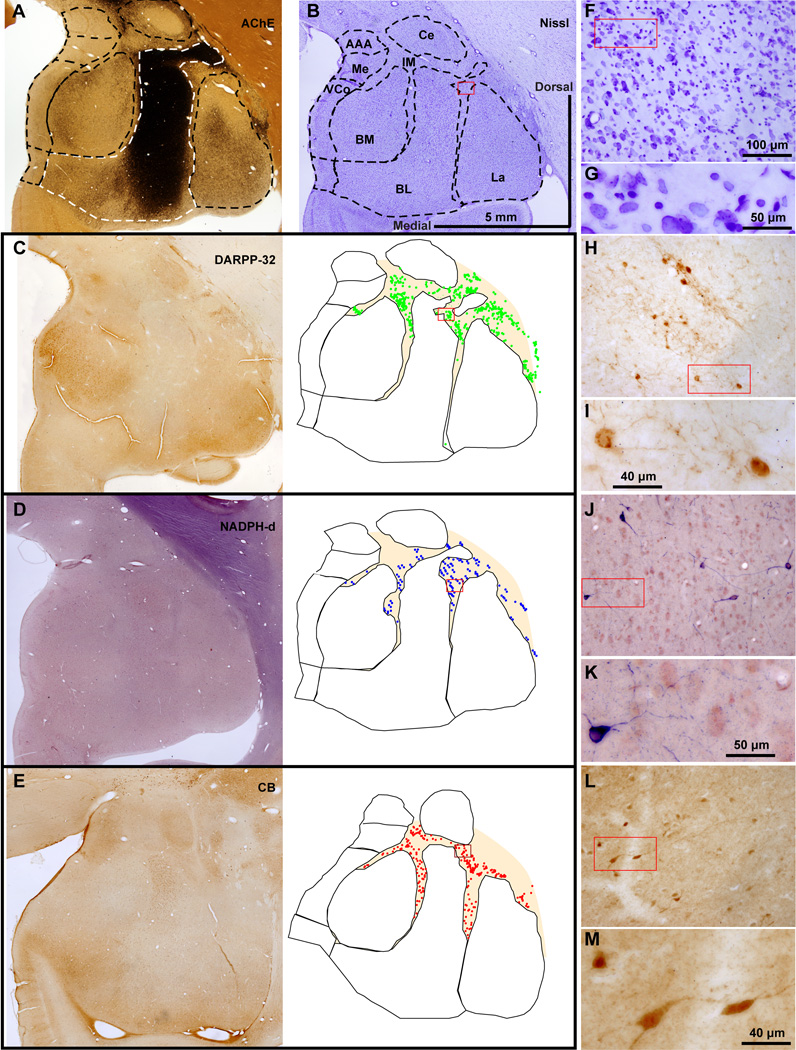
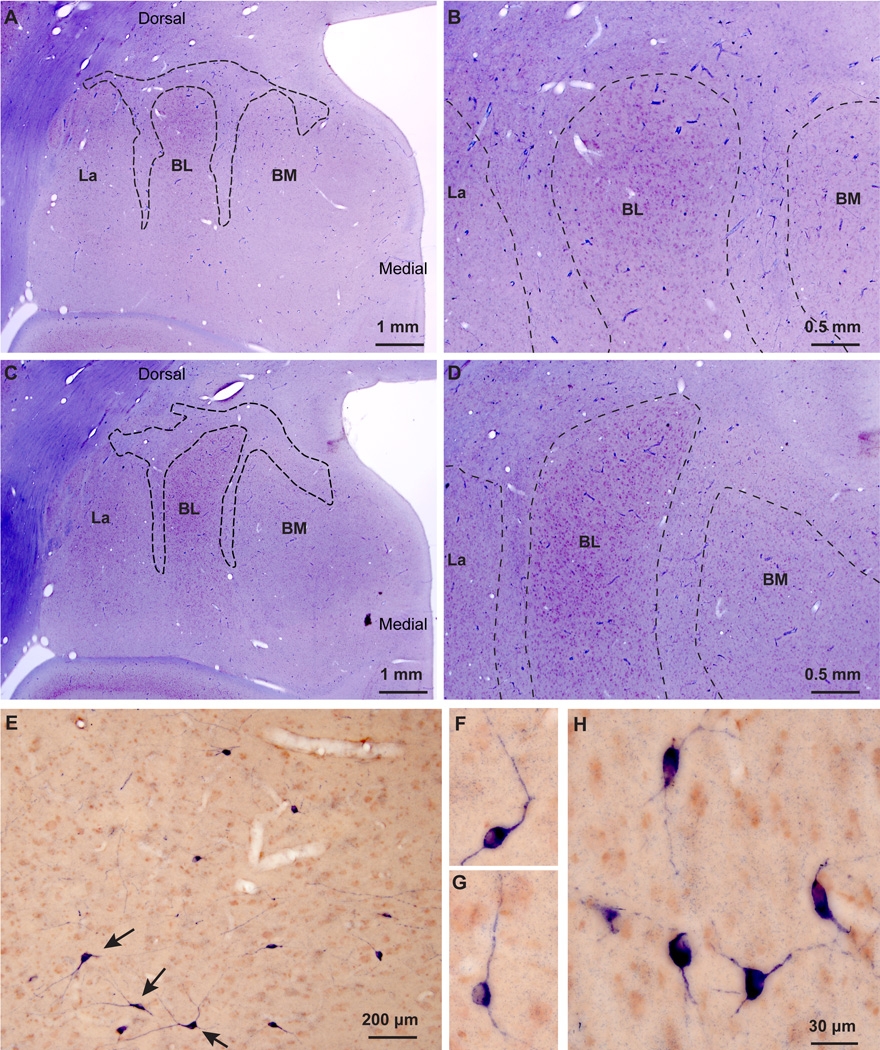
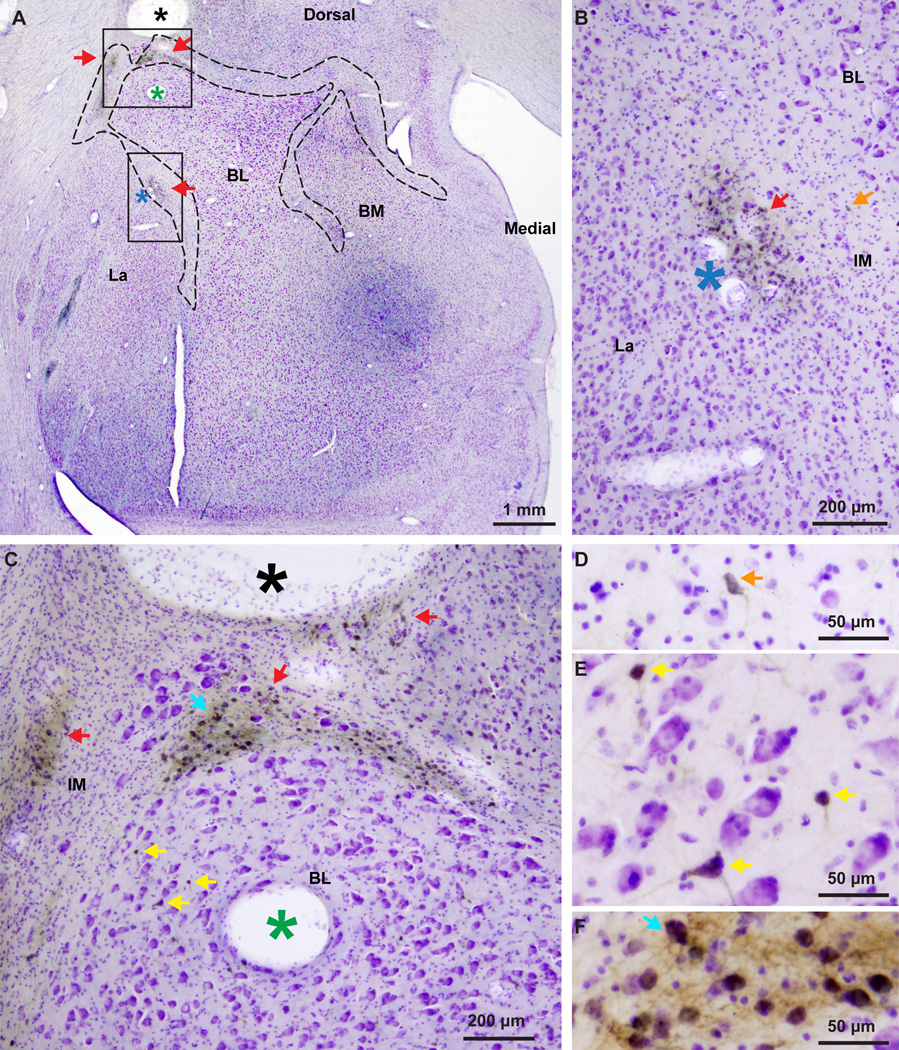
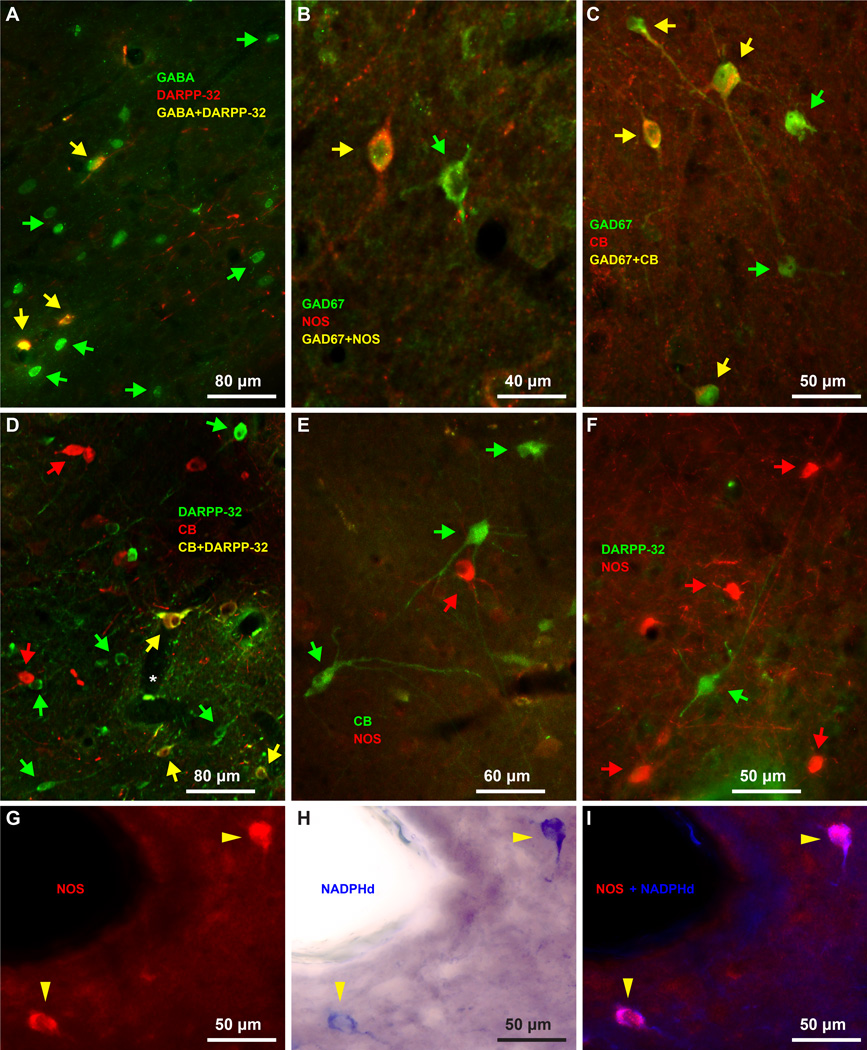
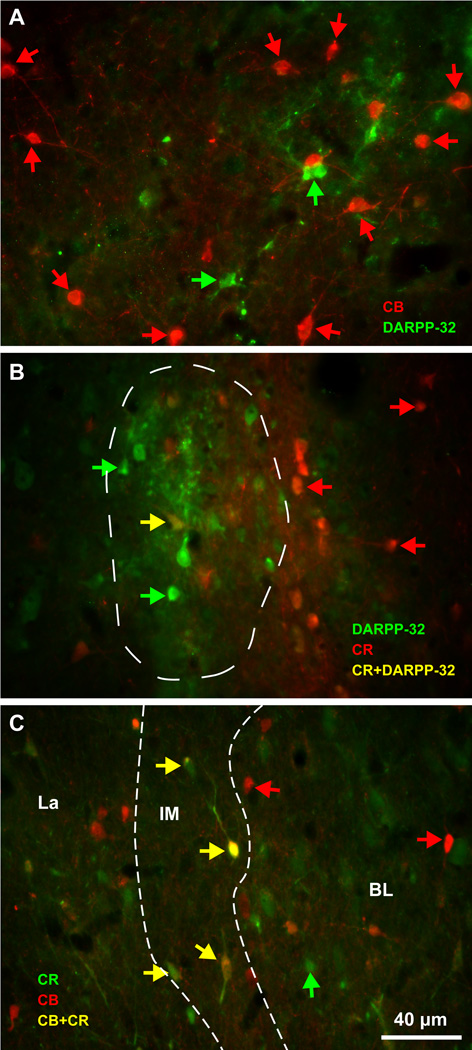
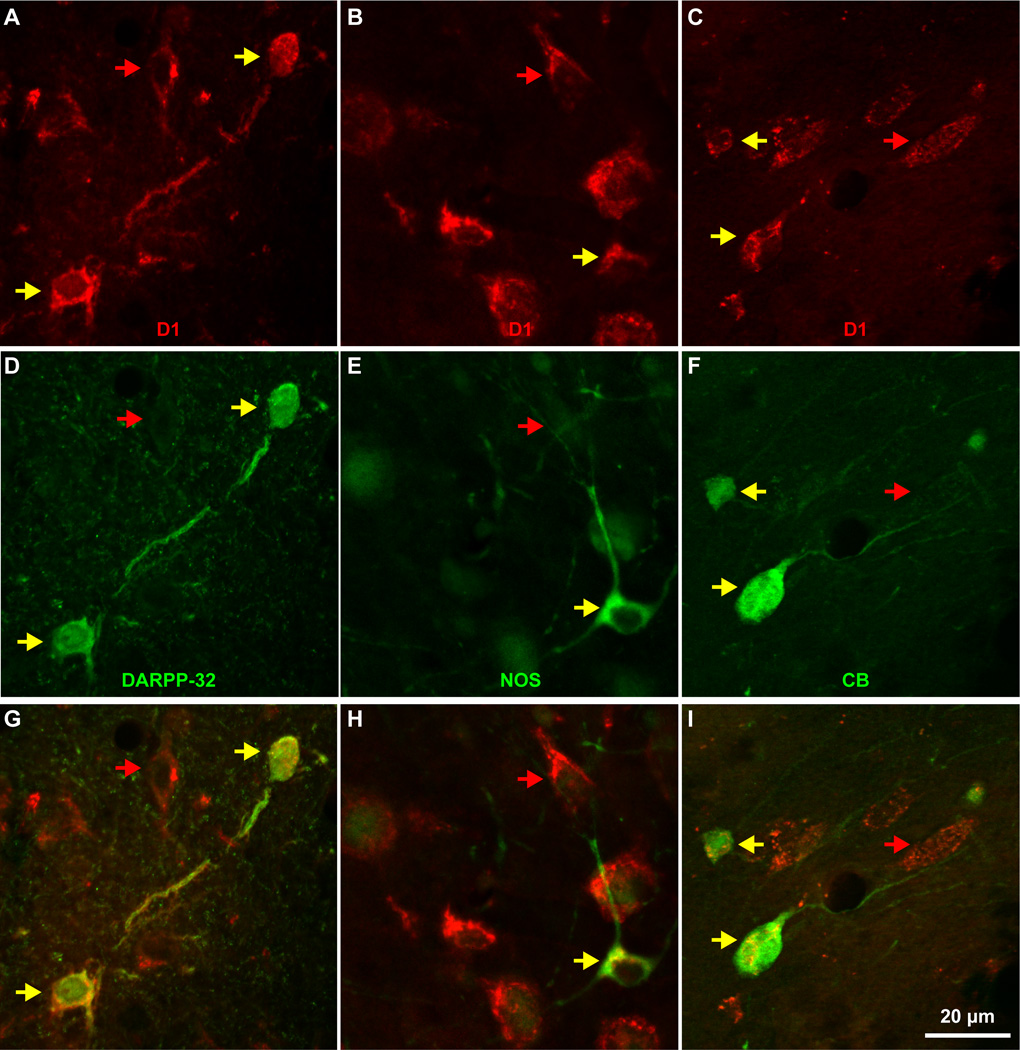
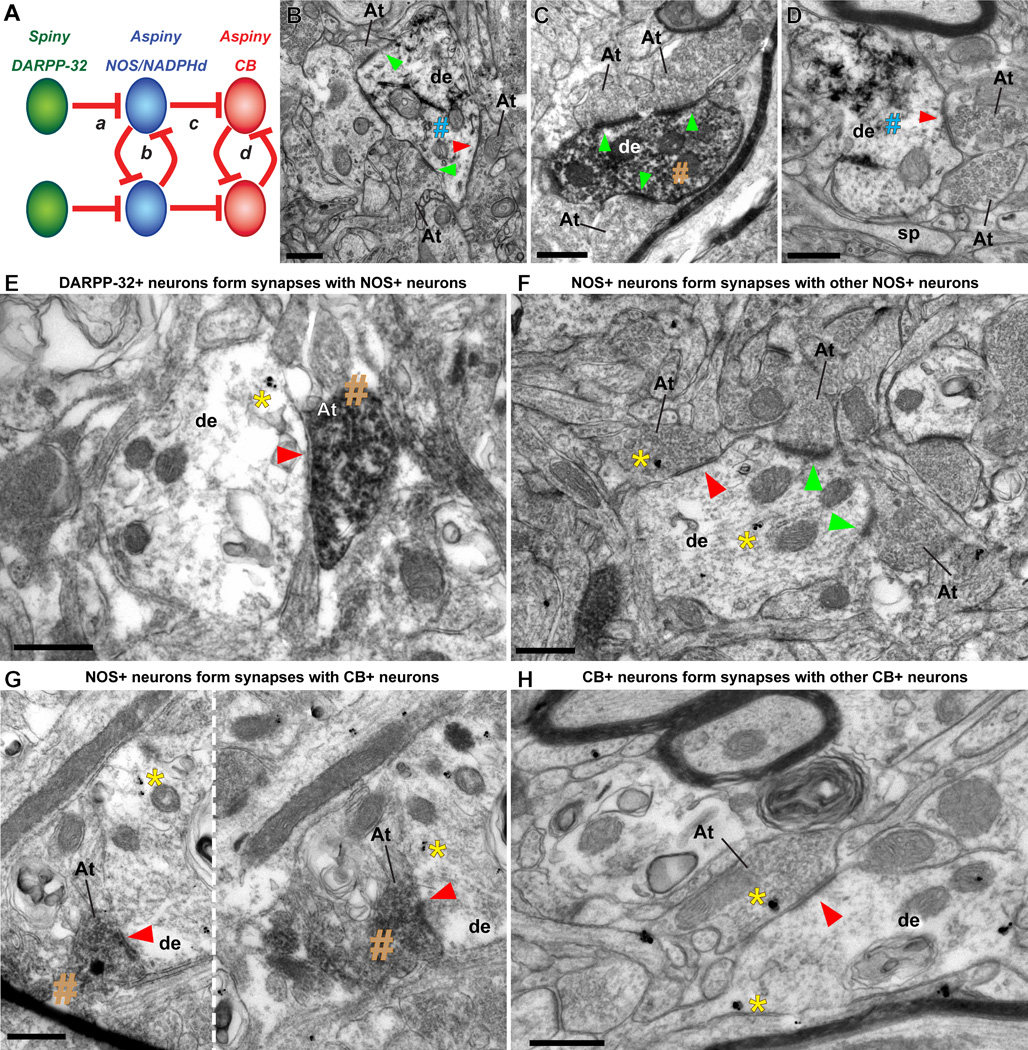
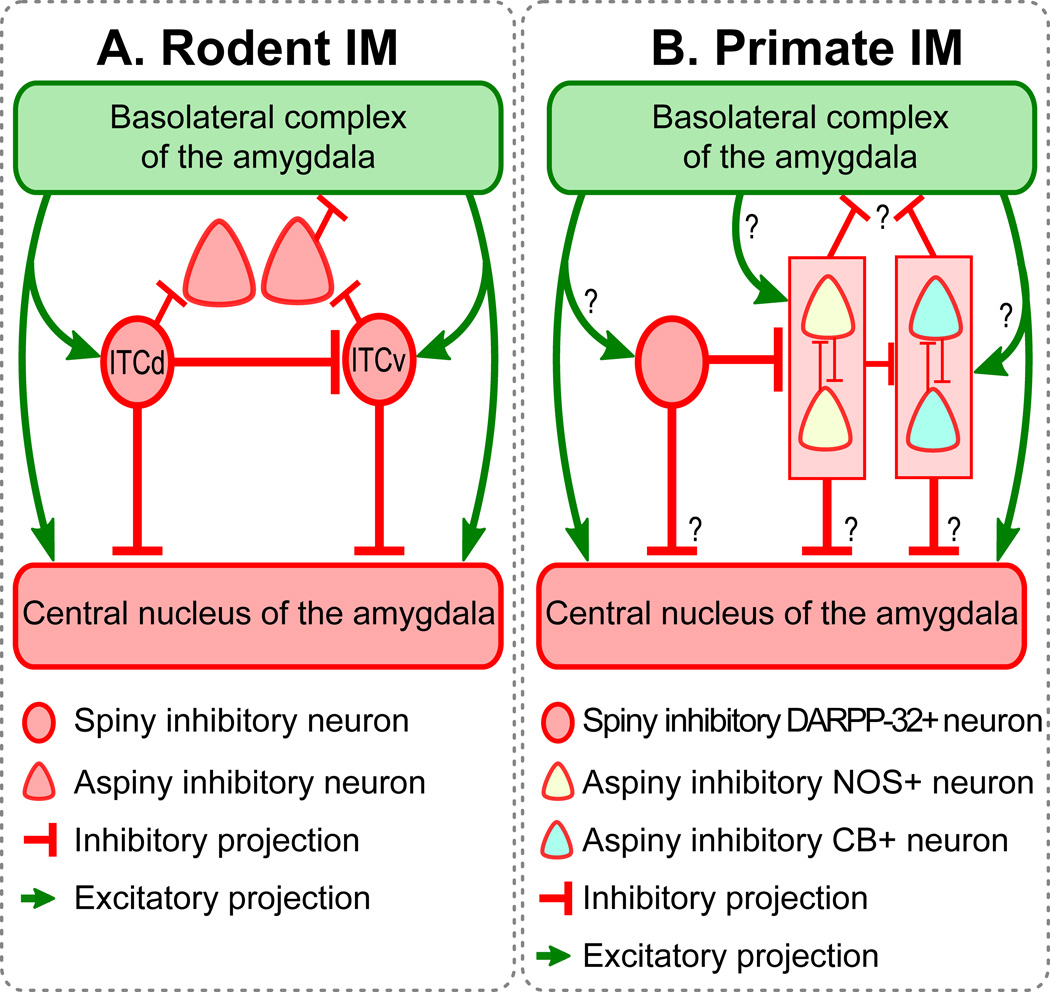
The organization of the inhibitory intercalated cell masses (IM) of the primate amygdala is largely unknown despite their key role in emotional processes. We studied the structural, topographic, neurochemical and intrinsic connectional features of IM neurons in the rhesus monkey brain. We found that the intercalated neurons are not confined to discrete cell clusters, but form a neuronal net that is interposed between the basal nuclei and extends to the dorsally located anterior, central, and medial nuclei of the amygdala. Unlike the IM in rodents, which are prominent in the anterior half of the amygdala, the primate inhibitory net stretched throughout the antero-posterior axis of the amygdala, and was most prominent in the central and posterior extent of the amygdala. There were two morphologic types of intercalated neurons: spiny and aspiny. Spiny neurons were the most abundant; their somata were small or medium size, round or elongated, and their dendritic trees were round or bipolar, depending on location. The aspiny neurons were on average slightly larger and had varicose dendrites with no spines. There were three non-overlapping neurochemical populations of IM neurons, in descending order of abundance: (1) Spiny neurons that were positive for the striatal associated dopamine- and cAMP-regulated phosphoprotein (DARPP-32+); (2) Aspiny neurons that expressed the calcium-binding protein calbindin (CB+); and (3) Aspiny neurons that expressed nitric oxide synthase (NOS+). The unique combinations of structural and neurochemical features of the three classes of IM neurons suggest different physiological properties and function. The three types of IM neurons were intermingled and likely interconnected in distinct ways, and were innervated by intrinsic neurons within the amygdala, or by external sources, in pathways that underlie fear conditioning and anxiety.

Keywords: anxiety; connectivity; emotion; inhibition; medium spiny; quantitative anatomy.


Figures

Figure 1
Figure 1
The rhesus macaque amygdala. Medial view (top) of the rhesus monkey brain shows the temporal region that contains the primate amygdala (dotted lines). Bottom panel shows coronal view of the outline of a representative section through a central level of the antero-posterior extent of the amygdala. Pink hue delineates the extensive regions between amygdalar nuclei that contain IM clusters and numerous, previously unclassified inhibitory neurons. This area was collectively designated as IM in the primate amygdala.
Figure 2
Figure 2
GABAergic IM neurons form a continuous inhibitory net. IM neurons surround primarily the basal and lateral nuclei, and to a lesser extent, the cortical nuclei of the amygdala. Top, Reconstruction of the amygdala in the rhesus monkey in 3D shows the distribution of IM neurons (red dots) in tissue slab (left). The relative antero-posterior position of the amygdala is depicted on the lateral view of the right hemisphere (right). Bottom, Serial coronal sections were outlined and used to reconstruct the IM in 3D and map neurons in each case. Each red dot represents one plotted neuron. Note that IM neurons partly outline the basal nuclei. Scale bars: 5 mm.
Figure 3
Figure 3
The IM of the rhesus macaque in serial coronal sections through the amygdala. A–D, Nissl-stained sections from anterior (A) to posterior (D) levels of the amygdala. E–H, Matched sections stained for myelin. Dotted outlines indicate approximate borders of IM neuropil in a region rich in glia and myelinated fiber tracts that contain mostly small neurons positioned between the main amygdalar nuclei. Scale bar in D applies to all panels.
Figure 4
Figure 4
The IM clusters in the rhesus monkey brain. NeuN and GABA immunohistochemistry in the IM of the rhesus monkey amygdala. A–C, Coronal brain section stained for NeuN through the amygdala. A, Low magnification shows the demarcated IM, including some clusters (white and black, silhouette arrowheads). B–C, IM clusters are seen at higher magnification. Note the small size of IM neurons compared to neurons in BL and BM. D–E, Isolated inhibitory neurons and small IM neuron clusters (white and black, silhouette arrowheads) are labeled with GABA. BL and La also contain inhibitory GABAergic neurons that can be darkly or lightly stained (white and black, silhouette arrowheads). In contrast, pyramidal neurons in BL and La are larger in size, often have pyramidal shape, and have very light, background levels of staining in their cytoplasm (black arrowheads in E). In most cases pyramidal neuron somata appear to be surrounded by darkly-stained GABAergic axon terminals that form perineuronal complex basket formations, previously described on pyramidal neurons in cortical and amygdalar areas of many species, including monkeys and humans (black arrowheads in E). Scale bar in C applies to B and C.
Figure 5
Figure 5
Distinct morphological and neurochemical subtypes of inhibitory IM neurons. A, B, Morphologically-distinct aspiny (red, stained with CB) and spiny (green, stained with DARPP-32) IM neurons. C, The three distinct neurochemical subtypes of IM neurons and their relative proportion in the rhesus monkey IM. Note that all spiny neurons in IM were DARPP-32+ and about a third of them were also CB+. Aspiny IM neurons belonged to two classes: those that were CB+ and those that were NOS/NADPHd+. The IM neuron breakdown shown in the bar plots was as follows (mean ± SEM): 63 ± 3% (spiny DARPP-32; a third of these spiny DARPP-32+ neurons also co-expressed CB) + 23 ± 7% (aspiny CB+) + 14 ± 2% (aspiny NOS+). D–G, Nisslstained neurons and glia in IM. H–L, Nissl-counterstained neurons in IM, also labeled for DARPP-32 (H–J), NOS (K), and CB (L), shown as brown DAB precipitate. Different arrows in D–L indicate all identified cell types, based on the size of their cell body, the presence or paucity of stained cytoplasm, size of nucleus, and the presence of one clearly defined nucleolus or multiple heterochromatin clumps, as follows: Black arrows: Large/medium neurons with one clearly defined nucleolus; Orange arrows: Small neurons with multiple heterochromatin clumps; Green arrowheads: Astrocytes, no visible cytoplasm and multiple heterochromatin clumps; Black arrowheads: Microglia, no visible cytoplasm, darkly stained and irregularly-shaped nucleus; White and black, silhouette arrowheads: Oligodendrocytes, no visible cytoplasm, darkly stained and oval or round-shaped nucleus with one to four thick heterochromatin clumps situated under the nuclear envelope (note number of heterochromatin clumps in panel G with lightly stained glial cells, resembling overexposure and high dynamic range during live imaging). Scale bar in B applies to A and B.
Figure 6
Figure 6
Intermingling of different types of inhibitory IM neurons in the rhesus monkey amygdala. A–E, Low power view of the amygdala in matched coronal sections show architectonic features and the outlines of amygdalar nuclei (obtained from A and B), and plots of distinct morphological and neurochemical IM neuron subtypes. A, section stained for AChE; B, section stained with Nissl; C, section stained with DARPP-32; D, section stained with NADPHd; E, section stained with CB. F–M, Progressively higher power views of red rectangular insets in B–E and F, H, J, L show labeled IM neurons. Most DARPP-32+ neurons and some CB+ neurons form neuronal clusters however, most CB+ and all NADPHd+ neurons are loosely distributed within the IM neuropil and in some cases appear to surround the clusters. Scale bar in B applies to A–E; Scale bar in F applies to F, H, J, L.
Figure 7
Figure 7
NADPHd in the IM of the rhesus monkey amygdala. A–D, Low (A, C) and matching higher (B, D) magnification of the amygdala in serial coronal brain sections show cytoarchitectonic features and NADPHd label. Dotted outlines (A, C) indicate approximate borders of IM neuropil. This histochemical reaction labels neuronal processes in a Golgi-like manner, highlighting the increased density of NADPHd+ neurons and the continuity of labeled neurons and their processes in the IM neuropil. Counterstaining with neutral red contrasts the blue IM neuropil region between the main amygdalar nuclei, which is rich in glia, myelinated fiber tracts, and has a high density of NADPHd+ neurons and processes, against a darker, mostly purple/red region occupied by larger neurons in other nuclei. E–H, High magnification shows small/medium (E–G) and large (E: black arrows, H) NADPHd+ neurons and their processes in IM. Scale bar in H applies to F–H.
Figure 8
Figure 8
IM clusters in the rhesus monkey amygdala contain mostly small/medium DARPP-32+ neurons. A–F, Increasing magnifications of a coronal section of the amygdala immunolabeled for DARPP-32 (brown DAB precipitate) and counterstained with Nissl to show cytoarchitectonic features. Dotted outline in A shows approximate borders of the IM neuropil. Rectangles in A are magnified in B and C. Asterisks indicate position of matching blood vessels. Red arrows point to IM neuron clusters, shown at higher magnifications in B–C; yellow and orange arrows point to some DARPP-32+ neurons seen outside the clusters within the IM neuropil and are shown at higher magnification in D and E. The blue arrow in C points to a cluster of IM neurons that is magnified in F. The continuity of the IM neuropil is highlighted by a light and dark brown label, due to staining of DARPP-32+ neurons and their processes within IM.
Figure 9
Figure 9
Biochemical features of IM inhibitory neurons. A, All DARPP-32 neurons co-localize with GABA (yellow arrows). B–C, NOS neurons (B) and CB neurons (C) also express the inhibitory marker GAD67 (yellow arrows). D, Some IM neurons express DARPP-32 and calbindin (yellow arrows). E, CB expressing neurons (green arrows) do not overlap with NOS neurons (red arrows). F, DARPP-32 expressing neurons (green arrows) do not overlap with NOS neurons (red arrows). G–I, NOS and NADPHd co-localize in the same neurons (yellow arrowheads). The distinct neurochemical types of IM neurons are largely intermingled, however, in some cases (D, F) aspiny IM neurons appear to surround spiny IM neurons. Green and red arrows show some single-labeled neurons in panels A–F.
Figure 10
Figure 10
Biochemical features of IM inhibitory neurons. A, Aspiny CB+ IM neurons (red arrows) appeared to surround DARPP-32+ IM neurons (green arrows) at IM levels where there was no or little co-localization of these markers. B, CR+ IM neurons (red arrows) were typically outside clusters of DARPP-32+ IM neurons (green arrows) at IM levels where there was little co-localization of these markers (one double-labeled cell marked with a yellow arrow). C, Occasionally, CR (green arrows) and CB (red arrows) co-localized in the same IM neurons (yellow arrows). White dotted lines delineate IM neuropil. Scale bar in C applies to all panels.
Figure 11
Figure 11
All neurons of three distinct neurochemical subtypes of DARPP-32, NOS, or CB in IM express D1 receptors. A–C, Three high magnification fields through the IM show D1 receptor expression in all neurons (red and yellow arrows). D–F, In the same fields some neurons express DARPP-32, NOS, or CB (yellow arrows). G–I, All neurons expressing one of the three distinct neurochemical subtypes of IM neurons express D1 (yellow arrows).
Figure 12
Figure 12
Synapses in IM neuropil and local amygdalar circuitry in primates. A, Plausible connectivity among IM cells in rhesus macaque, based on quantification of labeled symmetric, presumed inhibitory, synapses at the EM. Red lines connecting distinct neurochemical subtypes of IM neurons indicate inhibitory synapses. B, Dendrite (de) of inhibitory IM neuron labeled with GABA (visualized with TMB, blue #) has two asymmetric (presumed excitatory, green arrowheads) and one symmetric (presumed inhibitory, red arrowhead) synapses with three unlabeled axon terminals (At). C, Dendrite (de) of inhibitory IM neuron labeled with CB (visualized with DAB, brown #) has three asymmetric synapses (green arrowheads) with three unlabeled axon terminals (At). D, Dendrite (de) of inhibitory IM neuron labeled with GAD67 (visualized with TMB, blue #) forming one symmetric synapse (red arrowhead) with an axon terminal (At). E, DARPP-32+ neurons form synapses with NOS+ neurons in IM. Symmetric synapse (red arrowhead) between DARPP32+ axon terminal, labeled with DAB (brown #), and NOS+ dendrite, labeled with gold (yellow *), as illustrated in circuit “a” in (A). F, NOS+ neurons form synapses with other NOS+ neurons in IM. Symmetric synapse (red arrowhead) between NOS+ axon terminal and NOS+ dendrite, labeled with gold, as illustrated in circuit “b” (A). Gold labeling is highlighted by a yellow *. Asymmetric synapses on the same dendrite from non-labeled axon terminals are shown with green arrowheads. G, NOS+ neurons form synapses with CB+ neurons in IM. Series of adjacent EM photomicrographs, separated by a white dotted line, show symmetric synapse (red arrowheads) between NOS+ axon terminal, labeled with DAB (brown #) and CB+ dendrite, labeled by gold, as illustrated in circuit “c” (A). Gold labeling is highlighted by a yellow *. H, CB+ neurons form synapses with other CB+ neurons in IM. Symmetric synapse (red arrowhead) between CB+ axon terminal and CB+ dendrite, labeled with gold, as illustrated in circuit “d” (A). In all images, At: axon terminal; de: dendrite; sp: spine; yellow *: gold labeling; blue #: TMB labeling; brown #: DAB labeling; red arrowhead: symmetric synapse (inhibitory); green arrowhead: asymmetric synapse (excitatory); Scale bar: 0.5 µm.
Figure 13
Figure 13
Schematic diagrams showing (A) the rodent amygdala, and (B) the primate amygdala. ITCd: dorsal intercalated group located between BLA and Ce in rodents; ITCv: ventral intercalated group located between BLA and Ce in rodents. Similarities and differences in the connectivity of IM neurons are highlighted. Similarities between rodent and primate IM include the following: (1) Both contain small- and medium-sized spiny neurons that form clumps or clusters (circular cells). These clusters tend to be linked, creating continuous IM regions. In the rodent these regions are frequently divided into topographic regions. (2) Both contain larger aspiny neurons (triangular cells). (3) In both rodent and primate IM, aspiny neurons are inhibited by the smaller spiny neurons. Differences between rodent and primate IM include: (1) Rodent studies typically show interconnectivity among the spiny neuron groups. Here we show that the spiny DARPP-32+ neurons in primate IM are not interconnected, and only form synapses on the aspiny NOS+ neurons. (2) Rodent studies show that aspiny neurons surround the spiny IM clusters. Here we do not observe such clear-cut topographic separation between the spiny (DARPP-32+) and aspiny (NOS+ and CB+) neurons in IM. It may be more accurate to describe the two neuron groups as partially interspersed. (3) Aspiny neurons in rodents target BLA and extra-amygdalar regions, avoiding the parent IM region. In primates we observed instead a distinct pattern of inhibition among aspiny neurons. We observed that NOS neurons inhibit each other, as do CB neurons. NOS neurons also inhibit CB neurons. Thus instead of a topographically polarized pattern of inhibition, we observed intermingled neurons whose connectivity pattern was determined by neurochemical identity and showed no topographic polarization.

Similar articles

Cited by

References

    1. Amano T, Duvarci S, Popa D, Pare D. The fear circuit revisited: contributions of the basal amygdala nuclei to conditioned fear. J Neurosci. 2011;31:15481–15489. - PMC - PubMed
    1. Amano T, Unal CT, Pare D. Synaptic correlates of fear extinction in the amygdala. Nat Neurosci. 2010;13:489–494. - PMC - PubMed
    1. Amaral DG, Price JL, Pitkanen A, Carmichael ST. The Amygdala: neurobiological aspects of emotion, memory, and mental dysfunction. New York: Wiley-Liss; 1992.
    1. Anderson KD, Reiner A. Immunohistochemical localization of DARPP-32 in striatal projection neurons and striatal interneurons: implications for the localization of D1-like dopamine receptors on different types of striatal neurons. Brain Res. 1991;568:235–243. - PubMed
    1. Asan E. Ultrastructural features of tyrosine-hydroxylase-immunoreactive afferents and their targets in the rat amygdala. Cell Tissue Res. 1997;288:449–469. - PubMed

Publication types

MeSH terms

LinkOut - more resources