

Identification of key metabolic changes in renal interstitial fibrosis rats using metabonomics and pharmacology
- PMID: 27256510
- PMCID: PMC4891668
- DOI: 10.1038/srep27194
Identification of key metabolic changes in renal interstitial fibrosis rats using metabonomics and pharmacology
Abstract
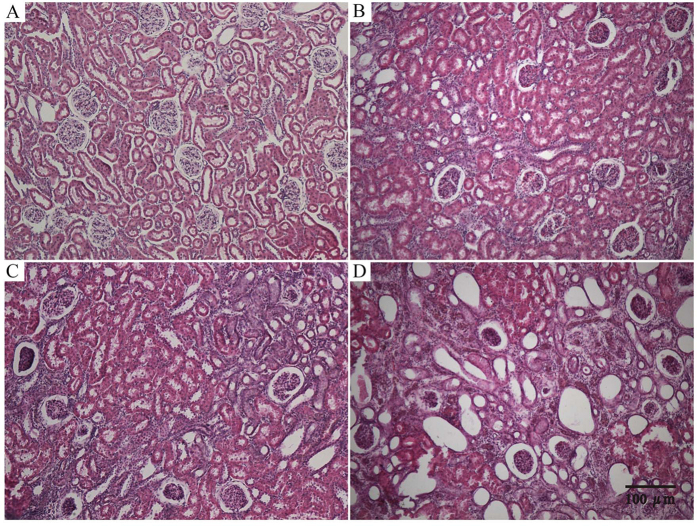
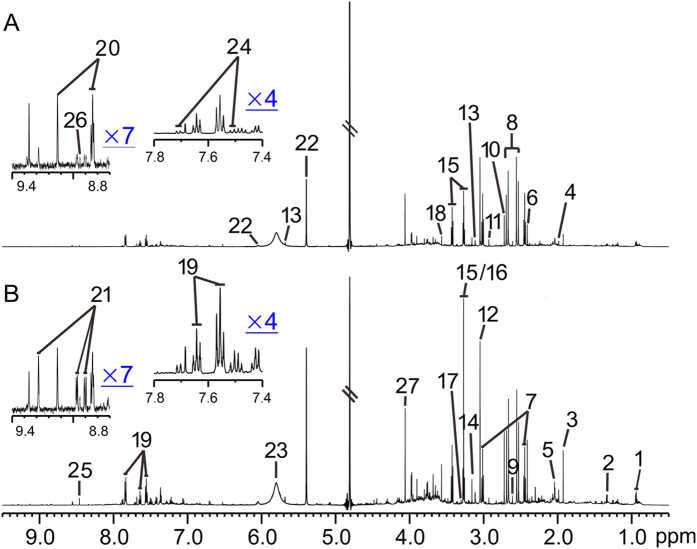
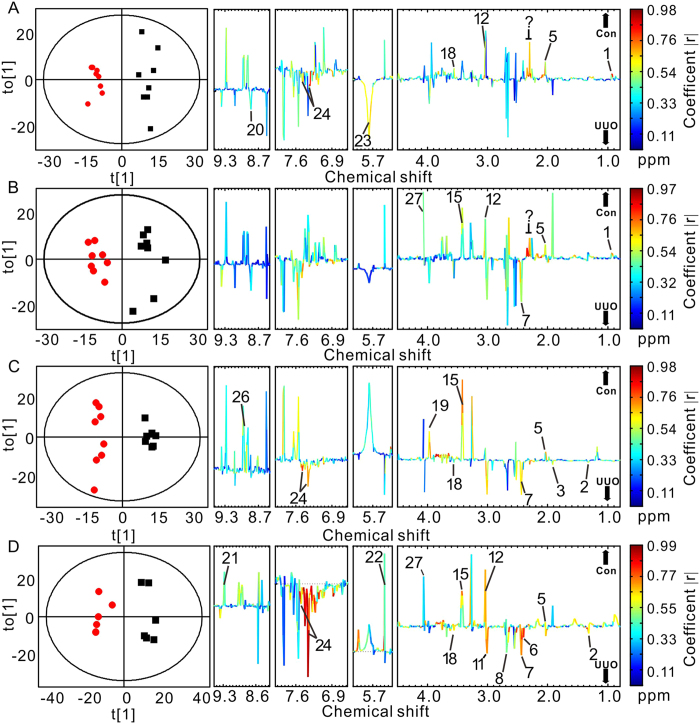
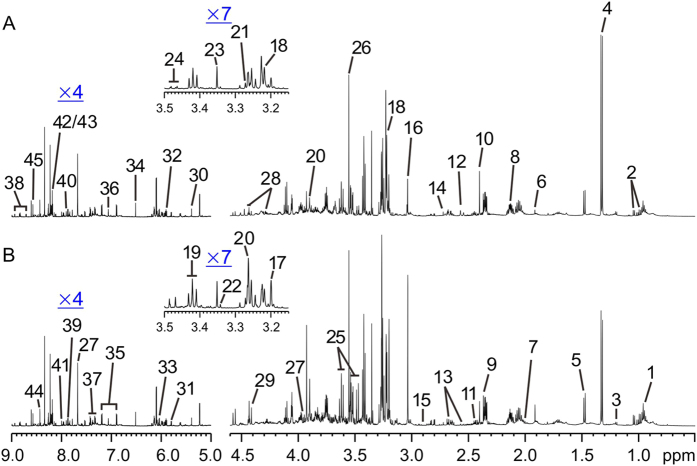
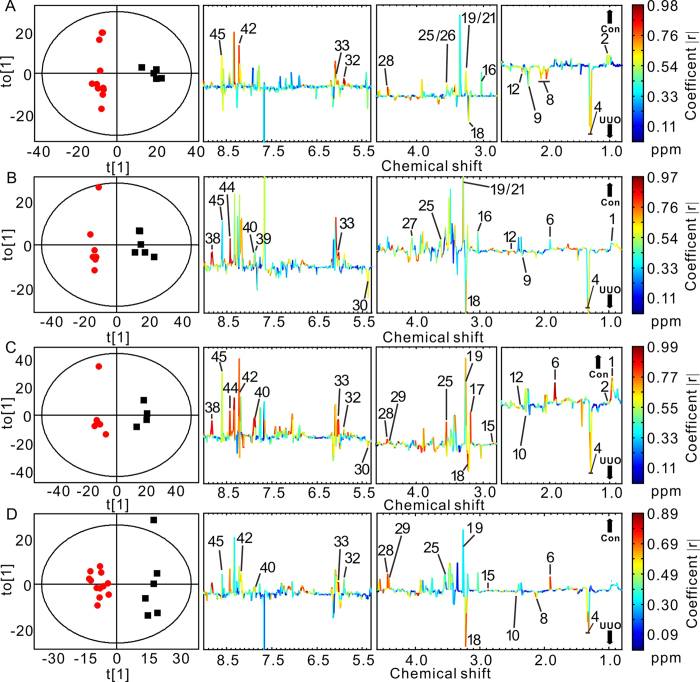
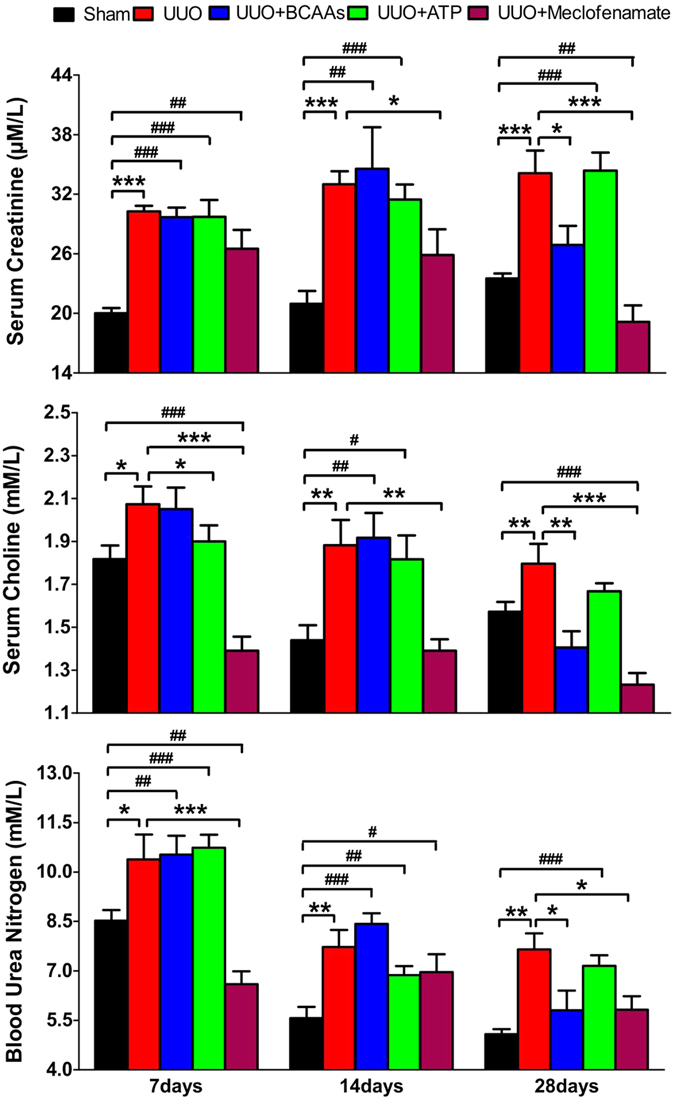
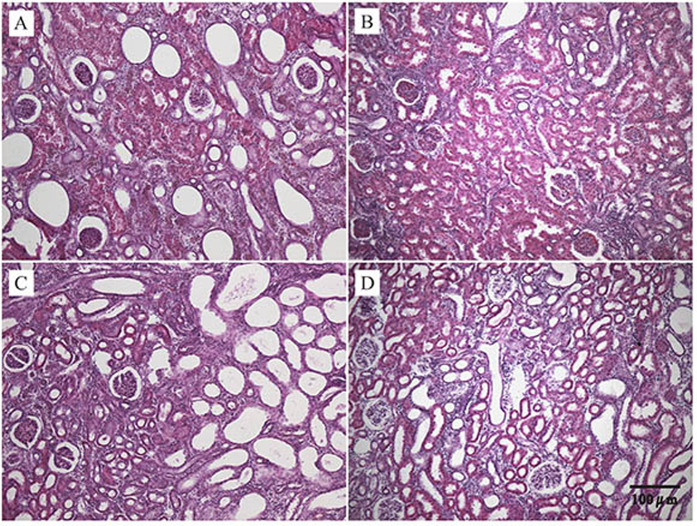
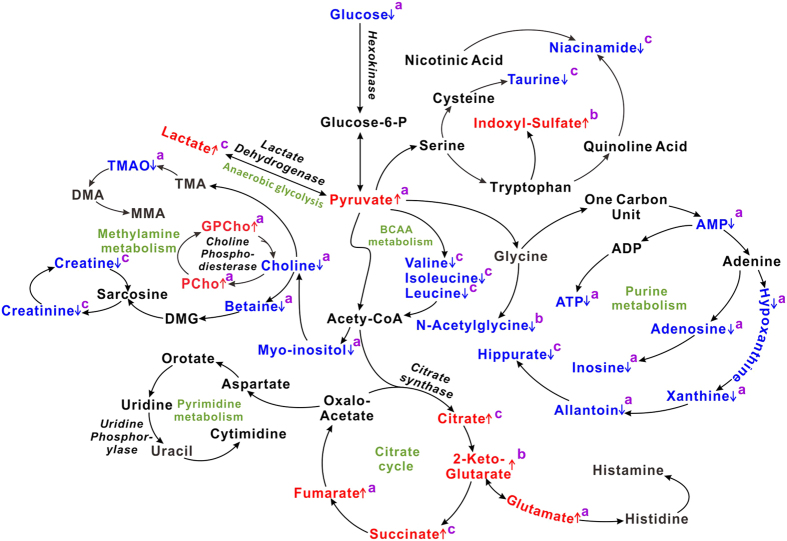
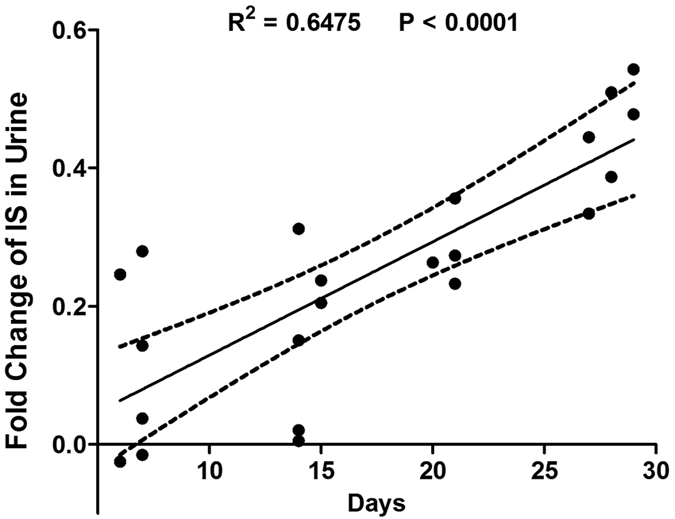
Renal fibrosis is one of the important pathways involved in end-stage renal failure. Investigating the metabolic changes in the progression of disease may enhance the understanding of its pathogenesis and therapeutic information. In this study, (1)H-nuclear magnetic resonance (NMR)-based metabonomics was firstly used to screen the metabolic changes in urine and kidney tissues of renal interstitial fibrotic rats induced by unilateral ureteral obstruction (UUO), at 7, 14, 21, and 28 days after operation, respectively. The results revealed that reduced levels of bioenergy synthesis and branched chain amino acids (BCAAs), as well as elevated levels of indoxyl sulfate (IS) are involved in metabolic alterations of renal fibrosis rats. Next, by pharmacological treatment we found that reduction of IS levels could prevent the renal fibrotic symptoms. Therefore, we suggested that urinary IS may be used as a potential biomarker for the diagnosis of renal fibrosis, and a therapeutic target for drugs. Novel attempt combining metabonomics and pharmacology was established that have ability to provide more systematic diagnostic and therapeutic information of diseases.
Figures
Similar articles
-
1H NMR-based metabonomics study on serum of renal interstitial fibrosis rats induced by unilateral ureteral obstruction.Mol Biosyst. 2012 Feb;8(2):595-601. doi: 10.1039/c1mb05311f. Epub 2011 Oct 25. Mol Biosyst. 2012. PMID: 22027911
-
Metabolomics study of renal fibrosis and intervention effects of total aglycone extracts of Scutellaria baicalensis in unilateral ureteral obstruction rats.J Ethnopharmacol. 2016 Nov 4;192:20-29. doi: 10.1016/j.jep.2016.06.014. Epub 2016 Jun 7. J Ethnopharmacol. 2016. PMID: 27286917
-
Artesunate attenuates unilateral ureteral obstruction-induced renal fibrosis by regulating the expressions of bone morphogenetic protein-7 and uterine sensitization-associated gene-1 in rats.Int Urol Nephrol. 2016 Apr;48(4):619-29. doi: 10.1007/s11255-016-1232-0. Epub 2016 Feb 10. Int Urol Nephrol. 2016. PMID: 26865179
-
Metabolomics insights into pathophysiological mechanisms of nephrology.Int Urol Nephrol. 2014 May;46(5):1025-30. doi: 10.1007/s11255-013-0600-2. Epub 2013 Nov 12. Int Urol Nephrol. 2014. PMID: 24217804 Review.
-
Metabonomics exposes metabolic biomarkers of Crohn's disease by (1)HNMR.Gastroenterol Hepatol Bed Bench. 2013;6(Suppl 1):S19-22. Gastroenterol Hepatol Bed Bench. 2013. PMID: 24834283 Free PMC article. Review.
Cited by
-
Diminished Systemic Amino Acids Metabolome and Lipid Peroxidation in Ureteropelvic Junction Obstruction (UPJO) Infants Requiring Surgery.J Clin Med. 2021 Apr 2;10(7):1467. doi: 10.3390/jcm10071467. J Clin Med. 2021. PMID: 33918213 Free PMC article.
-
Serum Metabolomic Profiling to Reveal Potential Biomarkers for the Diagnosis of Fatty Liver Hemorrhagic Syndrome in Laying Hens.Front Physiol. 2021 Feb 9;12:590638. doi: 10.3389/fphys.2021.590638. eCollection 2021. Front Physiol. 2021. PMID: 33633583 Free PMC article.
-
Traumatic Brain Injury Alters the Metabolism and Facilitates Alzheimer's Disease in a Murine Model.Mol Neurobiol. 2018 Jun;55(6):4928-4939. doi: 10.1007/s12035-017-0687-z. Epub 2017 Aug 3. Mol Neurobiol. 2018. PMID: 28776265
-
Uremic toxin indoxyl sulfate promotes proinflammatory macrophage activation by regulation of β-catenin and YAP pathways.J Mol Histol. 2021 Apr;52(2):197-205. doi: 10.1007/s10735-020-09936-y. Epub 2021 Jan 2. J Mol Histol. 2021. PMID: 33387144 Free PMC article.
-
Early detection of unilateral ureteral obstruction by desorption electrospray ionization mass spectrometry.Sci Rep. 2019 Jul 29;9(1):11007. doi: 10.1038/s41598-019-47396-x. Sci Rep. 2019. PMID: 31358807 Free PMC article.
References
-
- Neilson E. Mechanisms of disease: fibroblasts-a new look at an old problem. Nat Clin Pract Nephrol 2, 101–108 (2006). - PubMed
-
- Li X., Long Q., Cheng X. & He D. Shock wave induces biological renal damage by activating excessive inflammatory responses in rat model. Inflammation 37, 1317–1325 (2014). - PubMed
-
- Nicholson J. K., Lindon J. C. & Holmes E. ‘Metabonomics’: understanding the metabolic responses of living systems to pathophysiological stimuli via multivariate statistical analysis of biological NMR spectroscopic data. Xenobiotica 29, 1181–1189 (1999). - PubMed
Publication types
MeSH terms
Substances
LinkOut - more resources
Full Text Sources
Other Literature Sources
Medical
