. 2016 Jun 3:6:27139.
doi: 10.1038/srep27139.

Distinct mechanisms regulate Cdx2 expression in the blastocyst and in trophoblast stem cells

Affiliations

Distinct mechanisms regulate Cdx2 expression in the blastocyst and in trophoblast stem cells

Teresa Rayon et al. Sci Rep. .

Abstract

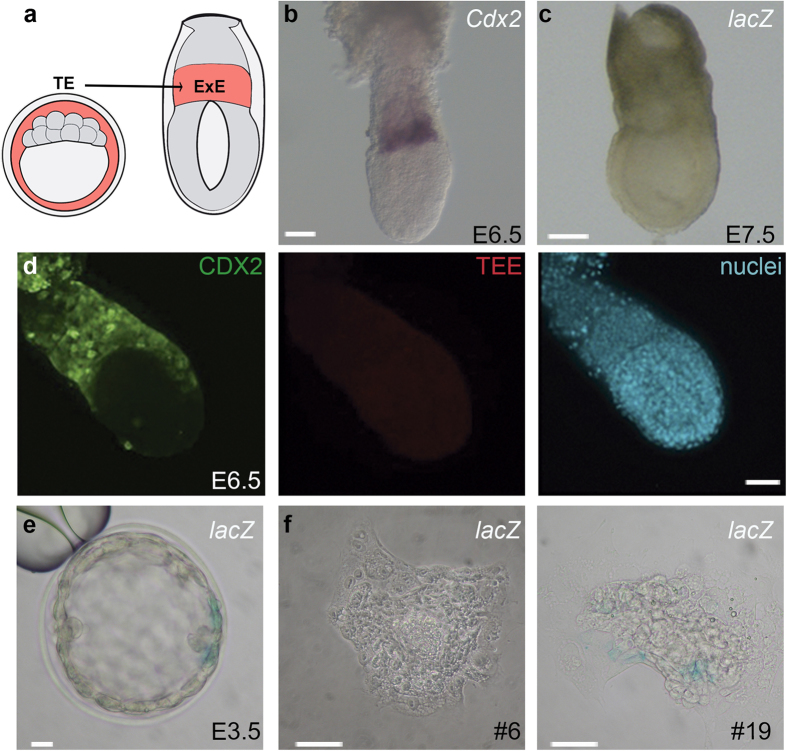
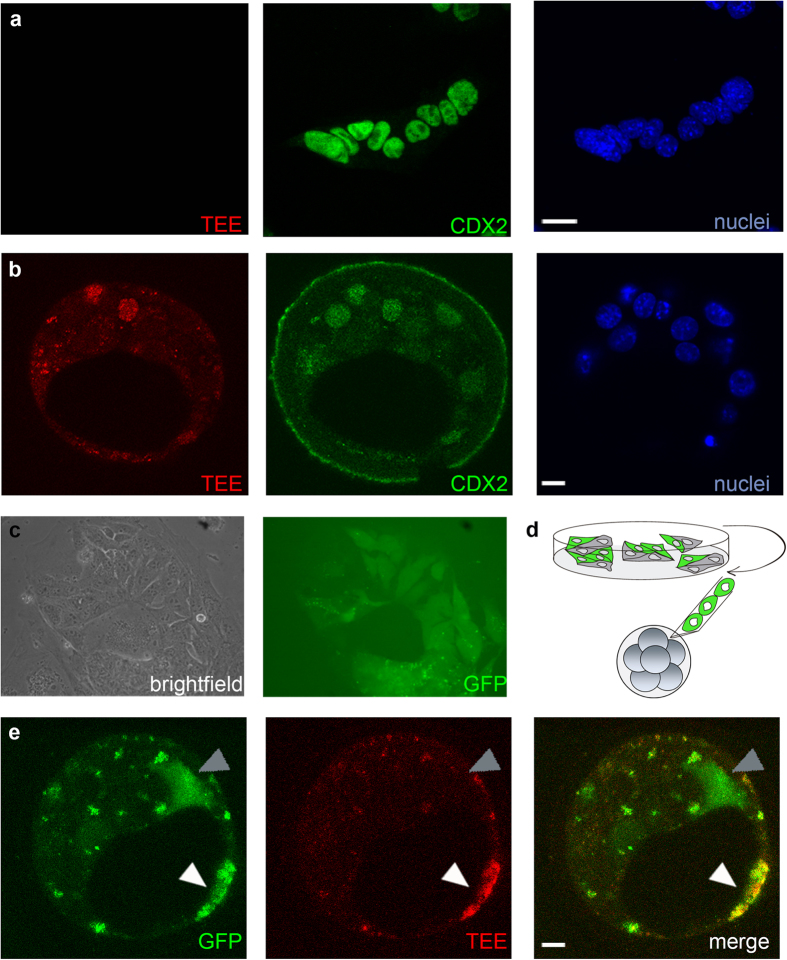
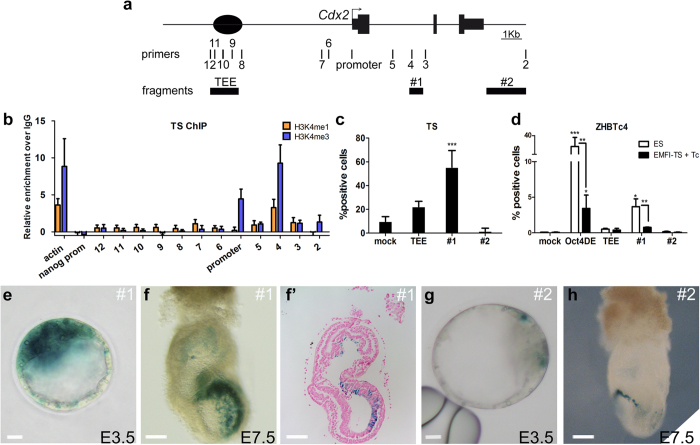
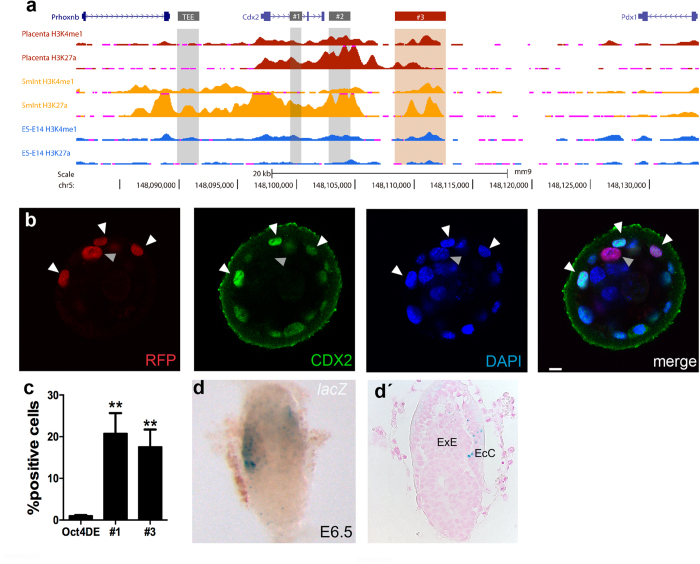
The first intercellular differences during mammalian embryogenesis arise in the blastocyst, producing the inner cell mass and the trophectoderm. The trophectoderm is the first extraembryonic tissue and does not contribute to the embryo proper, its differentiation instead forming tissues that sustain embryonic development. Crucial roles in extraembryonic differentiation have been identified for certain transcription factors, but a comprehensive picture of the regulation of this early specification is still lacking. Here, we investigated whether the regulatory mechanisms involved in Cdx2 expression in the blastocyst are also utilized in the postimplantation embryo. We analyzed an enhancer that is regulated through Hippo and Notch in the blastocyst trophectoderm, unexpectedly finding that it is inactive in the extraembryonic structures at postimplantation stages. Further analysis identified other Cdx2 regulatory elements including a stem-cell specific regulatory sequence and an element that drives reporter expression in the trophectoderm, a subset of cells in the extraembryonic region of the postimplantation embryo and in trophoblast stem cells. The cross-comparison in this study of cis-regulatory elements employed in the blastocyst, stem cell populations and the postimplantation embryo provides new insights into early mammalian development and suggests a two-step mechanism in Cdx2 regulation.


Figures

Figure 1
Figure 1. The Cdx2 TEE is inactive in the postimplantation embryo and is progressively inactivated in blastocyst outgrowths.
(a) Diagram of Cdx2 expression at blastocyst and postimplantation stages (red). (b) Expression of Cdx2 at E6.5 is limited to the extraembryonic ectoderm (ExE). (c) β-galactosidase staining in the TEE–lacZ reporter line at E6.5, showing lack of reporter activity. (d) CDX2 expression (green) and TEE activity (red) in a E7.5 embryo of the TEE-mRFP line. CDX2 and mRFP were detected by immunohistochemistry with anti-CDX2 and anti-DsRed antibodies. Nuclei are counterstained with DAPI. CDX2 is present in extraembryonic tissue, while TEE activity is absent. (e) β-galactosidase staining in the TEE-lacZ reporter line at blastocyst stage and (f) in two outgrowths of the same line (#6 and #19). Scale bar, 110 μm (bd), 10 μm (e), and 50 μm (f).
Figure 2
Figure 2. The TE-specific Cdx2 enhancer is inactive in trophoblast stem cells but is reactivated in blastocyst chimeras.
(a) TSR cells do not show TEE-driven mRFP expression. Cells were stained for mRFP (red), CDX2 (green) and DAPI (blue). Scale bar 20 μm (b) TSR cells re-express the TEE-driven mRFP reporter when injected into embryos. Embryos were stained for mRFP (red), CDX2 (green) and DAPI (blue). Scale bar 20 μm (b) GFP-infected TSR cells. The left panel shows a brightfield image. The right panel shows GFP-expressing TS cells. (d) Injection of GFP+ TSR cells into a morula. (e) GFP-infected TSR cells re-express the TEE-driven mRFP reporter in the blastocyst. Flourescent signals from expression of GFP (green) and mRFP (red). White arrowheads point to GFP+/mRFP+ TSR cells, grey arrowheads show GFP+/mRFP− TSR cells. Scale bar, 10 μm.
Figure 3
Figure 3. Activity of regulatory elements in the Cdx2 locus.
(a) Diagram of the Cdx2 locus, showing relative positions of primers selected for ChIP-qPCR (2–12) and of the selected regulatory elements. (b) Relative enrichment over IgG of H3K4me1 (orange) and H3K4me3 (blue) along the Cdx2 locus in the chromatin of TS cells; Actin promoter, positive control; Nanog promoter, negative control. Data are means ± s.e.m. n = 2. (c) TS transfection of different Cdx2 regulatory fragments. Fragments were tested for regulatory capacity, and expression was compared to level obtained with empty vector (mock). Data are means ± s.e.m. n = 3. ***p < 0.001 compared with mock (Student’s t-test). (d) Percentage of ZHBTc4 cells showing reporter expression in transient transfections upon Tc addition. Data are means ± s.e.m. n = 3: ***p < 0.001, *p < 0.05 versus mock; **p < 0.01 between cells expressing the same fragment but maintained in ES medium versus EMFI medium + Tc (Student’s t-test). (eh) lacZ reporter activity driven by fragment #1 (e,f) and fragment #2 (g,h) in transient transgenic embryos at E3.5 (e,g; scale bar 10 μm) and E7.5 (f,h). (f’) is a sagittal section of the embryo shown in (f); scale bar 110 μm.
Figure 4
Figure 4. A novel regulatory element drives Cdx2 expression in the TE, TS and a subset of extraembryonic cells.
(a) UCSC genome browser view of the Cdx2 region (mm9; chr5:148,081,494-148,134,458) showing (from top to bottom) ENCODE tracks of histone modifications for active enhancers (H3K4me1 and H3K27ac) in the placenta, small intestine and ES cells. The TEE and fragments #1 and #2 are highlighted in grey. Fragment #3 is highlighted in red. (b) mRFP (red) activity driven by fragment #3 in blastocysts, showing co-localization with CDX2 (green). Nuclei (blue) were stained with DAPI. (c) Fragment #3 is active in TS cells. Expression driven by fragments #1 and #3 were compared to Oct4DE. Data are means ± s.e.m. n = 6. **p < 0.01 (Student’s t-test). (d) LacZ reporter activity driven by fragment #3 in transient transgenic embryos. (d’) Sagittal section of the embryo shown in (c). ExE, extraembryonic ectoderm; EcC, ectoplacental canal. Scale bar, 10 μm (b), 110 μm (d,d’).

References

    1. Roper S. & Hemberger M. Defining pathways that enforce cell lineage specification in early development and stem cells. Cell Cycle 8, 1515–1525 (2009). - PubMed
    1. Yamanaka Y., Ralston A., Stephenson R. O. & Rossant J. Cell and molecular regulation of the mouse blastocyst. Dev Dyn 235, 2301–2314 (2006). - PubMed
    1. Tanaka S., Kunath T., Hadjantonakis A. K., Nagy A. & Rossant J. Promotion of trophoblast stem cell proliferation by FGF4. Science 282, 2072–2075 (1998). - PubMed
    1. Lu C. W. et al. Ras-MAPK signaling promotes trophectoderm formation from embryonic stem cells and mouse embryos. Nat Genet 40, 921–926 (2008). - PMC - PubMed
    1. Nishioka N. et al. The Hippo signaling pathway components Lats and Yap pattern Tead4 activity to distinguish mouse trophectoderm from inner cell mass. Dev Cell 16, 398–410 (2009). - PubMed

Publication types