. 2016 Jun 3:7:11703.
doi: 10.1038/ncomms11703.

Tenascin-C drives persistence of organ fibrosis

Affiliations

Tenascin-C drives persistence of organ fibrosis

Swati Bhattacharyya et al. Nat Commun. .

Abstract

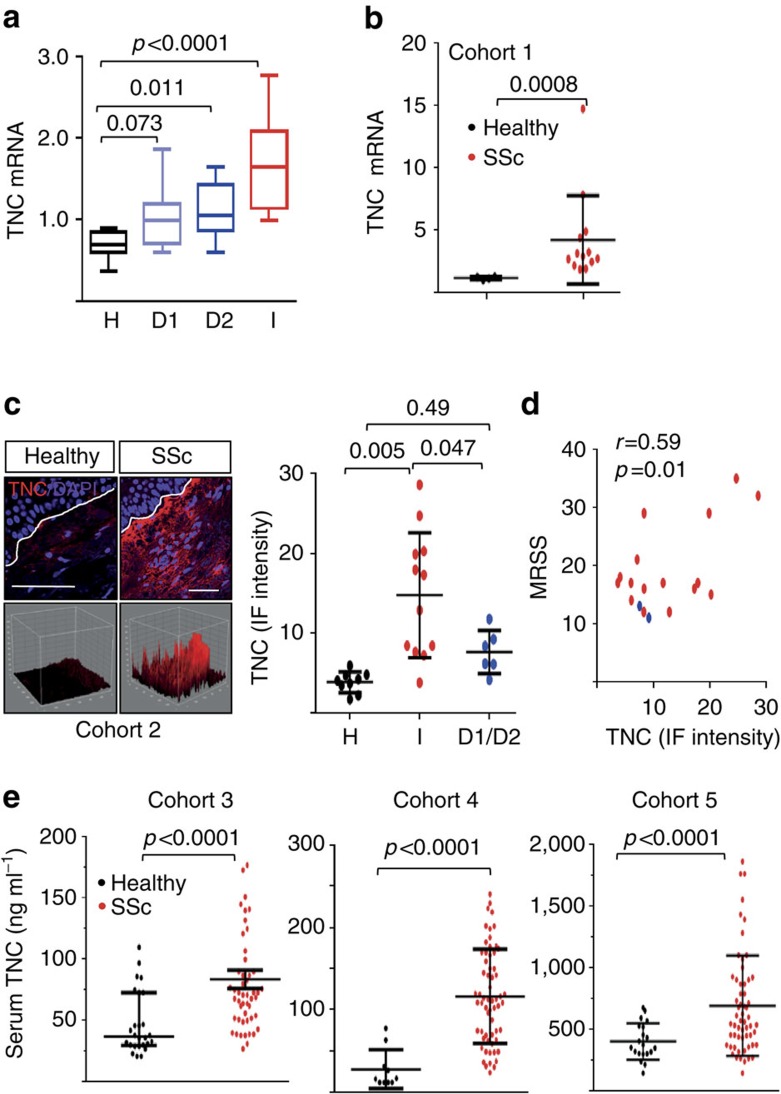
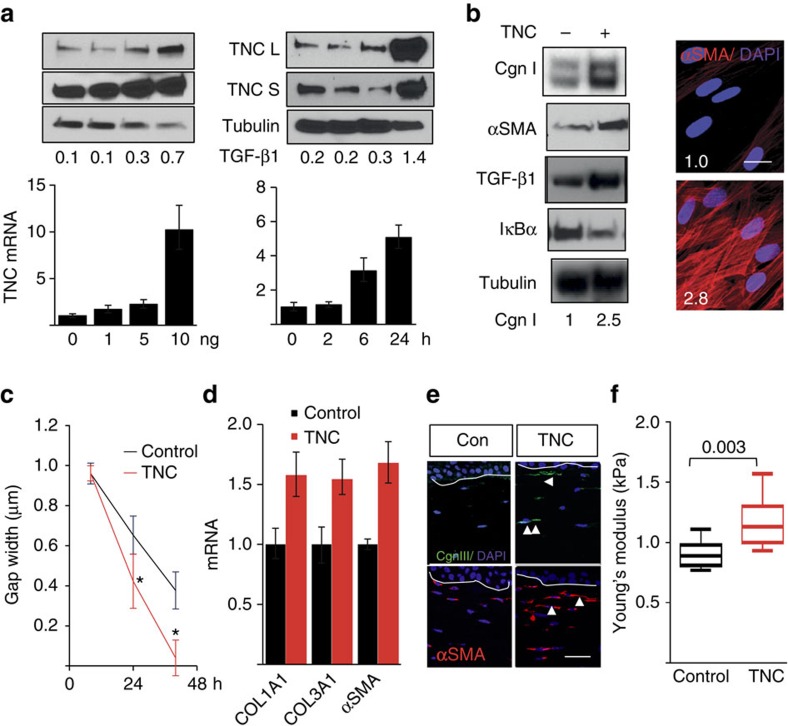
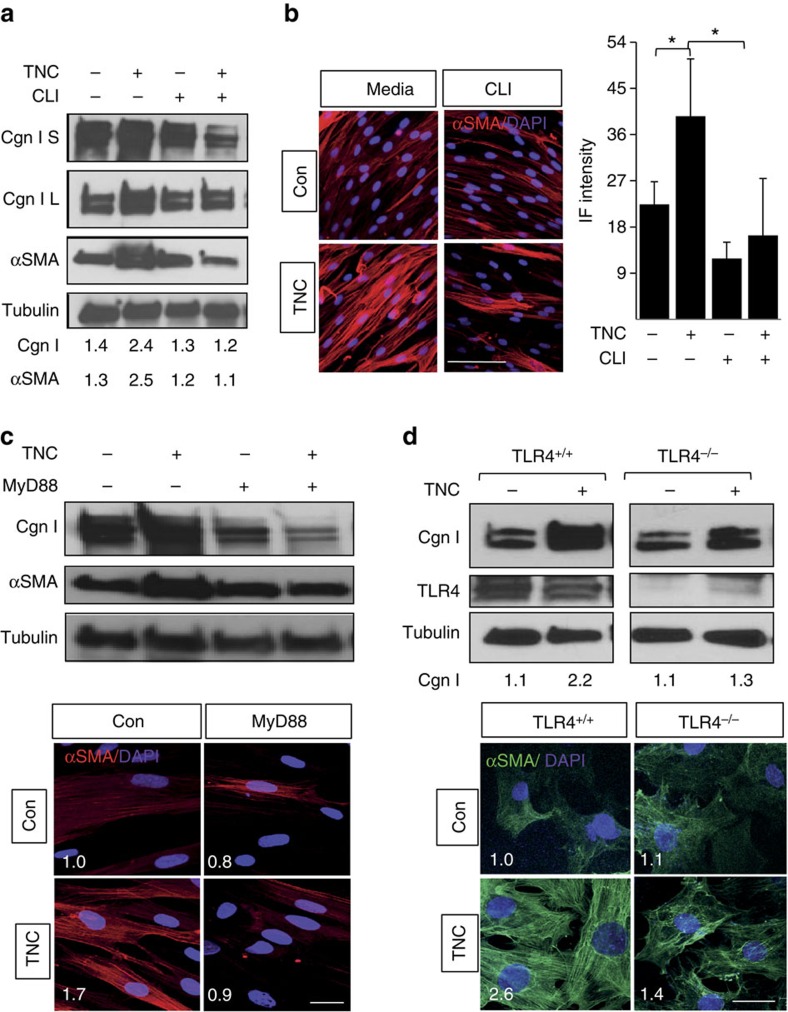
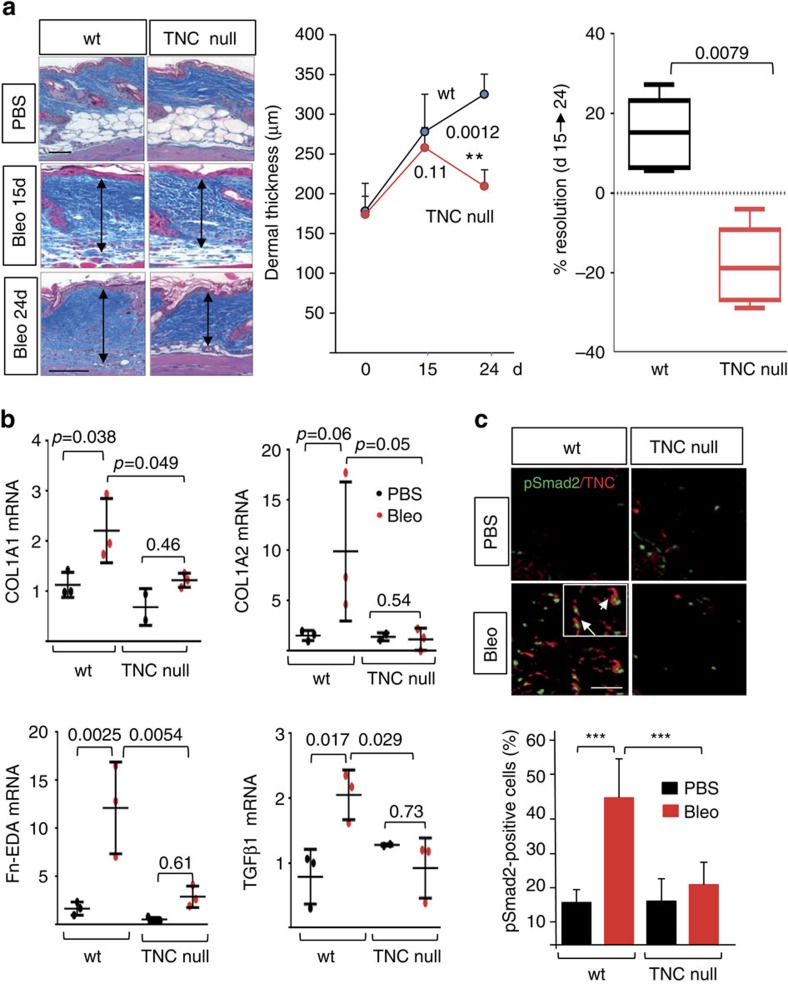
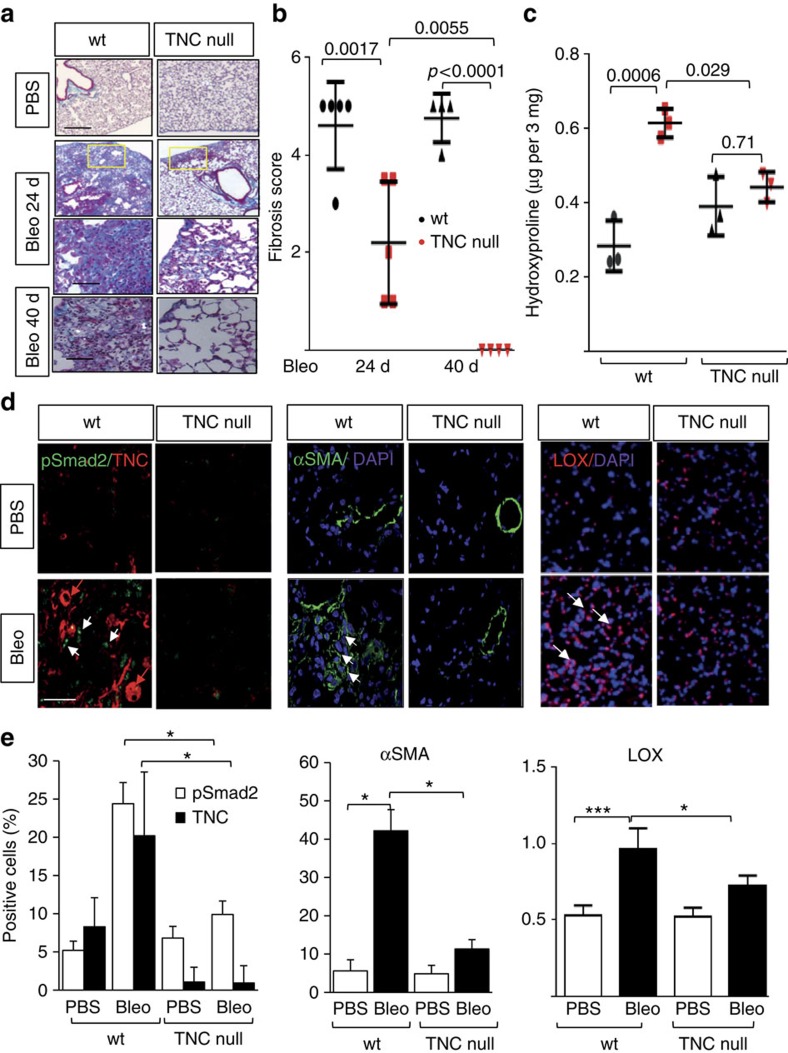
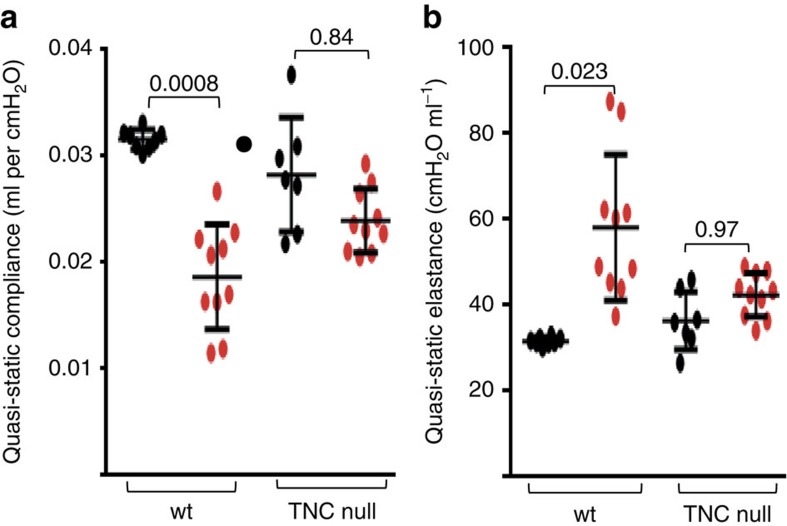
The factors responsible for maintaining persistent organ fibrosis in systemic sclerosis (SSc) are not known but emerging evidence implicates toll-like receptors (TLRs) in the pathogenesis of SSc. Here we show the expression, mechanism of action and pathogenic role of endogenous TLR activators in skin from patients with SSc, skin fibroblasts, and in mouse models of organ fibrosis. Levels of tenascin-C are elevated in SSc skin biopsy samples, and serum and SSc fibroblasts, and in fibrotic skin tissues from mice. Exogenous tenascin-C stimulates collagen gene expression and myofibroblast transformation via TLR4 signalling. Mice lacking tenascin-C show attenuation of skin and lung fibrosis, and accelerated fibrosis resolution. These results identify tenascin-C as an endogenous danger signal that is upregulated in SSc and drives TLR4-dependent fibroblast activation, and by its persistence impedes fibrosis resolution. Disrupting this fibrosis amplification loop might be a viable strategy for the treatment of SSc.


Figures

Figure 1
Figure 1. Tenascin-C is elevated in SSc.
(a) Tenascin-C (TNC) mRNA expression in SSc biopsy-derived microarray data sets (GSE32413); levels in individual intrinsic gene subsets (H, healthy controls; D1, diffuse 1; D2, diffuse 2; I, inflammatory) are shown as box plots spanning values from 25–75 percentile; horizontal lines represent median, maximum and minimum values. One-way analysis of variance (ANOVA) followed by Sidak's multiple comparison test. (b) RNA from SSc (n=14) and healthy adult (n=4) skin biopsies examined by real-time qPCR. Results, expressed relative to GAPDH, are means±s.d. of duplicate determinations. *P<0.05, Mann–Whitney U-test. (c) Immunofluorescence microscopy. SSc (n=18) and healthy control (n=9) skin biopsies were stained with antibodies to tenascin-C. Left panels, representative confocal immunofluorescence images; dotted lines indicate dermal–epidermal junction. Scale bar, 50 μm. Bottom, 3D plots. Right panel, quantitation of fluorescence intensity. Each point represents mean immunofluorescence intensity from four randomly selected h.p.f.'s in skin biopsies from healthy controls, and SSc biopsies classified as inflammatory (I), or diffuse-proliferative (D1/D2). Results, expressed, are means±s.d. of quadruplet determinations from a single subject. One-way ANOVA followed by Sidak's multiple comparison test. (d) Tissue levels of tenascin-C correlate with MRSS. Each dot is a single subject (red, early-stage SSc; blue, late-stage SSc). Pearson's correlation. (e) Circulating tenascin-C in SSc. Serum levels in Cohort 3 (50 SSc patients and 26 healthy controls), Cohort 4 (62 SSc patients and 10 healthy controls) and Cohort 5 (38 SSc patients and 12 healthy controls) determined by enzyme-linked immunosorbent assay. Each dot is the mean±s.d. of triplicate determinations from a single subject. Mann–Whitney U-test.
Figure 2
Figure 2. Regulation of tenascin-C expression and its effect on fibrotic responses.
(a,b) Confluent foreskin fibroblasts were incubated with TGF-β (10 ng ml−1 or indicated concentrations) or tenascin-C (TNC) for 24 or 72 h (b) or indicated periods. (a) Whole-cell lysates, culture media and RNA were examined by western analysis (upper panels) and qPCR (lower panel). Representative immunoblots or qPCR results (means±s.e.m. of triplicate determinations). S, secreted; L, lysates. (b) Left panel, whole-cell lysates examined by western analysis. Cgn I, type I collagen. Representative immunoblots. Band intensities, normalized for tubulin, shown below. Right panel, immunofluorescence using antibodies to αSMA (red colour). Nuclei identified by DAPI (blue colour). Scale bar, 25 μm. Immunofluorescence intensity relative to untreated controls (means from three independent experiments) shown inside panels. (c) In vitro wound-healing assays. Fibroblasts grown in the presence or absence of tenascin-C. Results are means±s.d. of triplicate determinations in three randomly selected fields. Mann–Whitney U-test. (df) 3D organotypic raft cultures constructed including or excluding tenascin-C (2 μg ml−1) were incubated for 18 days. (d) Real-time qPCR. Results, expressed relative to GAPDH, are means±s.d. of triplicate determinations from two independent experiments. (e) Immunofluorescence using antibodies for collagen III and αSMA; representative images. Arrowheads indicate immunopositive cells. Scale bar, 50 μm. (f) Stiffness of the dermal compartment determined as described under Methods. Results represent means±s.d. from three independent experiments. Mann–Whitney U-test. Con, control.
Figure 3
Figure 3. Tenascin-C-induced fibrotic responses are TLR4-dependent.
(ac) Human foreskin fibroblasts were incubated in media with tenascin-C (TNC; 2 μg ml−1) in the absence or presence of CLI-095 or MyD88 blocking peptide or scrambled controls for 72 h. (a,c,d) Whole-cell lysates analysed by western blotting. Representative immunoblots. S, secreted; L, lysates. Band intensities, normalized for tubulin, shown below. (bd) Immunofluorescence (IF) microscopy using antibodies to αSMA, and DAPI. Representative images; scale bar, 50 μm. One way analysis of variance followed by Bonferroni's multiple comparison test. (d) Skin fibroblasts isolated from mice with tamoxifen-inducible fibroblast-specific TLR4 knockout (TLR4−/−) and control mice (that is, no tamoxifen) incubated in media with tenascin-C (2 μg ml−1) for 72 h. Upper panel, representative immunoblots. Lower panels, immunofluorescence; scale bar, 25 μm. Relative fluorescence intensities represent means from four randomly selected h.p.f.'s. Con, control.
Figure 4
Figure 4. Attenuated skin fibrosis in TNC−/− mice.
Wild-type (WT) mice and TNC−/− mice in parallel received bleomycin or PBS via s.c. injections for 10 days. Lesional skin was collected at day 15 and day 24. (a) Left panels, Trichrome stain. Representative images. Scale bar, 100 μm. Arrows indicate dermis. Middle panel, dermal thickness (means±s.d. of five determinations per h.p.f. from three or five mice per group). Right panel, changes in dermal thickness comparing day 24 with 15 following initial injection. Mann–Whitney U-test. (b) mRNA levels at day 24 determined by real-time qPCR. Results, normalized with GAPDH, are means±s.d. of triplicate determinations from three mice per group. One-way analysis of variance followed by Sidak's multiple comparison test. (c) Double immunofluorescence using antibodies to phospho-Smad2 and tenascin-C. Upper panel, representative images. Scale bar, 50 μm. Inset, higher magnification; arrows indicate co-localization of tenascin-C and nuclear phospho-Smad2. Lower panel, proportion of phospho-Smad2-positive cells within the dermis determined at four randomly selected locations per h.p.f. Results are means±s.d. from three mice per group.
Figure 5
Figure 5. Attenuated lung fibrosis in TNC−/− mice.
Wild-type (WT) mice and TNC−/− mice in parallel were administered bleomycin or PBS via s.c. injections for 14 days and lungs were collected 10 or 26 days following last injection. (a) Trichrome stain for collagen. Representative images; scale bars, 100 (top two rows) and 50 μm (bottom two rows). (b) Fibrosis scores (Hubner) determined in lungs from 8 h.p.f. per mice. Results are means±s.d. from four mice per group. One-way analysis of variance (ANOVA) followed by Sidak's multiple comparison test. (c). Collagen content. Dots represent the means±s.d. from duplicate determination from three mice per group. One-way ANOVA followed by Sidak's multiple comparison test. (d) Double immunofluorescence with antibodies to phospho-Smad2, tenascin-C, αSMA and LOX. Representative images. White arrows indicate immunopositive cells. Scale bars, 50 μm. (e) Quantitation of immunopositive cells. Results are means±s.d. from four h.p.f. per mice from three mice per group. One-way ANOVA followed by Bonferroni's multiple comparison test.
Figure 6
Figure 6. Attenuated loss of lung function in TNC−/− mice.
Lung mechanics determined at day 24 following initiation of s.c. bleomycin or PBS injections. (a) Quasi-static compliance. (b) Quasi-static elastance. Results are means±s.d. from 8–10 mice per group. One-way analysis of variance followed by Sidak's multiple comparison test.

Comment in

References

    1. Rockey D. C., Bell P. D. & Hill J. A. Fibrosis—a common pathway to organ injury and failure. N. Engl. J. Med. 372, 1138–1149 (2015). - PubMed
    1. Bhattacharyya S., Wei J. & Varga J. Understanding fibrosis in systemic sclerosis: shifting paradigms, emerging opportunities. Nat. Rev. Rheumatol. 8, 42–54 (2012). - PMC - PubMed
    1. Johnson M. E. et al.. Experimentally-derived fibroblast gene signatures identify molecular pathways associated with distinct subsets of systemic sclerosis patients in three independent cohorts. PloS One 10, e0114017 (2015). - PMC - PubMed
    1. Johnson M. E., Pioli P. A. & Whitfield M. L. Gene expression profiling offers insights into the role of innate immune signaling in SSc. Semin. Immunopathol. 37, 501–509 (2015). - PMC - PubMed
    1. Piccinini A. M. & Midwood K. S. DAMPening inflammation by modulating TLR signalling. Mediators Inflamm. 2010, 1–21 (2010). - PMC - PubMed

Publication types

MeSH terms