

Quantitative modeling of gene expression using DNA shape features of binding sites
- PMID: 27257066
- PMCID: PMC5291265
- DOI: 10.1093/nar/gkw446
Quantitative modeling of gene expression using DNA shape features of binding sites
Abstract
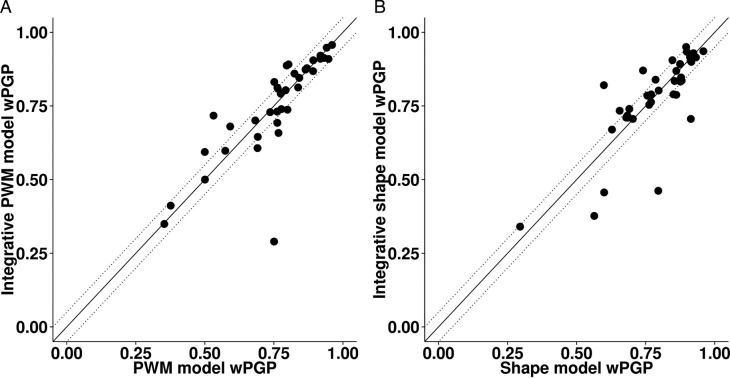
Prediction of gene expression levels driven by regulatory sequences is pivotal in genomic biology. A major focus in transcriptional regulation is sequence-to-expression modeling, which interprets the enhancer sequence based on transcription factor concentrations and DNA binding specificities and predicts precise gene expression levels in varying cellular contexts. Such models largely rely on the position weight matrix (PWM) model for DNA binding, and the effect of alternative models based on DNA shape remains unexplored. Here, we propose a statistical thermodynamics model of gene expression using DNA shape features of binding sites. We used rigorous methods to evaluate the fits of expression readouts of 37 enhancers regulating spatial gene expression patterns in Drosophila embryo, and show that DNA shape-based models perform arguably better than PWM-based models. We also observed DNA shape captures information complimentary to the PWM, in a way that is useful for expression modeling. Furthermore, we tested if combining shape and PWM-based features provides better predictions than using either binding model alone. Our work demonstrates that the increasingly popular DNA-binding models based on local DNA shape can be useful in sequence-to-expression modeling. It also provides a framework for future studies to predict gene expression better than with PWM models alone.
© The Author(s) 2016. Published by Oxford University Press on behalf of Nucleic Acids Research.
Figures
Similar articles
-
A DNA shape-based regulatory score improves position-weight matrix-based recognition of transcription factor binding sites.Bioinformatics. 2015 Nov 1;31(21):3445-50. doi: 10.1093/bioinformatics/btv391. Epub 2015 Jun 30. Bioinformatics. 2015. PMID: 26130577 Free PMC article.
-
Extraction of functional binding sites from unique regulatory regions: the Drosophila early developmental enhancers.Genome Res. 2002 Mar;12(3):470-81. doi: 10.1101/gr.212502. Genome Res. 2002. PMID: 11875036 Free PMC article.
-
Thermodynamics-based models of transcriptional regulation by enhancers: the roles of synergistic activation, cooperative binding and short-range repression.PLoS Comput Biol. 2010 Sep 16;6(9):e1000935. doi: 10.1371/journal.pcbi.1000935. PLoS Comput Biol. 2010. PMID: 20862354 Free PMC article.
-
Transcription factor-DNA binding: beyond binding site motifs.Curr Opin Genet Dev. 2017 Apr;43:110-119. doi: 10.1016/j.gde.2017.02.007. Epub 2017 Mar 27. Curr Opin Genet Dev. 2017. PMID: 28359978 Free PMC article. Review.
-
Developmental Transcriptional Enhancers: A Subtle Interplay between Accessibility and Activity: Considering Quantitative Accessibility Changes between Different Regulatory States of an Enhancer Deconvolutes the Complex Relationship between Accessibility and Activity.Bioessays. 2020 Apr;42(4):e1900188. doi: 10.1002/bies.201900188. Epub 2020 Mar 6. Bioessays. 2020. PMID: 32142172 Review.
Cited by
-
Predicting double-strand DNA breaks using epigenome marks or DNA at kilobase resolution.Genome Biol. 2018 Mar 15;19(1):34. doi: 10.1186/s13059-018-1411-7. Genome Biol. 2018. PMID: 29544533 Free PMC article.
-
Quantitative Measurement and Thermodynamic Modeling of Fused Enhancers Support a Two-Tiered Mechanism for Interpreting Regulatory DNA.Cell Rep. 2017 Oct 3;21(1):236-245. doi: 10.1016/j.celrep.2017.09.033. Cell Rep. 2017. PMID: 28978476 Free PMC article.
-
Bayesian Markov models improve the prediction of binding motifs beyond first order.NAR Genom Bioinform. 2021 Apr 20;3(2):lqab026. doi: 10.1093/nargab/lqab026. eCollection 2021 Jun. NAR Genom Bioinform. 2021. PMID: 33928244 Free PMC article.
-
A unified approach for quantifying and interpreting DNA shape readout by transcription factors.Mol Syst Biol. 2018 Feb 22;14(2):e7902. doi: 10.15252/msb.20177902. Mol Syst Biol. 2018. PMID: 29472273 Free PMC article.
-
A comprehensive review of computational prediction of genome-wide features.Brief Bioinform. 2020 Jan 17;21(1):120-134. doi: 10.1093/bib/bby110. Brief Bioinform. 2020. PMID: 30462144 Free PMC article.
References
-
- Carroll S.B., Grenier J.K., Weatherbee S.D. From DNA to diversity: molecular genetics and the evolution of animal design. Hoboken: John Wiley & Sons; 2013.
-
- Davidson E.H. The regulatory genome: gene regulatory networks in development and evolution. Cambridge: Academic Press; 2010.
Publication types
MeSH terms
Substances
Grants and funding
LinkOut - more resources
Full Text Sources
Other Literature Sources
Molecular Biology Databases
