

Mammalian metabolic rates in the hottest fish on earth
- PMID: 27257105
- PMCID: PMC4891707
- DOI: 10.1038/srep26990
Mammalian metabolic rates in the hottest fish on earth
Abstract
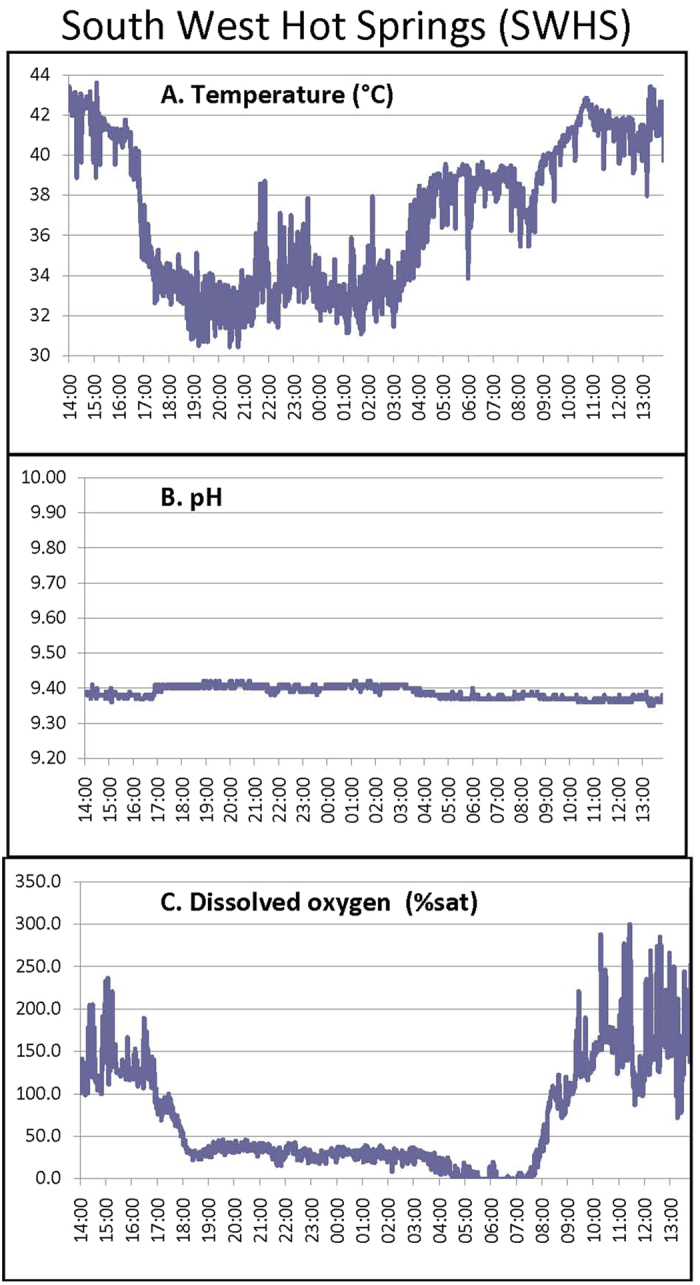
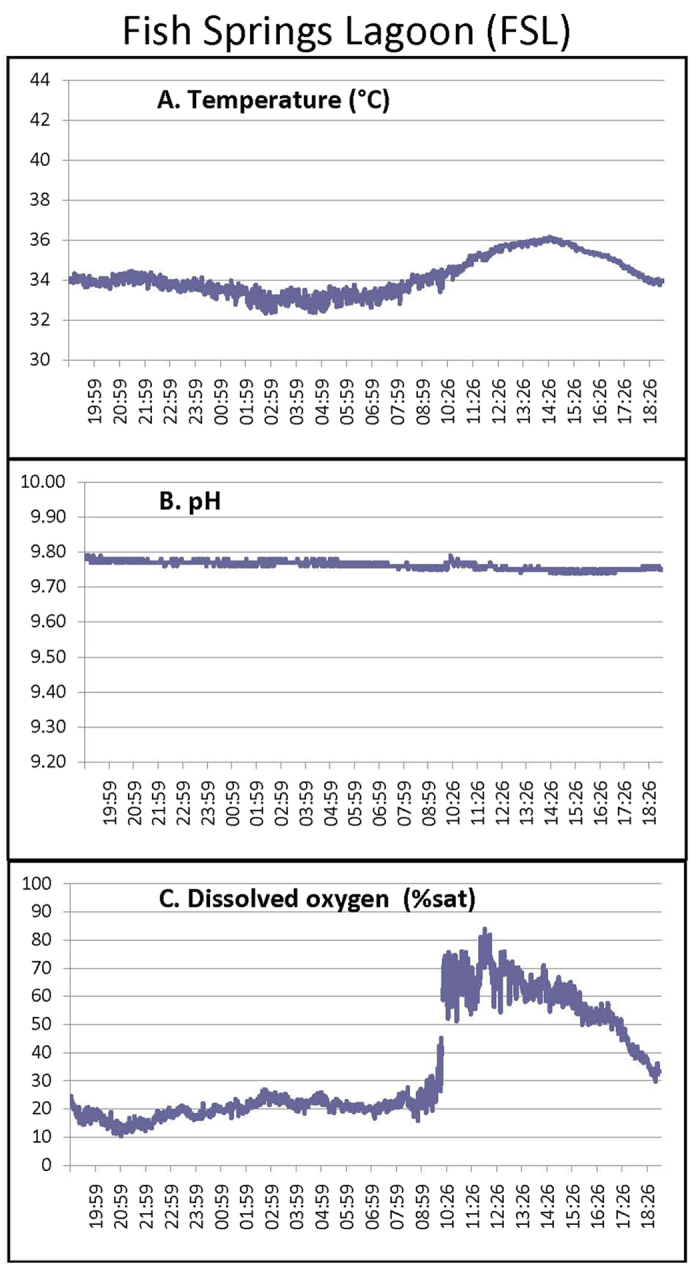
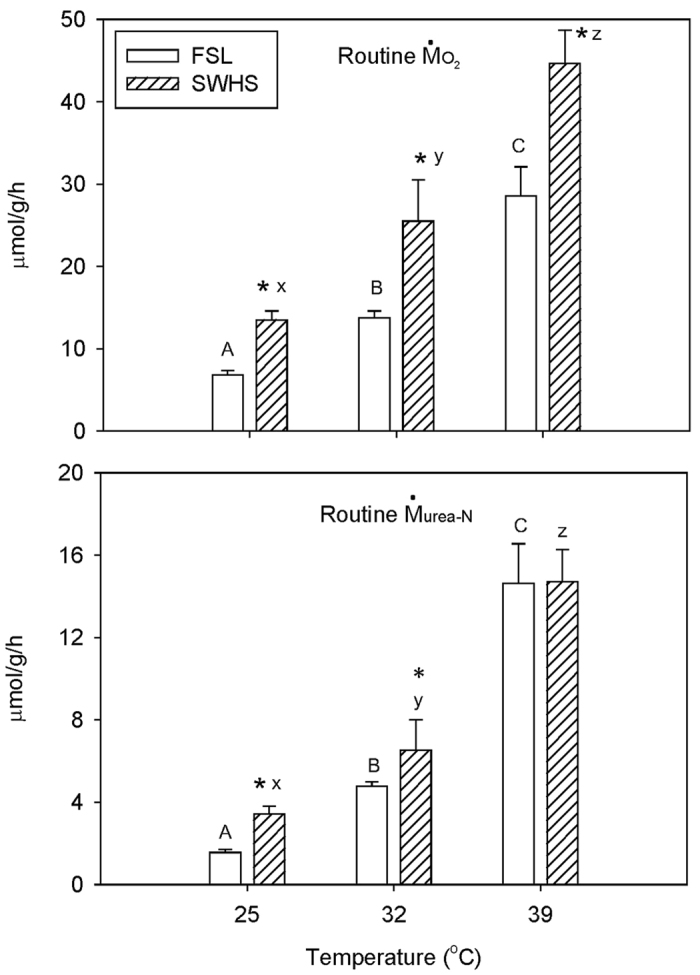
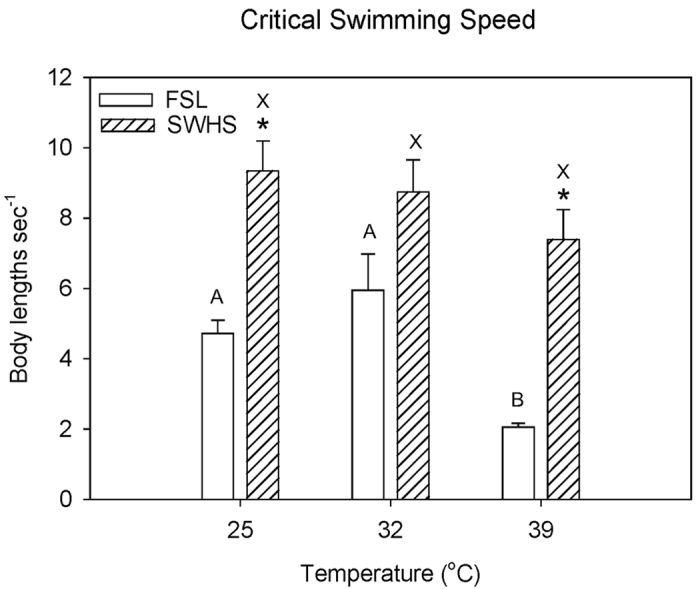
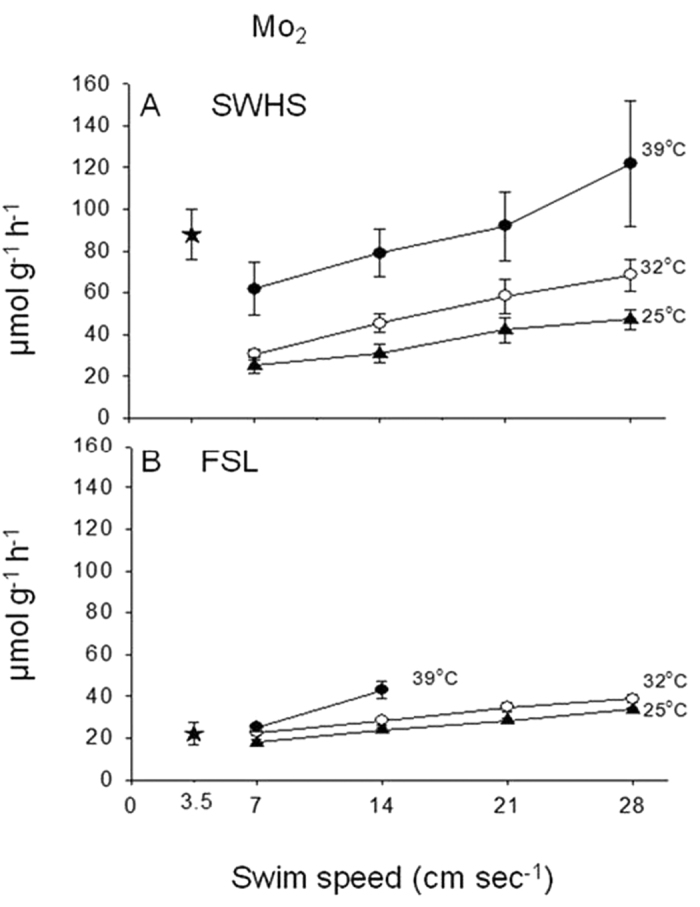
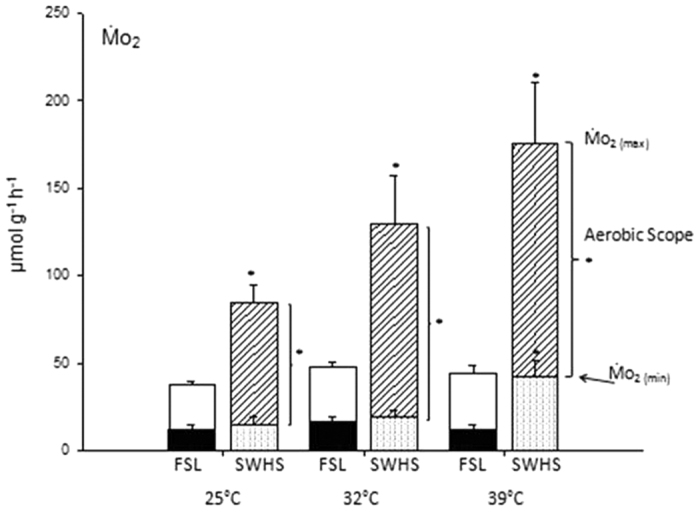
The Magadi tilapia, Alcolapia grahami, a small cichlid fish of Lake Magadi, Kenya lives in one of the most challenging aquatic environments on earth, characterized by very high alkalinity, unusual water chemistry, and extreme O2, ROS, and temperature regimes. In contrast to most fishes which live at temperatures substantially lower than the 36-40 °C of mammals and birds, an isolated population (South West Hot Springs, SWHS) of Magadi tilapia thrives in fast-flowing hotsprings with daytime highs of 43 °C and night-time lows of 32 °C. Another population (Fish Springs Lagoon, FSL) lives in a lagoon with fairly stable daily temperatures (33-36 °C). The upper critical temperatures (Ctmax) of both populations are very high; moreover the SWHS tilapia exhibit the highest Ctmax (45.6 °C) ever recorded for a fish. Routine rates of O2 consumption (MO2) measured on site, together with MO2 and swimming performance at 25, 32, and 39 °C in the laboratory, showed that the SWHS tilapia exhibited the greatest metabolic performance ever recorded in a fish. These rates were in the basal range of a small mammal of comparable size, and were all far higher than in the FSL fish. The SWHS tilapia represents a bellwether organism for global warming.
Figures
Similar articles
-
Fasting in the ureotelic Lake Magadi tilapia, Alcolapia grahami, does not reduce its high metabolic demand, increasing its vulnerability to siltation events.Conserv Physiol. 2019 Oct 31;7(1):coz060. doi: 10.1093/conphys/coz060. eCollection 2019. Conserv Physiol. 2019. PMID: 31687141 Free PMC article.
-
Obligatory urea production and the cost of living in the Magadi tilapia revealed by acclimation to reduced salinity and alkalinity.Physiol Biochem Zool. 2002 Mar-Apr;75(2):111-22. doi: 10.1086/340626. Physiol Biochem Zool. 2002. PMID: 12024287
-
Transepithelial potential in the Magadi tilapia, a fish living in extreme alkalinity.J Comp Physiol B. 2012 Feb;182(2):247-58. doi: 10.1007/s00360-011-0614-y. Epub 2011 Sep 13. J Comp Physiol B. 2012. PMID: 21912898
-
Discordance between genetic structure and morphological, ecological, and physiological adaptation in Lake Magadi tilapia.Physiol Biochem Zool. 2004 Jul-Aug;77(4):537-55. doi: 10.1086/422054. Physiol Biochem Zool. 2004. PMID: 15449226
-
Genomics of Adaptation to Multiple Concurrent Stresses: Insights from Comparative Transcriptomics of a Cichlid Fish from One of Earth's Most Extreme Environments, the Hypersaline Soda Lake Magadi in Kenya, East Africa.J Mol Evol. 2015 Oct;81(3-4):90-109. doi: 10.1007/s00239-015-9696-6. Epub 2015 Sep 7. J Mol Evol. 2015. PMID: 26345661
Cited by
-
Fasting in the ureotelic Lake Magadi tilapia, Alcolapia grahami, does not reduce its high metabolic demand, increasing its vulnerability to siltation events.Conserv Physiol. 2019 Oct 31;7(1):coz060. doi: 10.1093/conphys/coz060. eCollection 2019. Conserv Physiol. 2019. PMID: 31687141 Free PMC article.
-
Comparative Physiology of Energy Metabolism: Fishing for Endocrine Signals in the Early Vertebrate Pool.Front Endocrinol (Lausanne). 2017 Mar 2;8:36. doi: 10.3389/fendo.2017.00036. eCollection 2017. Front Endocrinol (Lausanne). 2017. PMID: 28303116 Free PMC article. Review.
-
Limits of temperature adaptation and thermopreferendum.Cell Biosci. 2021 Apr 6;11(1):69. doi: 10.1186/s13578-021-00574-9. Cell Biosci. 2021. PMID: 33823918 Free PMC article.
-
Adaptation of the carbamoyl-phosphate synthetase enzyme in an extremophile fish.R Soc Open Sci. 2020 Oct 14;7(10):201200. doi: 10.1098/rsos.201200. eCollection 2020 Oct. R Soc Open Sci. 2020. PMID: 33204476 Free PMC article.
-
Niche divergence facilitated by fine-scale ecological partitioning in a recent cichlid fish adaptive radiation.Evolution. 2016 Dec;70(12):2718-2735. doi: 10.1111/evo.13072. Epub 2016 Oct 21. Evolution. 2016. PMID: 27659769 Free PMC article.
References
-
- Coe M. J. The biology of Tilapia grahami Boulenger in Lake Magadi, Kenya. Acta Trop. 23, 146–177 (1966).
-
- Johansen K., Maloiy G. M. O. & Lykkeboe G. A fish in extreme alkalinity. Resp. Physiol. 24, 156–162 (1975). - PubMed
-
- Pörtner H. O., Schulte P. M., Wood C. M. & Schiemer F. Niche dimensions in fishes: An integrative view. Illustrating the role of physiology in understanding ecological realities. Physiol. Biochem. Zool. 83, 808–826 (2010). - PubMed
-
- Johannsson O. E. et al. Air breathing in the Lake Magadi tilapia Alcolapia grahami, under normoxic and hyperoxic conditions, and the association with sunlight and ROS. J. Fish Biol. 84, 844–863 (2014). - PubMed
-
- Wilson P. J. et al. Discordance between genetic structure and morphological, ecological, and physiological adaptation in Lake Magadi tilapia. Physiol. Biochem. Zool. 77, 537–555 (2004). - PubMed
Publication types
MeSH terms
Substances
LinkOut - more resources
Full Text Sources
Other Literature Sources
Molecular Biology Databases
