. 2016 Jun 3:7:11793.
doi: 10.1038/ncomms11793.

A two-neuron system for adaptive goal-directed decision-making in Lymnaea

Affiliations

A two-neuron system for adaptive goal-directed decision-making in Lymnaea

Michael Crossley et al. Nat Commun. .

Abstract

During goal-directed decision-making, animals must integrate information from the external environment and their internal state to maximize resource localization while minimizing energy expenditure. How this complex problem is solved by the nervous system remains poorly understood. Here, using a combined behavioural and neurophysiological approach, we demonstrate that the mollusc Lymnaea performs a sophisticated form of decision-making during food-searching behaviour, using a core system consisting of just two neuron types. The first reports the presence of food and the second encodes motivational state acting as a gain controller for adaptive behaviour in the absence of food. Using an in vitro analogue of the decision-making process, we show that the system employs an energy management strategy, switching between a low- and high-use mode depending on the outcome of the decision. Our study reveals a parsimonious mechanism that drives a complex decision-making process via regulation of levels of tonic inhibition and phasic excitation.


Figures

Figure 1
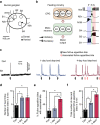
Figure 1. Decision-making in Lymnaea during food-searching behaviour.
(a) Images of Lymnaea's food-searching behaviour. (Frame 1) Animal at the water surface. (Frame 2) Appetitive bite behaviour with mouth opening and protraction of toothed radula (arrowed). (Frame 3) Retraction of radula. The same basic motor pattern is used for ingestion in the presence of food, for example, lettuce. (bd) Example traces of Lymnaea's biting behaviour in the presence and absence of food at three different levels of satiety: fed, 1-day and 4-day food deprived. Each vertical line represents a single bite. In the bottom trace of each panel, lettuce was presented at the onset of a new appetitive bite. (e) Histogram showing the number (mean±s.e.m.) of consummatory bites in 30 s after the appetitive bite in the presence of lettuce for each motivational state (one-way ANOVA, P>0.05, n=14). (f) Histogram showing the number (mean±s.e.m.) of new appetitive bites during a 30-min observation period in the absence of lettuce. One-way ANOVA, P<0.0001. Asterisks indicate significance confirmed by Tukey's tests (fed versus 1-day food deprived and fed versus 4-day food deprived, P<0.001). Tukey's tests for 1-day food deprived versus 4-day food deprived, P>0.05. (g) Histogram showing the percentage (mean±s.e.m.) of appetitive bites that had an associated bite in the absence of lettuce. One-way ANOVA, P<0.0001. Tukey's tests, 4-day food deprived versus fed and 4-day food deprived versus 1-day food deprived, P<0.001, fed versus 1-day food deprived, P>0.05. (h) Histogram showing the total number (mean±s.e.m.) of food-searching bites (new appetitive and associated appetitive bites) in the absence of lettuce. One-way ANOVA, P<0.0001. Tukey's tests, fed versus 1-day food deprived, P<0.05; fed versus 4-day food deprived, P<0.001; 1-day food deprived versus 4-day food deprived, P<0.01.
Figure 2
Figure 2. In vitro decision-making in Lymnaea.
(a) Schematic showing one of the paired buccal ganglia in Lymnaea, which contains the feeding central pattern generator (CPG) interneurons (N1M, N2v and N3t) and feeding motoneurons (B1–B4). (b) Left: schematic diagram of the synaptic connections between CPG interneurons and their drive to the motoneurons. Right: sample recordings of the CPG interneurons and three motoneurons showing their phase of firing within a single fictive feeding motor program (P, protraction; R, rasp; S, swallow). The cycle is preceded by a period of quiescence in which N3t fires tonically. The protraction phase (Fig. 1a) starts when N1M is disinhibited from N3t. N1M activity inhibits N3t, excites N2v and drives spiking in B1. Sufficient N2v depolarization initiates the rasp phase, terminating N1M activity and initiating B3 activity. N3t recovers from inhibition from N1M and N2v, and fires a burst of spikes via post-inhibitory rebound, as does B4, initiating the swallow phase. (c) Representative traces of fictive appetitive bites recorded in vitro in isolated CNS preparations from fed (n=11), 1-day food-deprived (n=12) and 4-day (n=13) food-deprived animals. The B3 spiking activity is indicative of a full CPG-driven fictive appetitive bite. (d) Histogram showing the number of new fictive appetitive bites (mean±s.e.m.) in a 5 min observation period. One-way ANOVA, P<0.05. Tukey's tests, fed versus 1-day food deprived and fed versus 4-day food deprived, P<0.05; 1-day food deprived versus 4-day food deprived, P>0.05. (e) Histogram showing the number of fictive appetitive bites (mean±s.e.m.) that had an associated fictive bite. One-way ANOVA, P<0.01. Tukey's tests, 4-day food deprived versus fed and 4-day food deprived versus 1-day food deprived, P<0.01; fed versus 1-day food deprived, P>0.05. (f) Histogram showing the total number of fictive appetitive bites (mean±s.e.m.; new fictive appetitive and associated fictive appetitive bites). One-way ANOVA, P<0.0001. Tukey's tests, fed versus 1-day food deprived, P<0.05; fed versus 4-day food deprived, P<0.001; 1-day food deprived versus 4-day food deprived P<0.01. In panels df, asterisks indicate statistical significance at at least P<0.05.
Figure 3
Figure 3. Tonic inhibitory control of feeding during quiescence.
(a) Top: schematic of N3t's monosynaptic connections with N1M and B3. Bottom left: overlaid N3t spikes and resulting 1:1 EPSPs on B3; and bottom right: N3t tonic firing during quiescence and resulting EPSPs on B3. (b,c) Electrophysiological traces and histogram (mean±s.e.m.) of N3t-driven EPSPs on B3 in CNS preparation in fed (n=11), 1-day (n=12) and 4-day (n=13) food-deprived preparations. One-way ANOVA, P<0.01. Tukey's tests, fed versus 1 day and fed versus 4 days, P<0.01 (statistical significance indicated by asterisks); 1 day versus 4 days, P>0.05.
Figure 4
Figure 4. Neural mechanisms underlying motivational-state-dependent gain control of adaptive decision-making in the absence of food.
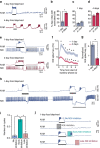
(a) N1M activation sufficiently drives a full new fictive appetitive bite in CNS preparations in 1-day (n=15) and 4-day (n=13) food-deprived preparations. Black bars represent duration of depolarizing current injection. The current injected into N1M is needed simply to be sufficient to elicit a plateau potential, which in turn drives firing independently of the amount of injected current. (b) Comparison of the percentage of fictive appetitive bites with an associated cycle. Unpaired t-test, P<0.0001. (c,d) Comparisons of the percentage of fictive (in vitro) and behavioural (in vivo) bites with an associated bite for 1-day and 4-day food-deprived. Unpaired t-test, P>0.05 in vitro versus in vivo, for both conditions. (e) Representative traces of N3t and N1M from 1-day and 4-day food-deprived preparations. Grey box shows region of N3t activity analysed. Black bars represent the duration of depolarizing current injection. (f) Mean spike frequency for each condition (shaded region=s.e.m.). N3t activity was significantly increased for 3.5 s compared with pre-cycle levels in 1-day food-deprived preparations. Repeated-measures ANOVA, P<0.0001. Dunnetts' tests, 0–0.5 to 3.0–3.5 s, P<0.001–0.01; 3.5–4.0 and 4.0–4.5 s, P>0.05 (n=9). Four-day food-deprived preparations showed no significant change in N3t activity for 1 s followed by a significant decrease. Repeated-measures ANOVA, P<0.0001. Dunnetts' tests, 0–0.5 and 0.5–1.0 s, P>0.05; 1.0–1.5 to 4.0–4.5 s, P<0.001–0.05 (n=7). (g) Comparison of N3t activity between satiety levels showing a significantly lower level in 4 days versus 1 day. Unpaired t-test, P<0.0001. (h) Artificial N3t hyperpolarization in 1-day food-deprived preparations sufficiently initiates an associated cycle (n=4). Grey bar represents the duration of hyperpolarizing current injection to N3t. (i) Analysis of number of cycles initiated after a fictive appetitive bite with early, late or no N3t disruption. Repeated-measures ANOVA, P<0.0001. Tukey's tests, no disruption versus early disruption and early versus late disruption, P<0.0001; no disruption versus late disruption, P>0.05 (n=9). Data are mean±s.e.m. (j) Representative traces of N1M during N3t disruption. Disruption initiated cycles when presented within 3.5 s after the rasp phase (third trace), but not when presented during quiescence (second trace) or outside of the 3.5 s (fourth trace). Black bars represent duration of depolarizing current injection to N1M. In b, f, g and i, asterisks indicate statistical significance.
Figure 5
Figure 5. Neural mechanism of stimulus-present decision.
(a) Sensory modality important for judgment about the presence of food during appetitive bites. Top: cartoons depict timing of application of sensory stimuli during an appetitive bite. Bottom: in the absence of food (first behavioural trace), the animal enters into quiescence. Presentation of lettuce or a tactile probe (second and fourth trace, respectively) during a bite initiates an early associated bite and further consummatory bites. Lettuce juice initiates consummatory bites with a delayed onset (third trace). (b) Average temporal dynamics of biting in response to stimuli presented during appetitive bite: lettuce (green), lettuce juice (blue) and tactile stimulus (red). Data in 3.5 s bins (n=15). (c) Comparison of the latency of the onset of the first associated bite. Repeated-measures ANOVA, P<0.0001. Tukey's tests; lettuce versus tactile stimulus, P>0.05; lettuce juice versus lettuce and lettuce juice versus tactile stimulus, P<0.001 (n=15). (d) Image of a buccal ganglion (left) indicating location of vTN (arrow). Morphology of vTN after AlexaFluor 568 dye fill (right). vTN has projections in both buccal hemiganglia and a projection into the post-buccal nerve. Scale bar, 100 μm. Morphology confirmed in n=11 cells. (e) Representative traces of the two vTN's response to tactile stimulus to the radula. vTN ipsilateral (i-) to the side of the radula touched has a larger response than the contralateral (c-) vTN. (f) Electrophysiological traces of N1M and vTN testing the effect of vTN activation on N1M-triggered fictive feeding cycles. In a fictive appetitive bite, vTN shows no spiking activity during a fictive appetitive bite and no associated cycles are generated (top trace). Artificial activation of vTN during the fictive appetitive bite initiates associated fictive feeding cycles (bottom trace). Black bars represent duration of depolarizing current injection. (g) Statistical analysis of experiments in f. Significantly more cycles are initiated in the presence of vTN activation than in its absence. Paired t-test, P<0.002 (n=13). (h) Analysis summarizing the effect of hyperpolarizing vTN on the number of associated fictive bites when a tactile stimulus was applied to the radula during a fictive appetitive bite. Hyperpolarizing vTN to prevent somatic spikes in response to tactile stimuli significantly reduced the number of associated cycles (Supplementary Fig. 6). Paired t-test, P<0.05 (n=5). All data are mean±s.e.m. In c, g and h, asterisks indicate statistical significance.
Figure 6
Figure 6. Neural correlates of energy saving during food searching and consummatory feeding.
(a) Electrophysiological traces of neurons B4, vTN and N1M in an experiment testing the impact of artificial activation of vTN (fictive stimulus present) on N1M-triggered fictive feeding. The two (left and right) sets of three co-recorded traces show examples with a fictive stimulus-absent (left) and a fictive stimulus-present (right) trial from a preparation from a 1-day food-deprived animal (n=9). Boxed areas show an expanded trace of B4 activity. B4 firing frequency in fictive stimulus-absent trials (1.7±0.5 Hz) was significantly lower versus both the first (9.7±1.1 Hz) and associated cycles (6.7±1.8 Hz) of the fictive stimulus-present trials. Repeated-measures ANOVA, P<0.001; Tukey's tests, first fictive stimulus-present cycle versus first fictive stimulus-absent cycle, P<0.001; first fictive stimulus-present associated cycle versus first fictive stimulus-absent cycle, P<0.05; the first and associated cycles of the stimulus-present trials were not significantly different (P>0.05). Black bars represent the duration of depolarizing current injection. (b) Smoothed heat plots showing B4 firing frequency in multiple trials for fictive stimulus absent (left) and fictive stimulus present (right) in 1-day food-deprived animals (n=9 independent preparations). Colour coding represents frequency. Each trial is aligned to the onset of the first N2 phase indicated by a white vertical line. (c) B4, vTN and N1M activity recorded during a fictive stimulus-absent trial in a preparation from a 4-day food-deprived animal (n=11). Boxed area shows an expanded trace of B4 activity. B4 firing frequency in the first fictive appetitive cycles (1.2±0.4 Hz) was not significantly different from that measured in the fictive stimulus-absent trials in 1-day food deprived animals (n=9). Unpaired t-test P>0.05. Black bars represent duration of depolarizing current injection into N1M. (d) Smoothed heat plots showing B4 firing frequency in multiple fictive stimulus-absent trials in 4-day food-deprived animals (n=11 independent preparations).
Figure 7
Figure 7. Parallel-independent pathways encode motivation and food presence in decision-making.
(a) Representative sets of co-recorded traces of B4, N3t, vTN and N1M in a fictive stimulus-absent (left) and a fictive stimulus-present trial (right). N3t activity was analysed post cycle in the two conditions. The grey box represents the time window of N3t activity post cycle analysed and compared with pre-cycle levels in b. Black bars represent the duration of depolarizing current injection. (b) Line plots of average N3t spike frequency in fictive stimulus-absent and fictive stimulus-present trials with shaded region showing s.e.m. N3t firing rate was measured for 5 s pre-cycle and binned into 0.5 s bins. N3t firing rates for 4.5 s post cycle were binned into 0.5-s bins. In both a and b, note the lack of direct synaptic connections between N3t and vTN.
Figure 8
Figure 8. Schematic of decision-making during food searching in Lymnaea.
On the basis of their feeding-related internal state (fed or food-deprived), Lymnaea decides whether to perform an appetitive bite. Levels of tonic inhibition on the system from the multifunctional ‘motivation-encoding' N3t interneuron determine whether a bite is initiated or not (decision mechanism 1). At low motivational levels (fed animals), tonic N3t firing rates are high (black box), preventing the expression of a new appetitive bite (‘Quiescence'). At higher motivational levels (1-day or 4-day food-deprived animals), N3t firing during quiescence decreases and a new appetitive bite is performed, driven by the activation of the CPG neuron N1M. On performing the food-searching behaviour, Lymnaea judges the presence or absence of a potential food during the appetitive bite and performs an appropriate response based on both external and internal cues. Spike activity of the ‘food-sensing' vTN signals the presence of solid food (decision mechanism 2) and triggers a bout of consummatory bites, characterized by strong motoneuronal bursting activity (B4) in the swallow phase (teal box, ‘Consummatory bites'). In the absence of potential food during the appetitive bite, vTN remains silent and a further decision is made based on the animal's motivational state (decision mechanism 3). At lower motivational levels (1-day food deprivation), Lymnaea will typically enter back into a period of quiescence (blue box, ‘New appetitive bite with no associated bite'). This is due to higher levels of in-cycle inhibition on the system from N3t. At higher motivational states (4-day food deprivation), associated appetitive bites are performed due to lower levels of in-cycle inhibition from N3t (red box, ‘New appetitive bite with associated bite'). In the absence of tactile input, both new and associated appetitive bites are characterized by low levels of B4 motoneuronal activity in the swallow phase, incorporating an energy-saving mechanism in the absence of food.
Figure 9
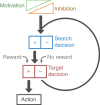
Figure 9. Generalized scheme for goal-directed decision-making.
A highly simplified cartoon schematic illustrating key principles of the decision-making pathway characterized here. The decision to search is regulated by tonic inhibition, the magnitude of which is inversely correlated with motivational drive. Search has two outcomes depending on target decision: activation of the full behavioural sequence if reward is present or a return to the search decision step if unrewarded. In this way, a motivated animal sustains a high search intensity, maximizing the chance of reward.

Similar articles

Cited by

References

    1. Gold J. I. & Shadlen M. N. The neural basis of decision making. Annu. Rev. Neurosci. 30, 535–574 (2007). - PubMed
    1. Rangel A. & Hare T. Neural computations associated with goal-directed choice. Curr. Opin. Neurobiol. 20, 262–270 (2010). - PubMed
    1. Staras K., Kemenes I., Benjamin P. R. & Kemenes G. Loss of self-inhibition is a cellular mechanism for episodic rhythmic behavior. Curr. Biol. 13, 116–124 (2003). - PubMed
    1. Pirger Z. et al.. Interneuronal mechanism for Tinbergen's hierarchical model of behavioral choice. Curr. Biol. 24, 2018–2024 (2014). - PMC - PubMed
    1. Kemenes G., Staras K. & Benjamin P. R. Multiple types of control by identified interneurons in a sensory-activated rhythmic motor pattern. J. Neurosci. 21, 2903–2911 (2001). - PMC - PubMed

Publication types