

Cortical folding of the preterm brain: a longitudinal analysis of extremely preterm born neonates using spectral matching
- PMID: 27257515
- PMCID: PMC4873564
- DOI: 10.1002/brb3.488
Cortical folding of the preterm brain: a longitudinal analysis of extremely preterm born neonates using spectral matching
Erratum in
-
Erratum: Cortical folding of the preterm brain: a longitudinal analysis of extremely preterm born neonates using spectral matching.Brain Behav. 2016 Sep 22;6(9):e00585. doi: 10.1002/brb3.585. eCollection 2016 Sep. Brain Behav. 2016. PMID: 27688947 Free PMC article.
Abstract
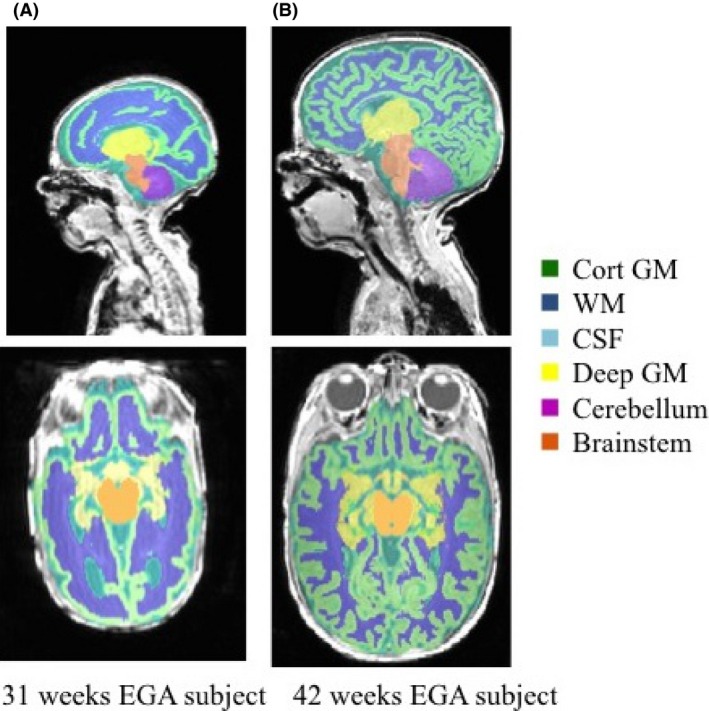
Introduction: Infants born extremely preterm (<28 weeks of gestation) are at risk of significant neurodevelopmental sequelae. In these infants birth coincides with a period of rapid brain growth and development, when the brain is also vulnerable to a range of insults. Mapping these changes is crucial for identifying potential biomarkers to predict early impairment.
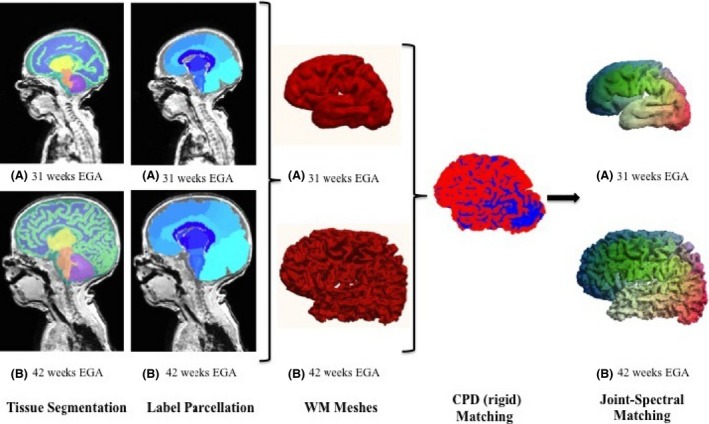
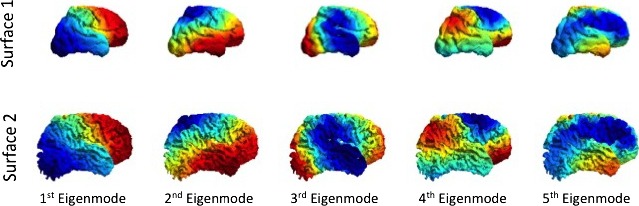
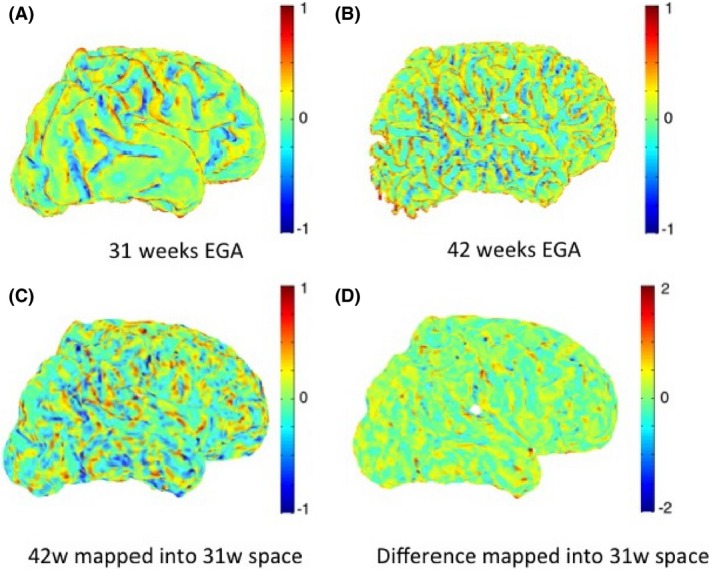
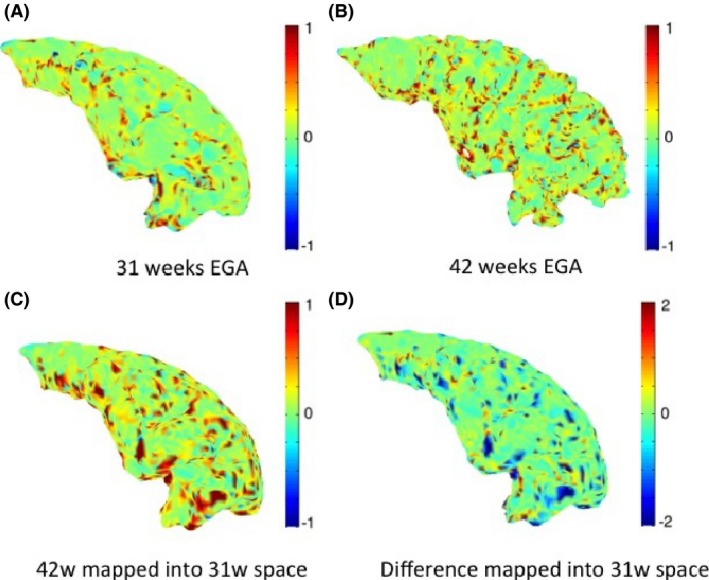
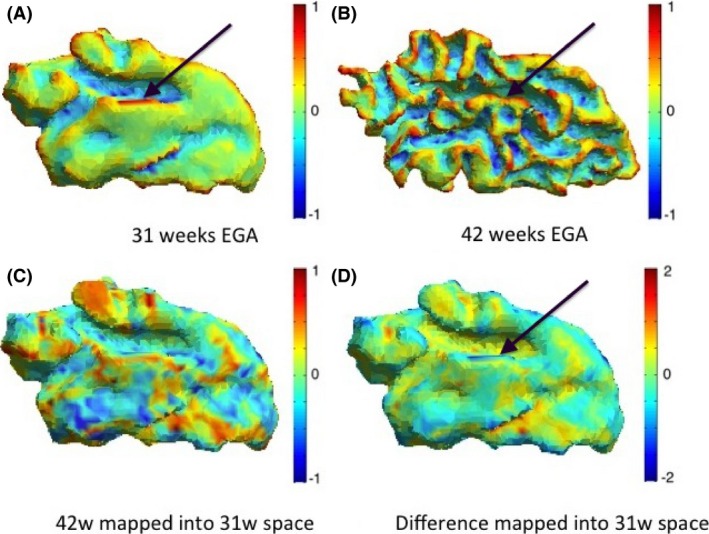
Methods: In this study we use surface-based spectral matching techniques to find an intrasubject longitudinal surface correspondence between the white-grey matter boundary at 30 and 40 weeks equivalent gestational age in nine extremely preterm born infants.
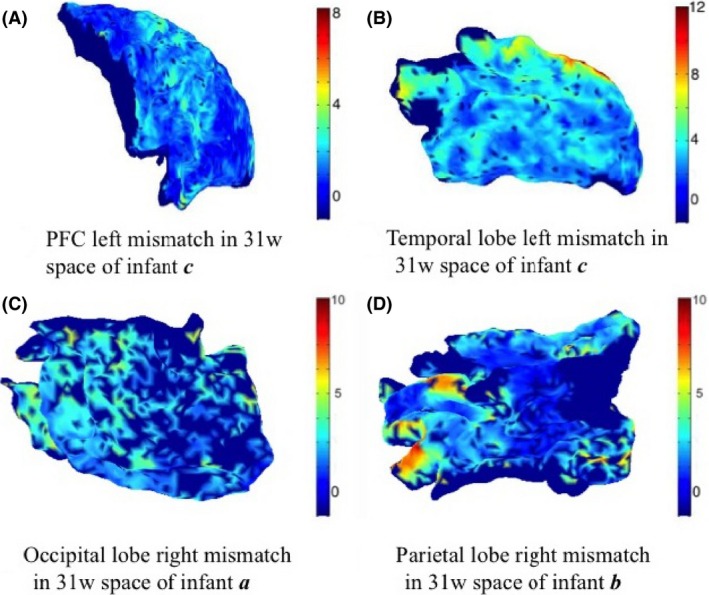
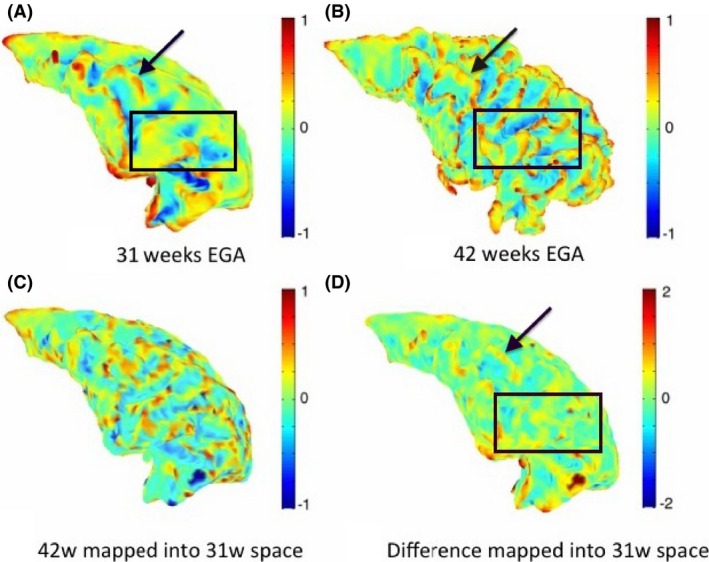
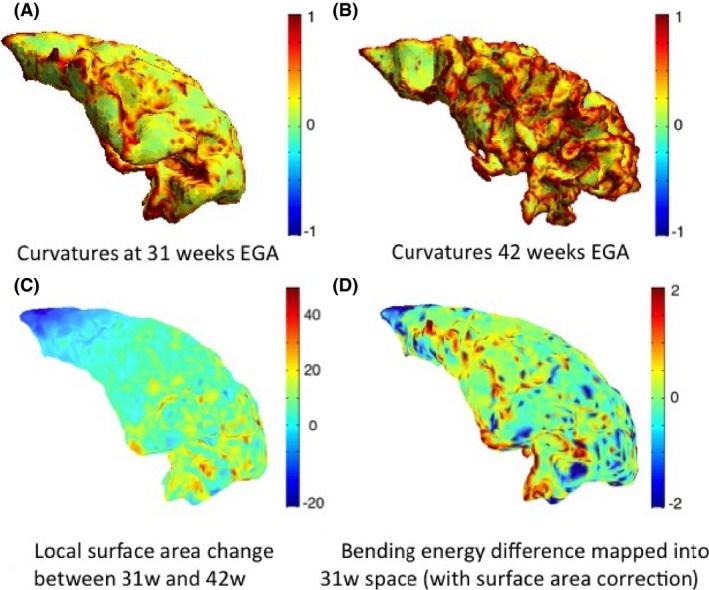
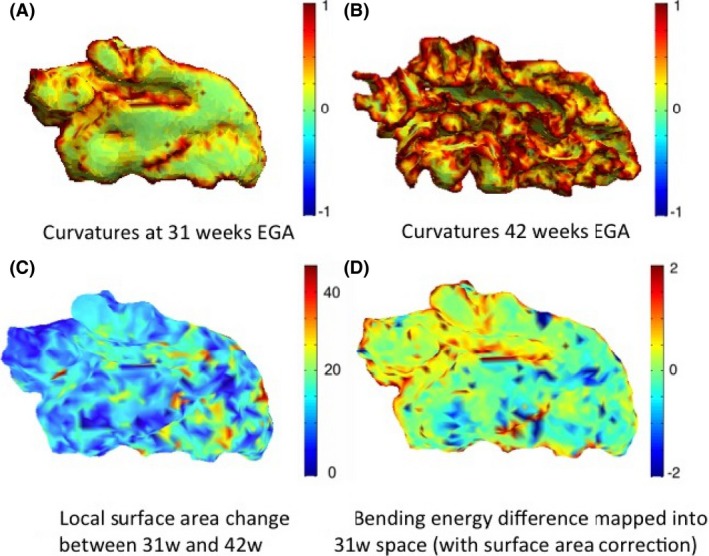
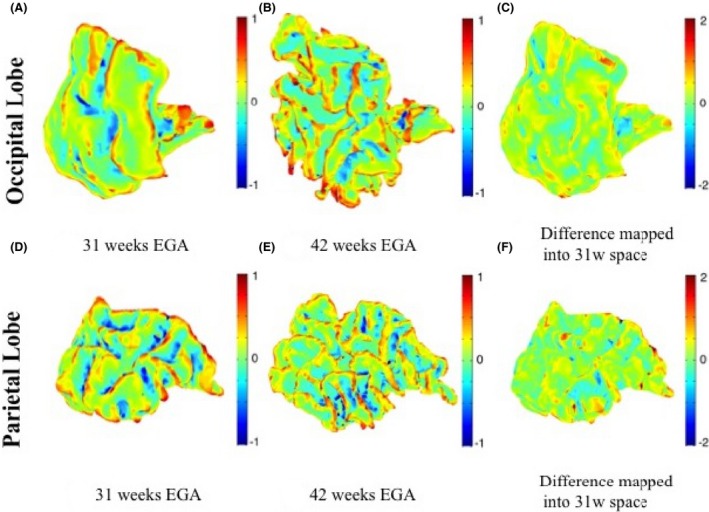
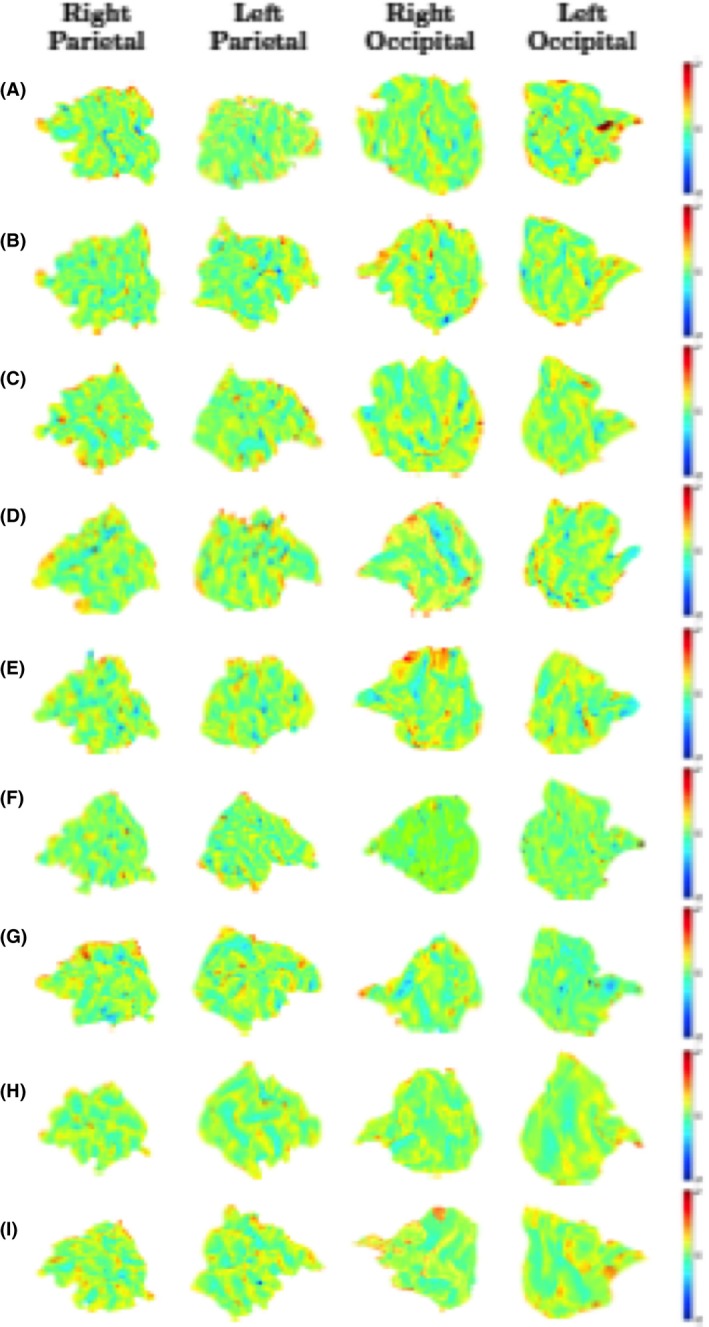
Results: Using the resulting surface correspondence, we identified regions that undergo more cortical folding of the white-grey matter boundary during the preterm period by looking at changes in well-known curvature measures. We performed Hotelling T(2) statistics to evaluate the significance of our findings.
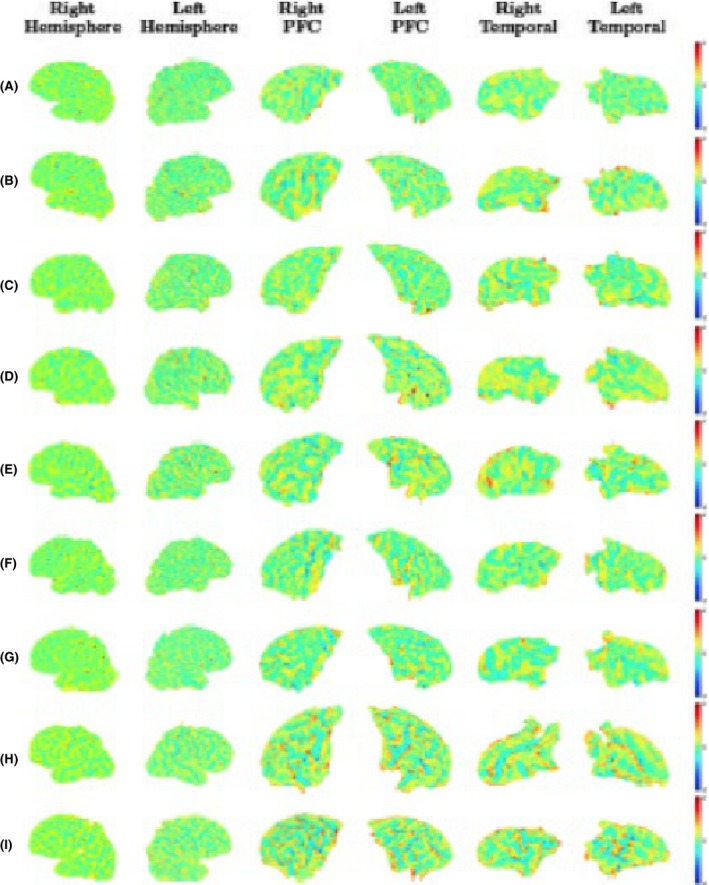
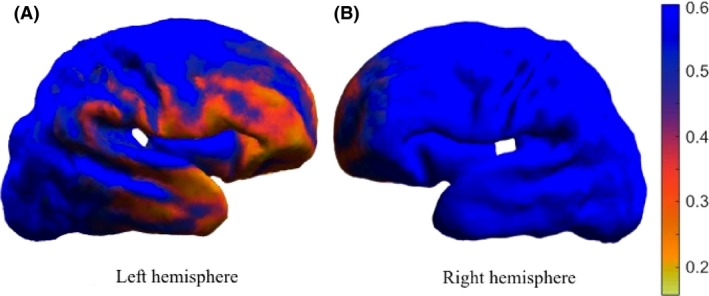
Discussion: The prefrontal and temporal lobes exhibit most development during the preterm period, especially in the left hemisphere. Such correspondences are a promising result as longitudinal measurements of change in cortical folding could provide insightful information about the mechanical properties of the underlying tissue and may be useful in inferring changes during growth and development in this vulnerable period.
Keywords: Cortex; development; registration; shape analysis; spectra.
Figures
Similar articles
-
Mapping the neuroanatomical impact of very preterm birth across childhood.Hum Brain Mapp. 2020 Mar;41(4):892-905. doi: 10.1002/hbm.24847. Epub 2019 Nov 5. Hum Brain Mapp. 2020. PMID: 31692204 Free PMC article.
-
Regional brain volumes, microstructure and neurodevelopment in moderate-late preterm children.Arch Dis Child Fetal Neonatal Ed. 2020 Nov;105(6):593-599. doi: 10.1136/archdischild-2019-317941. Epub 2020 Mar 4. Arch Dis Child Fetal Neonatal Ed. 2020. PMID: 32132139
-
Brain Growth Gains and Losses in Extremely Preterm Infants at Term.Cereb Cortex. 2015 Jul;25(7):1897-905. doi: 10.1093/cercor/bht431. Epub 2014 Jan 31. Cereb Cortex. 2015. PMID: 24488941
-
Development of Cortical Morphology Evaluated with Longitudinal MR Brain Images of Preterm Infants.PLoS One. 2015 Jul 10;10(7):e0131552. doi: 10.1371/journal.pone.0131552. eCollection 2015. PLoS One. 2015. PMID: 26161536 Free PMC article.
-
Exploring the distribution of grey and white matter brain volumes in extremely preterm children, using magnetic resonance imaging at term age and at 10 years of age.PLoS One. 2021 Nov 5;16(11):e0259717. doi: 10.1371/journal.pone.0259717. eCollection 2021. PLoS One. 2021. PMID: 34739529 Free PMC article.
Cited by
-
Assessment of longitudinal brain development using super-resolution magnetic resonance imaging following fetal surgery for open spina bifida.Ultrasound Obstet Gynecol. 2023 Nov;62(5):707-720. doi: 10.1002/uog.26244. Ultrasound Obstet Gynecol. 2023. PMID: 37161647 Free PMC article.
-
Cortical spectral matching and shape and volume analysis of the fetal brain pre- and post-fetal surgery for spina bifida: a retrospective study.Neuroradiology. 2021 Oct;63(10):1721-1734. doi: 10.1007/s00234-021-02725-8. Epub 2021 May 1. Neuroradiology. 2021. PMID: 33934181 Free PMC article.
-
Dynamic patterns of cortical expansion during folding of the preterm human brain.Proc Natl Acad Sci U S A. 2018 Mar 20;115(12):3156-3161. doi: 10.1073/pnas.1715451115. Epub 2018 Mar 5. Proc Natl Acad Sci U S A. 2018. PMID: 29507201 Free PMC article.
-
Longitudinal MRI Evaluation of Brain Development in Fetuses with Congenital Diaphragmatic Hernia around the Time of Fetal Endotracheal Occlusion.AJNR Am J Neuroradiol. 2023 Feb;44(2):205-211. doi: 10.3174/ajnr.A7760. Epub 2023 Jan 19. AJNR Am J Neuroradiol. 2023. PMID: 36657946 Free PMC article.
-
Development of cortical folds in the human brain: An attempt to review biological hypotheses, early neuroimaging investigations and functional correlates.Dev Cogn Neurosci. 2023 Jun;61:101249. doi: 10.1016/j.dcn.2023.101249. Epub 2023 Apr 25. Dev Cogn Neurosci. 2023. PMID: 37141790 Free PMC article. Review.
References
-
- Beg, M. , Miller M., Trouve A., and Younes L.. 2005. Computing large deformation metric mappings via geodesic flows of diffeomorphisms. Int. J. Comput. Vis. 61:139–157.
-
- Boardman, J. P. , Craven C., Valappil S., Counsell S. J., Dyet L. E., Rueckert D., et al. 2010. A common neonatal image phenotype predicts adverse neurodevelopmental outcome in children born preterm. NeuroImage 52:409–414. - PubMed
-
- Cardoso, M. J. , Melbourne A., Kendall G. S., Modat M., Robertson N. J., Marlow N., et al. 2013. AdaPT: an adaptive preterm segmentation algorithm for neonatal brain MRI. NeuroImage 65:97–108. - PubMed
MeSH terms
Grants and funding
LinkOut - more resources
Full Text Sources
Other Literature Sources
Medical
