. 2016 Mar 28;5(6):392-403.
doi: 10.1016/j.molmet.2016.03.004. eCollection 2016 Jun.

Triggering the adaptive immune system with commensal gut bacteria protects against insulin resistance and dysglycemia

Affiliations

Triggering the adaptive immune system with commensal gut bacteria protects against insulin resistance and dysglycemia

Céline Pomié et al. Mol Metab. .

Abstract

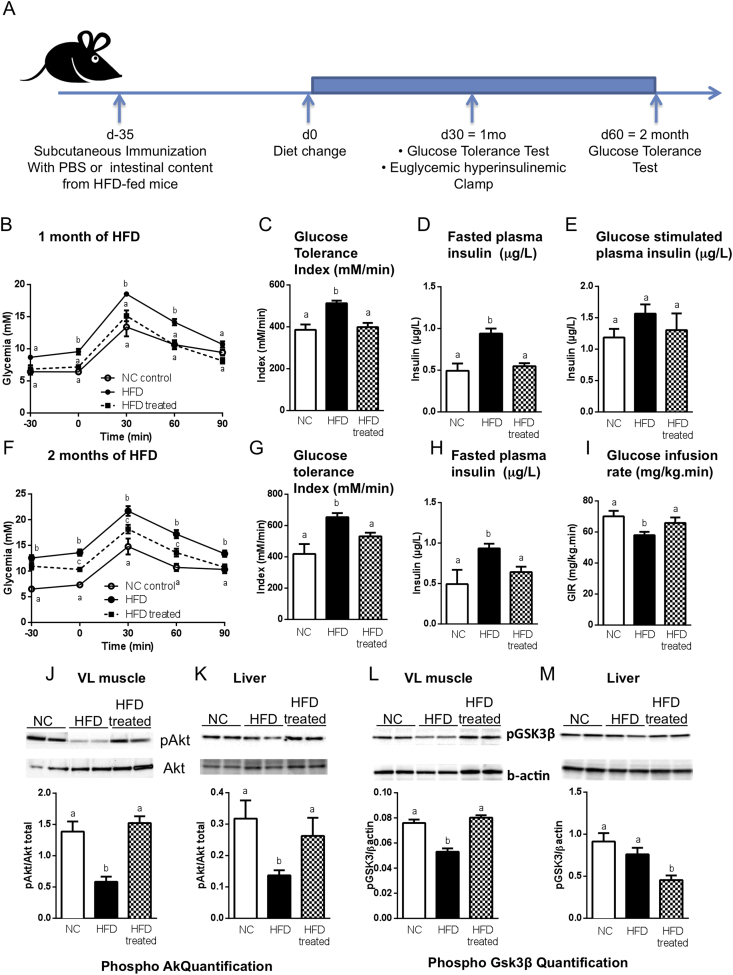
Objective: To demonstrate that glycemia and insulin resistance are controlled by a mechanism involving the adaptive immune system and gut microbiota crosstalk.

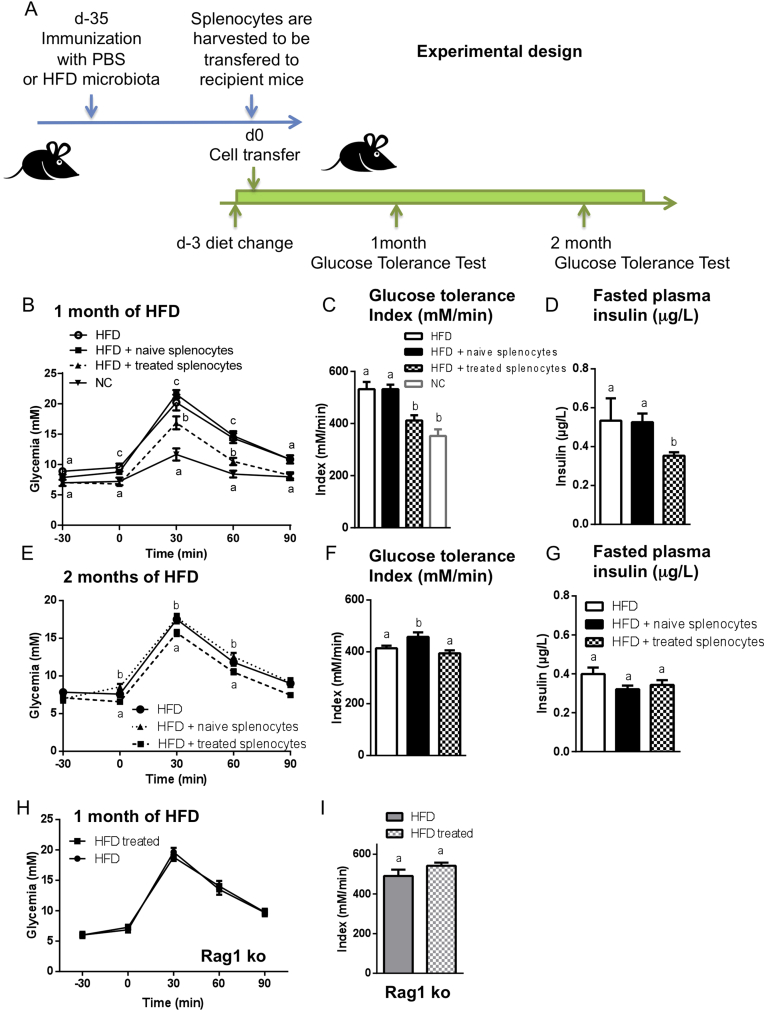
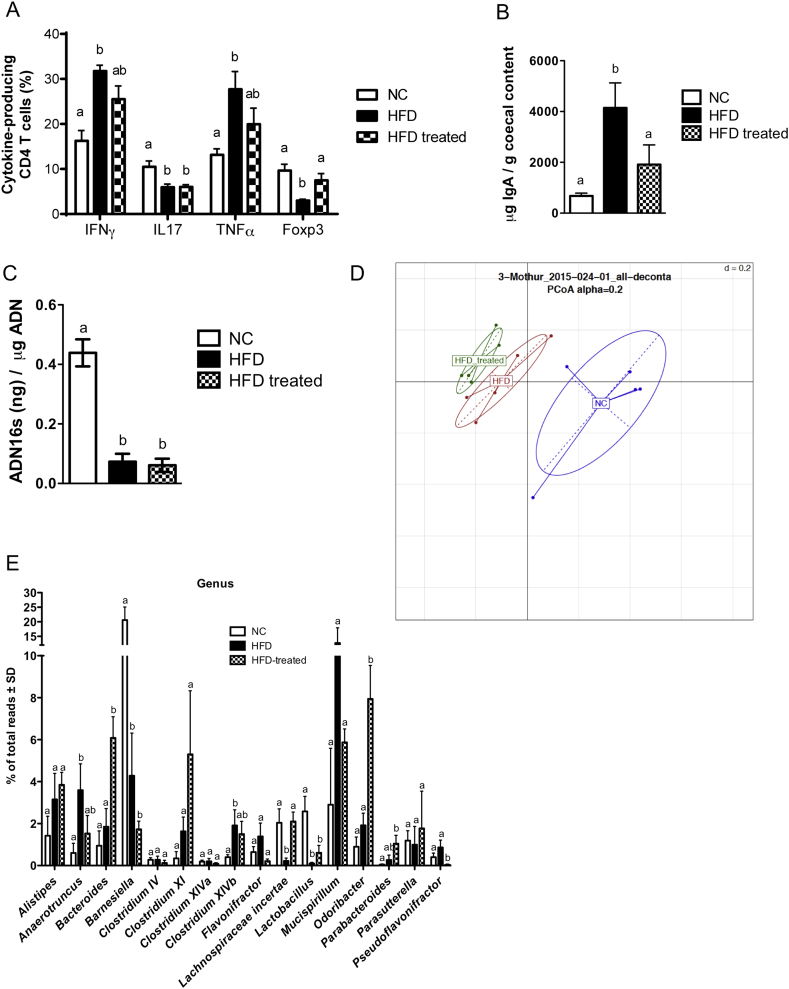
Methods: We triggered the immune system with microbial extracts specifically from the intestinal ileum contents of HFD-diabetic mice by the process of immunization. 35 days later, immunized mice were fed a HFD for up to two months in order to challenge the development of metabolic features. The immune responses were quantified. Eventually, adoptive transfer of immune cells from the microbiota-immunized mice to naïve mice was performed to demonstrate the causality of the microbiota-stimulated adaptive immune system on the development of metabolic disease. The gut microbiota of the immunized HFD-fed mice was characterized in order to demonstrate whether the manipulation of the microbiota to immune system interaction reverses the causal deleterious effect of gut microbiota dysbiosis on metabolic disease.

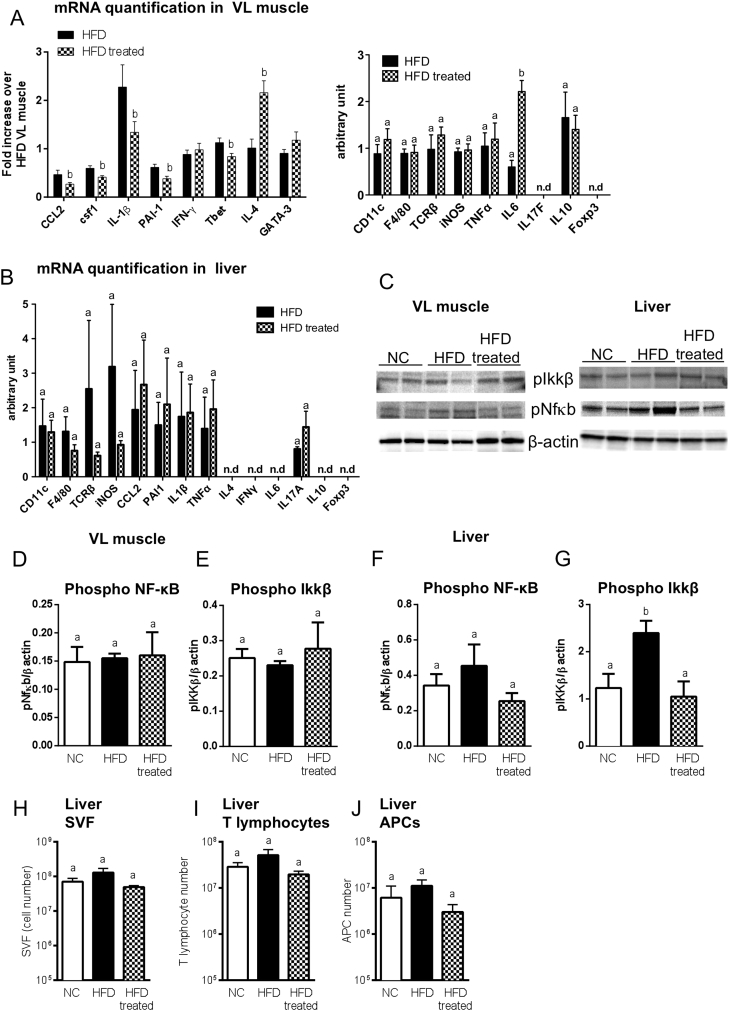
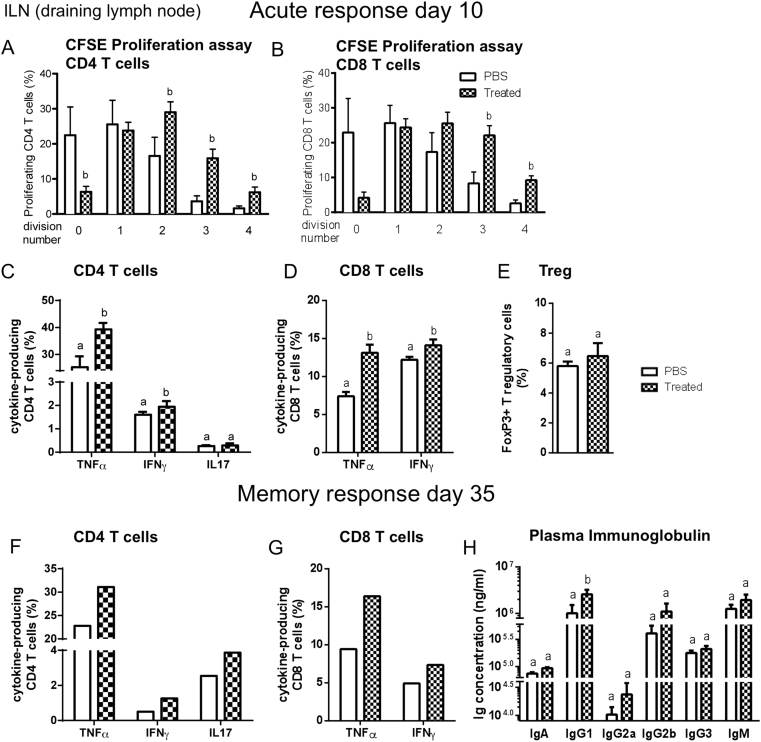
Results: Subcutaneous injection (immunization procedure) of ileum microbial extracts prevented hyperglycemia and insulin resistance in a dose-dependent manner in response to a HFD. The immunization enhanced the proliferation of CD4 and CD8 T cells in lymphoid organs, also increased cytokine production and antibody secretion. As a mechanism explaining the metabolic improvement, the immunization procedure reversed gut microbiota dysbiosis. Finally, adoptive transfer of immune cells from immunized mice improved metabolic features in response to HFD.

Conclusions: Glycemia and insulin sensitivity can be regulated by triggering the adaptive immunity to microbiota interaction. This reduces the gut microbiota dysbiosis induced by a fat-enriched diet.

Keywords: APC, Antigen presenting cells; AT, Adipose tissue; Gut microbiota and metabolic diseases; Immunity; Insulin resistance; LN, Lymph nodes; NC, Normal chow; T2D, Type 2 diabetes; VL, Vastus lateralis muscle.


Figures

Figure 1
Figure 1
Immunization with the contents of the ileum protects against HFD-induced insulin resistance and dysglycemia. C57Bl/6 mice were immunized s.c. with 200 μl of either PBS (●,ο) or the ileum contents from mice fed a high-fat diet (treated; ■). Thirty-five days later, mice were fed either normal chow (NC) or a high-fat diet (HFD) as illustrated in (A). (B–E) After one month of HFD, an intraperitoneal glucose tolerance test (ipGTT) (B) was performed and the metabolic index (C) was calculated. Fasting (D) and glucose-stimulated (E) plasma insulin concentrations were quantified (μg/l). (F–H) After two months of HFD, ipGTT (F) was performed, the metabolic index (G) was calculated and the fasting (H) plasma insulin concentration was calculated. (I) Glucose infusion rate was calculated (mg × kg−1 × min−1) by means of steady-state euglycemic (5.5 mmol/l) hyperinsulinemic clamping (18 mU × kg−1 × min−1) of mice after one month of HFD. (B–I) Data are means ± SEM. n = 6 mice/group; data show one experiment out of three. Data with similar superscript letters (a,b) indicate data non-statistically different between each other at a probability threshold p > 0.05. (J–M) Quantification of phosphorylated Akt (J,K) and phosphorylated GSK3β (L,M) in the muscle (VL) (J,L) and in the liver (K,M) after euglycemic hyperinsulinemic clamp procedure. The arbitrary units indicate the ratio of phosphorylated protein to β actin. Data are means ± SEM. n = 3–4 mice/group. Data with similar superscript letters (a,b) indicate data non-statistically different between each other at a probability threshold p > 0.05.
Figure 2
Figure 2
Immunization with the contents of the ileum decreases tissue inflammation. C57Bl/6 mice were injected s.c. either with 200 μl of PBS or with the ileum contents from mice fed a HFD (treated). 35 days later, mice were fed a HFD or NC. After one month of HFD, immune markers including proinflammatory and anti-inflammatory cytokine mRNAs were quantified from VL muscle (A) and liver (B) from non-immunized (HFD) or immunized (HFD treated) mice fed a HFD. Data are means ± SEM; n = 5–6 mice/group. Data with similar superscript letters (a,b) indicate data non-statistically different between each other at a probability threshold p > 0.05. (C) Western blotting of phosphorylated proteins in VL muscle (left) and in liver (right) after one month of HFD. Phosphorylation of NF-κB and IKKβ was quantified in the muscle (D,E) and in the liver (F,G). Data are means ± SEM. n = 3–4 mice/group. Data with similar superscript letters (a,b) indicate data non-statistically different between each other at a probability threshold p > 0.05. (H–J) Leukocytes were isolated from livers of NC mice (n = 5; NC), HFD-fed non-immunized mice (n = 8; HFD) and HFD-fed immunized mice (n = 7; HFD treated). Cell numbers were determined in (H). (I) T lymphocytes (CD45 + TCRβ+) and (J) APCs (CD45 + CD19-MHCII+) number were determined by flow cytometry. Data are means ± SEM. Data with similar superscript letters (a,b) indicate data non-statistically different between each other at a probability threshold p > 0.05.
Figure 3
Figure 3
Immunization with the contents of the ileum increases T cell responses. Mice were injected s.c. with PBS or with the ileum contents from mice fed a HFD (treated). (A–E) 10 days later, draining (inguinal) LN cells were labeled with CFSE to assess T cell proliferation during stimulation with plate-bound anti-CD3/CD28 for 3 days. The percentage of CD4 (A) or CD8 (B) T cells in the population was determined at each round of division. (C–E) The functionality of T cells was measured by ex vivo stimulation of LN cells. The percentage of CD4 (C) and CD8 (D) T cells producing IFNγ, TNFα, IL17 in response to stimulation was determined. (E) The percentage of Foxp3+ Tregs among total lymphocytes in draining LNs. (A–E) Data are means ± SEM; n = 6 mice per group. (F–G) 35 days after immunization, the proportions of CD4 (F) and CD8 (G) T cells producing cytokines (IFNγ, TNFα, IL17) were quantified following ex vivo stimulation of inguinal LN cells from mice injected with PBS or ileum contents (Treated) (n = 8 mice pooled per group, one experiment representative of two). (H) Concentrations of IgA, IgG and IgM (ng/ml) in the plasma from mice injected with PBS or ileum contents as in parts (F) and (G). Data are means ± SEM; n = 6 mice per group. Data with similar superscript letters (a,b) indicate data non-statistically different between each other at a probability threshold p > 0.05.
Figure 4
Figure 4
Adoptive transfer of immune cells protects against HFD-induced insulin resistance and dysglycemia. (A–G) 3 × 107 splenocytes from CD45.1 mice injected with PBS (■; naive splenocytes) or with the ileum contents from mice fed HFD (▲; treated splenocytes) were transferred into CD45.2 naïve recipients fed HFD, as summarized in (A). (B,E) Intraperitoneal GTTs were performed after one month (B) and two months (E) of HFD. Glucose tolerance indices were calculated (C,F). (D,G) Fasting plasma insulin was quantified (μg/ml). Data are means ± SEM; n = 8 mice per group. Data with similar superscript letters (a,b) indicate data non-statistically different between each other at a probability threshold p > 0.05. (H,I) Rag1-deficient mice (Rag1 ko) were injected s.c. with 200 μl of PBS (●) or with the ileum contents from mice fed the HFD (HFD treated; ■). Thirty-five days later, the mice were fed HFD. After one month of HFD, an intraperitoneal GTT (H) was performed and the glucose tolerance index (I) was calculated. Data are means ± SEM. n = 5 mice/group. Data with similar superscript letters (a,b) indicate data non-statistically different between each other at a probability threshold p > 0.05. The experiment was performed twice.
Figure 5
Figure 5
Immunization with ileum content modifies intestinal immunity and ileum microbiota. C57Bl/6 mice were immunized s.c. with 200 μl of either PBS or the ileum contents of mice fed HFD (treated). Thirty-five days later, mice were fed either NC or HFD as illustrated in (Figure 1A). (A) After one month of HFD, SILP leukocytes (CD4 + TCRβ + CD45+ cells) from mice fed NC, HFD or HFD treated mice were analyzed by flow cytometry. Proportion of IFNγ, TNFα and IL17-producing CD4 T cells upon stimulation and Foxp3 CD4 T cells. Graphs show mean ± SEM; n = 5 mice per group, one experiment representative of two. Data with similar superscript letters (a,b) indicate data non-statistically different between each other at a probability threshold p > 0.05. (B) After one month of HFD, IgA concentration was measured in cecum contents from mice fed NC, HFD or from HFD treated mice, by ELISA. Graphs show mean ± SEM; n = 5 mice per group. Data with similar superscript letters (a,b) indicate data non-statistically different between each other at a probability threshold p > 0.05. (C–E) Quantification and characterization of the microbial composition of ileum mucosa of NC, HFD and HFD treated mice. (C) 16S rDNA concentration. (D) 16S rRNA-DNA gene sequencing analysis of the ileum mucosa microbiota. Principal Coordinate Analysis (PCoA); (E) Frequency of major bacterial genera in NC, HFD or HFD treated mice obtained from ileum mucosa 16s rRNA-DNA gene sequencing analysis. Graphs show mean ± SEM; n = 5 mice/group; Data with similar superscript letters (a,b) indicate data non-statistically different between each other at a probability threshold p > 0.05.

Comment in

References

    1. Qin J., Li Y., Cai Z., Li S., Zhu J., Zhang F. A metagenome-wide association study of gut microbiota in type 2 diabetes. Nature. 2012;490:55–60. - PubMed
    1. Ley R.E., Turnbaugh P.J., Klein S., Gordon J.I. Human gut microbes associated with obesity. Nature. 2006;444:1022–1023. - PubMed
    1. Velagapudi V.R., Hezaveh R., Reigstad C.S., Gopalacharyulu P., Yetukuri L., Islam S. The gut microbiota modulates host energy and lipid metabolism in mice. Journal of Lipid Research. 2010;51:1101–1112. - PMC - PubMed
    1. Turnbaugh P.J., Ley R.E., Mahowald M.A., Magrini V., Mardis E.R., Gordon J.I. An obesity-associated gut microbiome with increased capacity for energy harvest. Nature. 2006;444:1027–1031. - PubMed
    1. Garidou L., Pomie C., Klopp P., Waget A., Charpentier J., Aloulou M. The gut microbiota regulates intestinal CD4 T cells expressing RORgammat and controls metabolic disease. Cell Metabolism. 2015;22:100–112. - PubMed

LinkOut - more resources