. 2016 Apr 11;5(6):422-432.
doi: 10.1016/j.molmet.2016.04.001. eCollection 2016 Jun.

Raptor/mTORC1 loss in adipocytes causes progressive lipodystrophy and fatty liver disease

Affiliations

Raptor/mTORC1 loss in adipocytes causes progressive lipodystrophy and fatty liver disease

Peter L Lee et al. Mol Metab. .

Abstract

Objective: Normal adipose tissue growth and function is critical to maintaining metabolic homeostasis and its excess (e.g. obesity) or absence (e.g. lipodystrophy) is associated with severe metabolic disease. The goal of this study was to understand the mechanisms maintaining healthy adipose tissue growth and function.

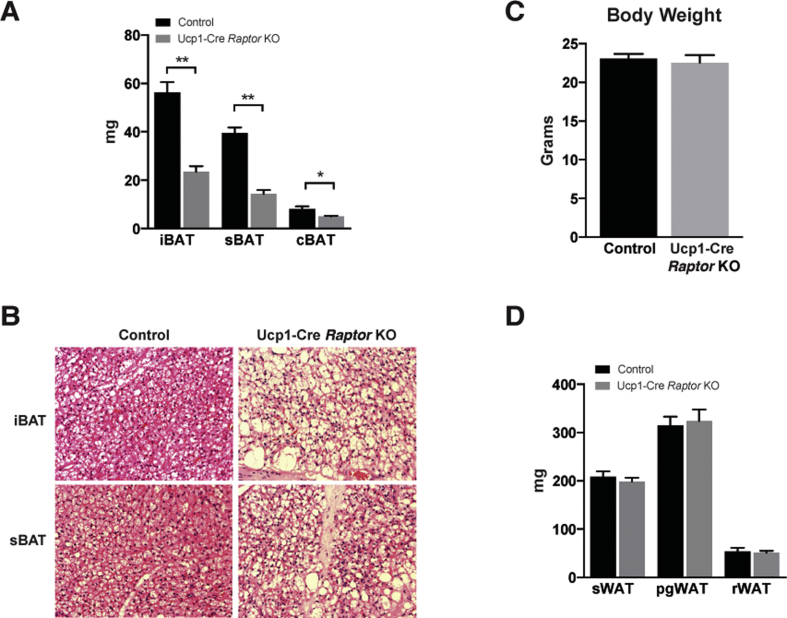
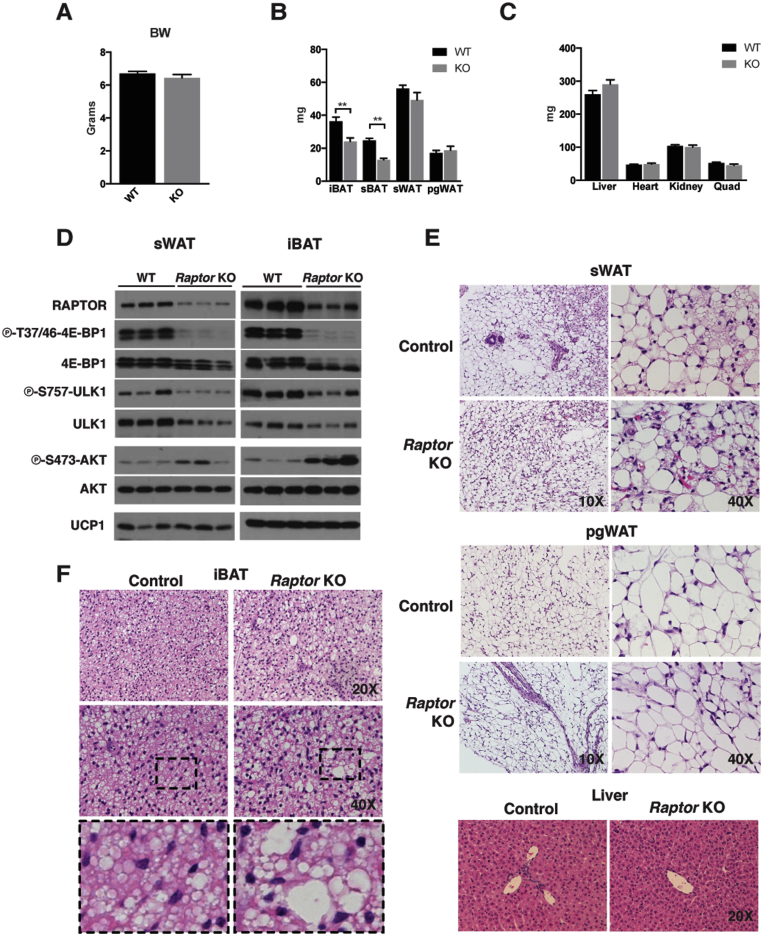
Methods: Adipose tissue senses and responds to systemic changes in growth factor and nutrient availability; in cells mTORC1 regulates metabolism in response to growth factors and nutrients. Thus, mTORC1 is poised to be a critical intracellular regulator of adipocyte metabolism. Here, we investigate the role of mTORC1 in mature adipocytes by generating and characterizing mice in which the Adiponectin-Cre driver is used to delete floxed alleles of Raptor, which encodes an essential regulatory subunit of mTORC1.

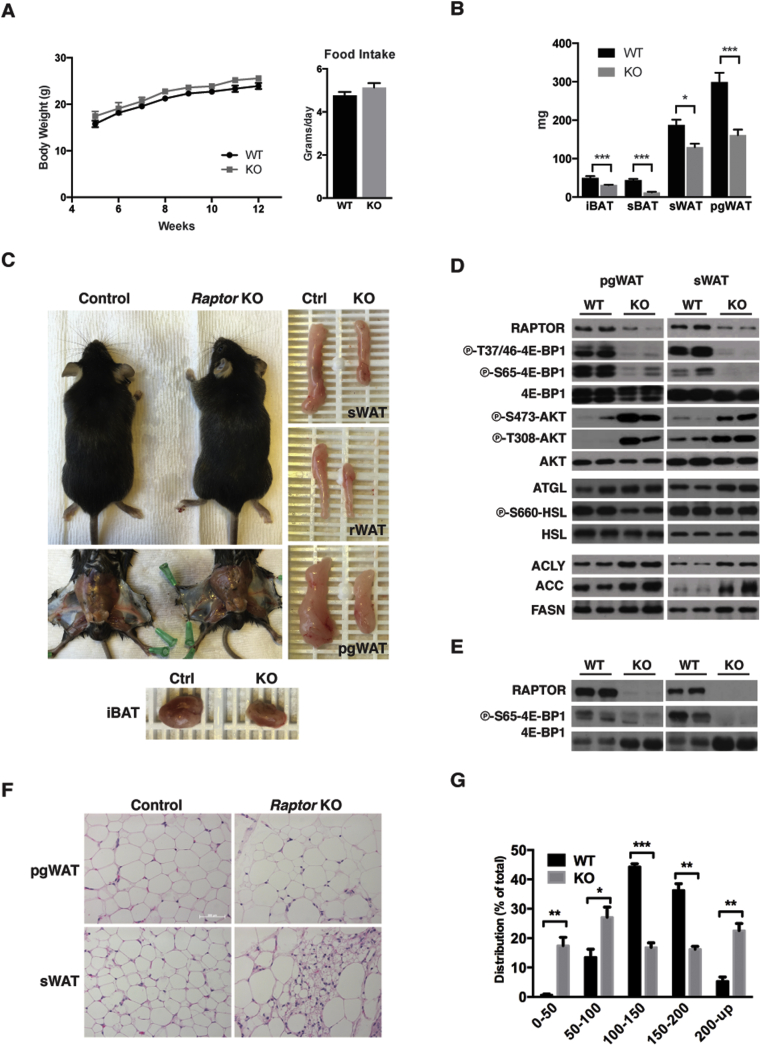
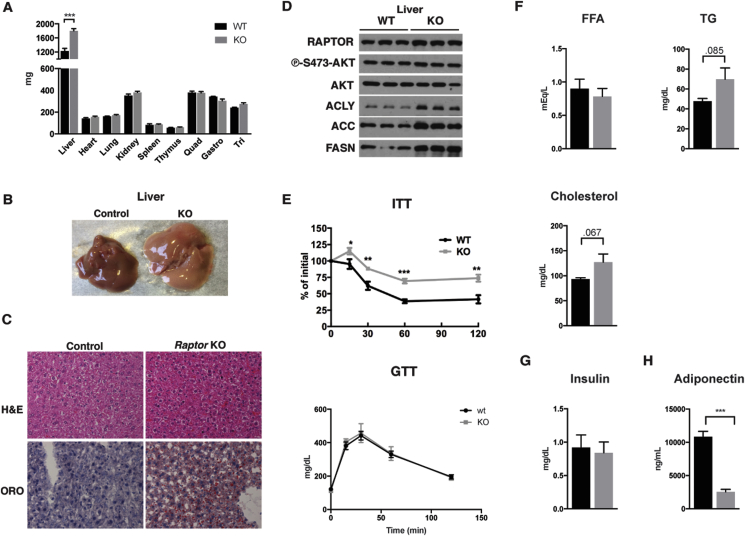
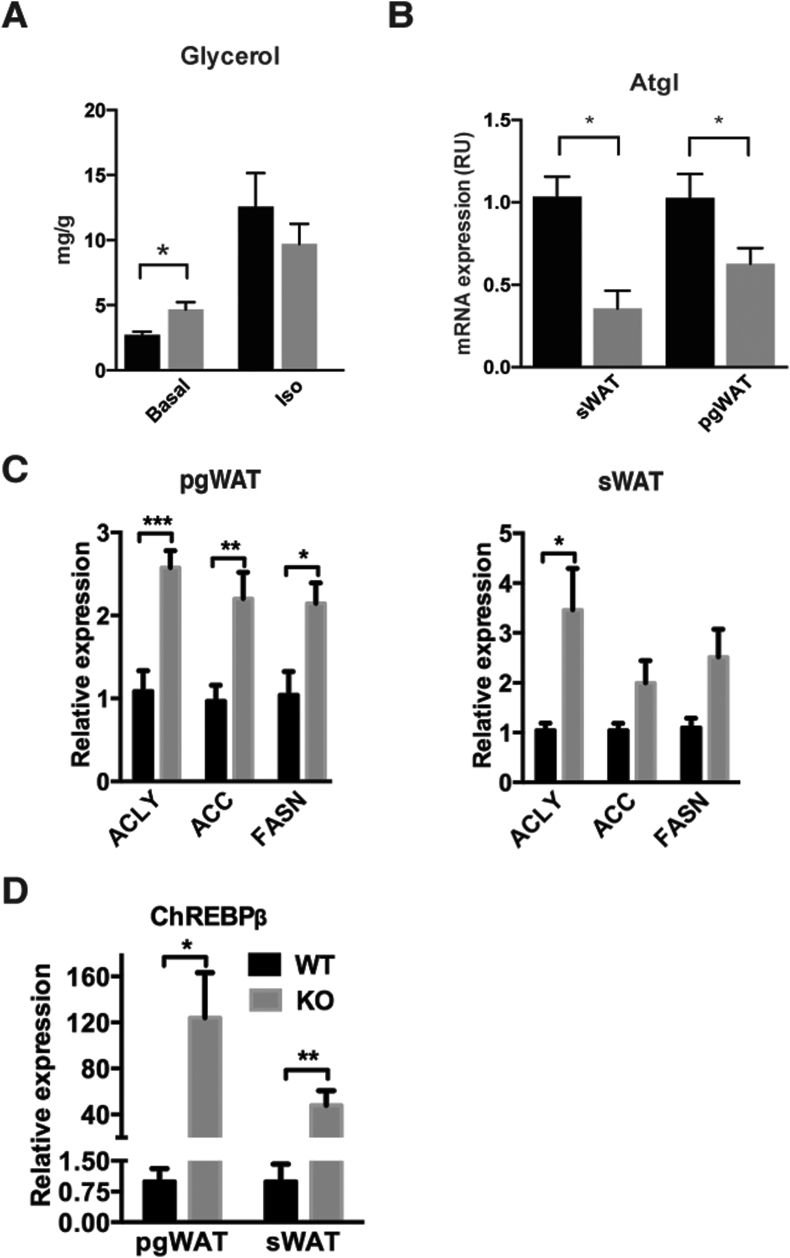
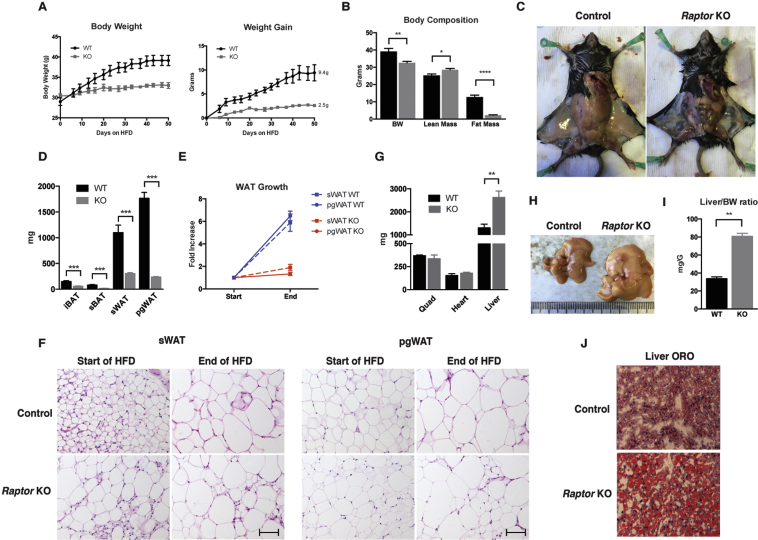
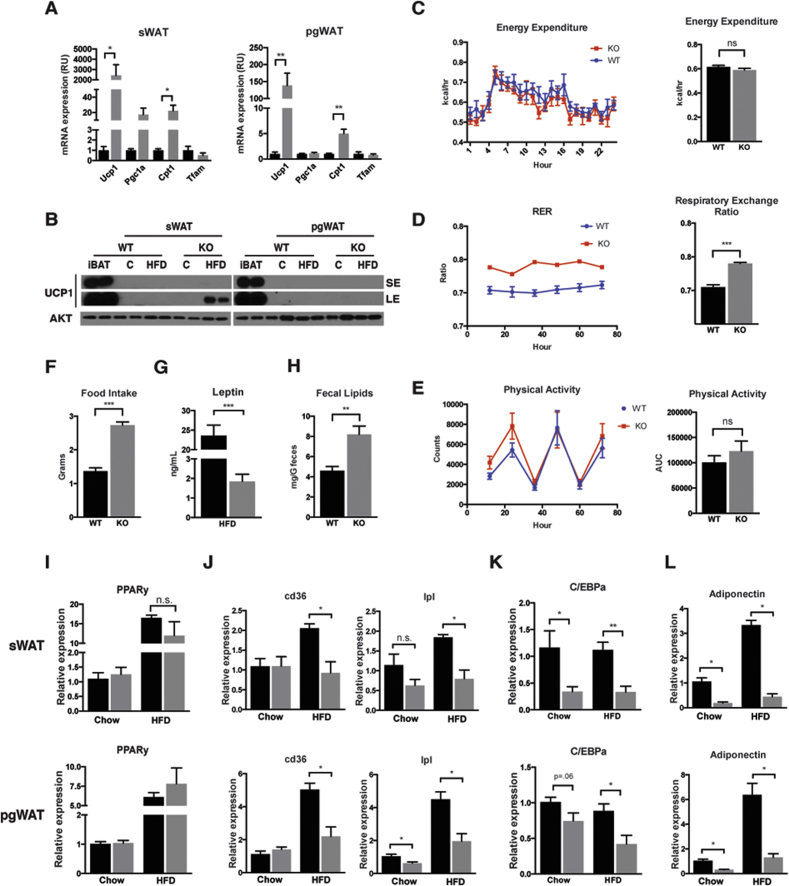
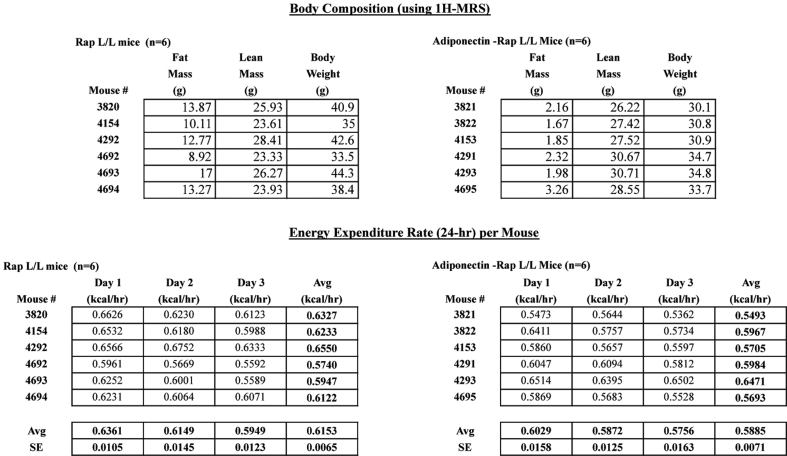
Results: Raptor (Adipoq-cre) mice have normal white adipose tissue (WAT) mass for the first few weeks of life, but soon thereafter develop lipodystrophy associated with hepatomegaly, hepatic steatosis, and insulin intolerance. Raptor (Adipoq-cre) mice are also resistant to becoming obese when consuming a high fat diet (HFD). Resistance to obesity does not appear to be due to increased energy expenditure, but rather from failed adipose tissue expansion resulting in severe hepatomegaly associated with hyperphagia and defective dietary lipid absorption. Deleting Raptor in WAT also decreases C/EBPα expression and the expression of its downstream target adiponectin, providing one possible mechanism of mTORC1 function in WAT.

Conclusions: mTORC1 activity in mature adipocytes is essential for maintaining normal adipose tissue growth and its selective loss in mature adipocytes leads to a progressive lipodystrophy disorder and systemic metabolic disease that shares many of the hallmarks of human congenital generalized lipodystrophy.

Keywords: Lipodystrophy; Obesity; Rapamycin; Raptor; White Adipose Tissue (WAT); mTORC1.


Figures

Fig. S1
Fig. S1
Ucp1-Cre driven Raptor KO reveal similar BAT phenotype as Adipoq-Cre driven mice. (A) BAT depot mass in adult Ucp1-Cre Raptor L/L KO and wt mice. (B) Representative H&E histology of adult wt and KO mice. (C) Body weight of adult mice. (D) WAT depot mass in adult mice.
Figure 1
Figure 1
Adipocyte Raptor KO mice exhibit normal WAT mass and mild BAT defects early in life. (A) Body weight measurements of KO (n = 6) and wt (n = 6) mice at 14 days of age. (B) Fat tissue mass of KO and wt mice at 14 days of age. (C) Lean tissue mass of KO and wt mice at 14 days of age. (D) Western blots of whole tissue lysate from iBAT and sWAT depots for indicated proteins. (E,F) Representative H&E images of tissues at indicated magnification. (Data were analyzed by Student's t-test. Values expressed as mean + SEM. *p < 0.05; **p < 0.01; ***p < 0.001).
Figure 2
Figure 2
Adipocyte Raptor KO mice develop lipodystrophy with age. (A) Body weight growth chart of wt (n = 6) and KO (n = 6) mice up to 12 weeks. Food intake of adult KO and wt mice. (B) Fat tissue mass of KO and wt mice at ∼12 weeks of age. (C) Representative images of adult KO and wt mice, and indicated WAT and BAT depots. (D) Western blots from whole tissue lysate for indicated proteins. (E) Western blots from isolated mature adipocytes for indicated proteins. (F) Representative H&E images of WAT depots from KO and wt mice. (G) Distribution of adipocyte diameter (microns) in pgWAT depots from ∼12 week old mice on chow diet.
Figure 3
Figure 3
The progressive lipodystrophy of adipocyte Raptor KO mice associates with hepatic steatosis and insulin intolerance. (A) Lean tissue mass of KO and wt mice at ∼12 weeks of age. (B) Representative images of liver from KO and wt mice at ∼12 weeks. (C) Representative H&E images of liver from KO and wt mice. (D) Western blots of liver lysate for indicated proteins. (E) ITT and GTT of adult KO and wt mice. (F) Serum chemistry levels of FFA, TG, and Cholesterol for adult wt and KO mice on chow diet. (G) Serum insulin levels for adult wt and KO mice. (H) Serum adiponectin levels for adult wt and KO mice. (Data were analyzed by Student's t-test. Values expressed as mean + SEM. *p < 0.05; **p < 0.01; ***p < 0.001).
Figure 4
Figure 4
Altered lipid metabolic pathways in the adipose tissues of adipocyte Raptor KO mice. (A) Concentration of glycerol from media of incubated excised pgWAT depots under specified conditions. (B) ATGL mRNA from whole tissue lysate. (C) Acly, Acc, and FasN mRNA expression in pgWAT and sWAT. (D) Chrebpβ mRNA expression in pgWAT and sWAT.
Figure 5
Figure 5
Adipocyte Raptor KO mice are resistant to HFD obesity but suffer from more severe hepatic steatosis. (A) Body weight, and weight gain of mice over course of HFD. (B) Body weight and body composition after ∼4 weeks HFD. (C) Representative images of inguinal fat depots after HFD. (D) Adipose depot masses at the end of HFD course. (E) Fold increase in WAT depot mass after HFD feeding. (F) Representative H&E images of specified tissues before and after HFD. (G) Lean tissue mass after HFD. (H) Representative images of liver after HFD. (I) Liver/BW ratio of mice after HFD. (J) Representative ORO staining of liver samples after HFD. (Data were analyzed by Student's t-test. Values expressed as mean + SEM. *p < 0.05; **p < 0.01; ***p < 0.001).
Figure 6
Figure 6
Energy utilization and adipocyte transcriptional regulation. (A) mRNA expression levels from whole tissue lysate from Chow fed mice for indicated genes. (B) Western blots of whole tissue lysate for indicated proteins from both chow and HFD mice, along with exposure times. SE is short exposure, LE is long exposure. (C) Mean energy expenditure per mouse over 24 hrs, with AUC. (D) Mean respiratory exchange ratio per mouse over 3 days, with AUC. (E) Mean activity per mouse over 3 days, with AUC. (F) Daily food intake per mouse after 4 weeks on HFD. (G) Serum leptin concentration after HFD. (H) Fecal lipid content after 4 weeks HFD. (I) PPARy mRNA expression levels in whole tissue lysate for respective mouse models. (J) mRNA expression levels of PPARy targets in whole tissue lysate for respective mouse models. (K) C/EBPa mRNA expression levels from whole tissue lysate for respective mouse models. (L) Adiponectin mRNA expression from whole tissue lysate for respective mouse models. (Data were analyzed by Student's t-test. Values expressed as mean + SEM. *p < 0.05; **p < 0.01; ***p < 0.001).
None

References

    1. Ogden C.L., Carroll M.D., Kit B.K., Flegal K.M. Prevalence of childhood and adult obesity in the United States, 2011–2012. JAMA. 2014;311:806–814. - PMC - PubMed
    1. NIDDK, http://www.niddk.nih.gov/health-information/health-statistics/Pages/over....
    1. Eurostat, http://ec.europa.eu/eurostat/en/web/products-press-releases/-/3-24112011-BP.
    1. Laplante M., Sabatini D.M. mTOR signaling in growth control and disease. Cell. 2012;149:274–293. - PMC - PubMed
    1. Wolfson R.L., Chantranupong L., Saxton R.A., Shen K., Scaria S.M., Cantor J.R. Sestrin2 is a leucine sensor for the mTORC1 pathway. Science. 2016;351:43–48. - PMC - PubMed

LinkOut - more resources