. 2016 May 23;3(2):ENEURO.0141-15.2016.
doi: 10.1523/ENEURO.0141-15.2016. eCollection 2016 Mar-Apr.

Multiscale Aspects of Generation of High-Gamma Activity during Seizures in Human Neocortex

Affiliations

Multiscale Aspects of Generation of High-Gamma Activity during Seizures in Human Neocortex

Tahra L Eissa et al. eNeuro. .

Abstract

High-gamma (HG; 80-150 Hz) activity in macroscopic clinical records is considered a marker for critical brain regions involved in seizure initiation; it is correlated with pathological multiunit firing during neocortical seizures in the seizure core, an area identified by correlated multiunit spiking and low frequency seizure activity. However, the effects of the spatiotemporal dynamics of seizure on HG power generation are not well understood. Here, we studied HG generation and propagation, using a three-step, multiscale signal analysis and modeling approach. First, we analyzed concurrent neuronal and microscopic network HG activity in neocortical slices from seven intractable epilepsy patients. We found HG activity in these networks, especially when neurons displayed paroxysmal depolarization shifts and network activity was highly synchronized. Second, we examined HG activity acquired with microelectrode arrays recorded during human seizures (n = 8). We confirmed the presence of synchronized HG power across microelectrode records and the macroscale, both specifically associated with the core region of the seizure. Third, we used volume conduction-based modeling to relate HG activity and network synchrony at different network scales. We showed that local HG oscillations require high levels of synchrony to cross scales, and that this requirement is met at the microscopic scale, but not within macroscopic networks. Instead, we present evidence that HG power at the macroscale may result from harmonics of ongoing seizure activity. Ictal HG power marks the seizure core, but the generating mechanism can differ across spatial scales.

Keywords: HFOs; epilepsy; human; modeling; neocortex; seizure.


Figures

None
Graphical abstract
Figure 1.
Figure 1.
Methodology. A, Acute slice recording setup with concurrent extracellular and intracellular recordings. SLA and PDSs were induced with the addition of bicuculline and NMDA (black arrow). B, Local seizure activity from patients was recorded with MEAs placed concurrently with cortical grids that measured the ECoG. The power of the HG activity was determined in both individual microelectrode signals (magenta) and averaged MEA activity (blue).
Figure 2.
Figure 2.
Jitter analysis and synchrony. Cartoon of the jitter analysis in which a randomized delay (shift) was applied to each signal prior to computing the signal average. The jitter simulates levels of asynchrony between the signals, while the average represents the effect of volume conduction (Eq. 1). A, Flowchart of jitter methodology. Each signal within the ensemble is jittered by applying a randomized delay (τi) ranging from 0 to τmax. The jittered signals are then averaged to represent the compound activity of the signals due to volume conduction. We perform power spectral analysis on the averaged activity and determine the amount of HG power in the signal. The amount of HG power is then plotted against the maximum delay (τmax; i.e., the degree of asynchrony). This procedure is repeated for a range of increasing maximum delays (in this example, a range from 0 to 8 ms in steps of 2 ms). B, Set of randomly jittered signals (blue dots mark the center of each signal) drawn from a uniform distribution characterized by a maximum delay, τmax. The red trace is the time average of the jittered dataset. C, The power spectra of the individual signals in the inset of A, and the average of these power spectra (in red). D, The relationship between the power in a time-averaged signal and the degree of asynchrony determined by the maximum delay (τmax) of the applied jitter. The two gray panels depict example datasets: one in which the signals are perfectly synchronized (No jitter, i.e., Max Delay = 0) and one with significant jitter (maximum delay = 4 ms). To quantify the amount of synchrony in a set of signals, we computed the synchrony ratio by dividing the power from the time-averaged power spectrum by the power from the averaged power spectra (i.e., the values marked as 2 in D divided by those marked by 1 in C).
Figure 3.
Figure 3.
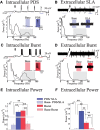
Seizure-like activity produces significant amounts of HG power. A, Example trace of intracellular activities recorded in an acute slice of human neocortical tissue. The arrow marks bath application of bicuculline and NMDA. Insets show examples of PDS and baseline (Base) signals. Intracellular PDSs are characterized by large depolarizations of ∼30 mV above the resting potential that includes depolarization block. This resulted in reduced interburst spike rates, compared with physiological bursts, and decreased spike amplitudes during the burst. Power spectra of intracellular signals show increased power in the HG band (80-150 Hz, gray box) during PDS activity (black trace) compared with baseline (gray trace). B, Same as in A for the extracellular signal recorded simultaneously with the intracellular signal. Insets depict SLA and network baseline activity (Base). Power spectra show an increase in the HG band power during SLA compared with baseline. C, Intracellular, nonsaturating bursting activity from acute human neocortical slice. Baseline (Base) and bursting (Burst) activities are shown in the insets. Power spectra show increased HG power during bursting over baseline. D, Extracellular bursting activity simultaneously recorded in the same slice as C. Power spectra do not show a significant increase of HG power during the network burst. E, Bar graph of intracellular HG power across states, including the mean HG power and SEM, shows a large increase in HG power during both PDSs and nonsaturating bursts. Note the discontinuity in the vertical axis. Dark blue, PDS; light blue, corresponding baseline activity; red, nonsaturating bursts; pink, corresponding baseline activity. F, Bar graph of extracellular HG power across states shows that extracellular recordings from networks with SLA (that included single neurons with PDSs) show significantly more HG power than network recordings from nonsaturating cellular bursts. Dark blue, SLA; light blue, corresponding baseline activity; red, network bursting of networks with nonsaturating cellular bursts; pink, corresponding baseline activity. **p < 0.02.
Figure 4.
Figure 4.
Power of average HG activity depends on synchrony levels. A, B, Sequential burst events from intracellular (IC) PDS activity (A) and extracellular (EC) SLA slice recordings (B) were detected and used to represent signals generated across multiple locations. Detected burst events (synchronous case, black traces) or randomly selected epochs (asynchronous case, green traces) were then superimposed to mimic volume conduction. These superimposed signals were then averaged, and power spectra were computed (bottom plots; black, synchronous case; green, asynchronous case; gray boxes, HG band 80-150 Hz). C, D, Bar graphs of the mean HG power and SEM of the averaged signals (gray, baseline; green, asynchronous average; black, synchronous average). Result shows a large difference in the amount of HG power (note the discontinuity in the vertical axes) between the synchronous and asynchronous scenarios (**p < 0.02). E, F, Jitter plots showing the amount of HG power retained in a series of averages in which the superimposed signals undergo randomized delays prior to averaging. For each average, these randomized delays are drawn from a uniform distribution ranging from zero to Max Delay (abscissa). Insets detail the drop in HG power retained with maximum delays of <50 ms. Both IC and EC recordings show a dramatic drop in HG power with maximum delays of <10 ms.
Figure 5.
Figure 5.
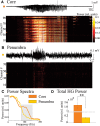
Microelectrodes in the core record higher levels of HG power compared with those in the penumbra. Seizure activity from MEA recordings was separated post hoc into the following two distinct territories: (1) the ictal core, defined as the cortical area where low-frequency activity is correlated with high levels of multiunit activity (two patients, four seizures); and (2) the ictal penumbra, where the low-frequency fluctuations are accompanied by uncorrelated and small changes in firing (two patients, four seizures). A, Top, Example microelectrode recording from core territories during a seizure. Bottom, Heat map of HG power detected in 100 ms overlapping epochs across the seizure (50 ms overlap). Channel # corresponds to the single microelectrode channels of the MEA. B, Same as in A for a recording taken from the penumbral territory. C, Examples of power spectra from microelectrodes in the core (orange) and penumbra (yellow) during fully developed seizure. Note that the core shows more power in the HG band. D, Bar graph of the mean and SEM of the HG power from the entire seizure for microelectrode recordings in the ictal core compared with those in the penumbra shows significantly more HG power in the core territories; note the discontinuity in the vertical axis (**p < 0.02).
Figure 6.
Figure 6.
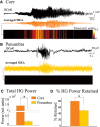
Averaged MEA activity shows HG power predominantly in the core. A, Example ECoG trace recorded from a cortical grid electrode 1 cm from the MEA location (black), Pseudo-ECoG (orange) produced by averaging the microelectrode channels for a single seizure in the ictal core. Bottom, A heat map of HG power of the Pseudo-ECoG in the ictal core territory. To compute the heat map, we subdivided signals into 100 ms overlapping epochs (50 ms overlap). B, Same as in A for a recording in the penumbra. C, Bar graph of mean and SEM of the HG power of the Pseudo-ECoG activity across the entire seizure in core and penumbra shows more HG power in the averaged activity of the core; note the discontinuity in the vertical axis. D, Since computing the averaged temporal activity takes into account differences in phase between HG activities at each microelectrode, synchrony was measured as a percentage of the HG power retained after temporal averaging compared with the averaged spectra of the individual microelectrodes (Fig. 2; Eq. 4). More power was retained in the core, suggesting a higher level of HG synchrony between these microelectrodes (*p < 0.05).
Figure 7.
Figure 7.
Synchrony is increased during seizure activity in the core. P, Patient number; S, seizure number. A, Pseudo-ECoG recorded from ictal core territories. In the bar labeled Analysis 1, HG power is determined from the power spectrum of the time average. In contrast, in the Analysis 2 case, HG power is determined in the average spectrum of the individual power spectra of the MEA signals. The bar labeled as Synchrony Ratio represents the ratio between the two analyses (Fig. 2; Eq. 4). Heat maps and synchrony were determined in 100 ms overlapping epochs (overlap, 50 ms). The heat maps represent the averaged spectral activity, and the averaged temporal activity and their synchrony ratio. Right-hand graphs show the result of our jitter analysis, depicting the amount of HG power (ordinate) as a function of the maximum delay (abscissa). Jitter plots from core seizures show a slow decline in HG power. B, Same as in A for seizures recorded from penumbral territories. Note different scales used for the ordinate across the jitter plots.
Figure 8.
Figure 8.
HG power observed at microelectrode and macroelectrode scales may result from different mechanisms. A, Example signals of the individual generators in three types of models (I–III) we investigated in the context of the jitter analysis. Model I consists of generators of sinusoidal frequencies within the HG band. Model II represents the interaction of the HG oscillation with a sinusoidal oscillator of lower frequency. This model consisted of the following three subtypes: (1) an additive effect of the low- and high-frequency oscillations; (2) the amplitude of the HG oscillation is modulated; and (3) the HG frequency is modulated. The model III generators are nonsinusoidal, resulting in harmonics within the HG power band. B, Model I, Equation 7, predicts a steep decline in the compound HG power when small amounts of jitter are added to the system. This model result closely matches the rapid depletion of HG power seen in the jitter analysis of the in vitro signals (Fig. 4). Both the analytical result (red) and a stochastic simulation of the same model (blue) are plotted. C, Filtered microelectrode signals from in vivo MEA recordings at the ictal core (filter band, 80-150 Hz). This example of HG activity across microelectrodes in the MEA shows significant bursts of HG power originating from the slower dominant seizure oscillation. In addition, ongoing HG oscillations show a small amount of baseline desynchronization of ∼10 ms (inset). These delays are not unexpected for the network size involved in this measurement. Considering the dimensions of the array, 96 electrodes distributed in a 4 × 4 mm area, this corresponds to propagation rates that are bounded at ≤50 mm/s, showing a clear overlap with the range of propagation velocities between 20 and 100 mm/s observed during disinhibited slice activity (Trevelyan et al., 2006). D, Prediction of model III, Equation 9. Analytic and stochastic results are plotted as in A. Because of the baseline asynchrony in the in vivo recordings C, we ignored delays of <10 ms in this model. This scenario can explain a drop-off similar to those observed in the jitter plots of the in vivo data (Fig. 7).

References

    1. Alvarado-Rojas C, Huberfeld G, Baulac M, Clemenceau S, Charpier S, Miles R, de la Prida LM, Le Van Quyen M (2015) Different mechanisms of ripple-like oscillations in the human epileptic subiculum. Ann Neurol 77:281-290. 10.1002/ana.24324 - DOI - PMC - PubMed
    1. Bartos M, Vida I, Jonas P (2007) Synaptic mechanisms of synchronized gamma oscillations in inhibitory interneuron networks. Nat Rev Neurosci 8:45–56. 10.1038/nrn2044 - DOI - PubMed
    1. Berg A, Berkovic S, Brodie M, Buchhalter J, Cross J, van Emde Boas W, Engel J, French J, Glauser TA, Mathern GW, Moshé SL, Nordli D, Plouin P, Scheffer IE (2010) Revised terminology and concepts for organization of seizures and epilepsies: report of the ILAE commission on classification and terminology 2005-2009. Epilepsia 51:676–685. 10.1111/j.1528-1167.2010.02522.x - DOI - PubMed
    1. Bragin A, Engel J Jr, Wilson C, Fried I, Buzsáki G (1999a) High-frequency oscillations in human brain. Hippocampus 9:137–142. - PubMed
    1. Bragin A, Engel J Jr, Wilson C, Fried I, Mathern G (1999b) Hippocampal and entorhinal cortex high-frequency oscillations (100–500 Hz) in human epileptic brain and in kainic acid–treated rats with chronic seizures. Epilepsia 40:127–137. - PubMed

Publication types

LinkOut - more resources