

The Role of Adaptation in Bacterial Speed Races
- PMID: 27257812
- PMCID: PMC4892596
- DOI: 10.1371/journal.pcbi.1004974
The Role of Adaptation in Bacterial Speed Races
Abstract
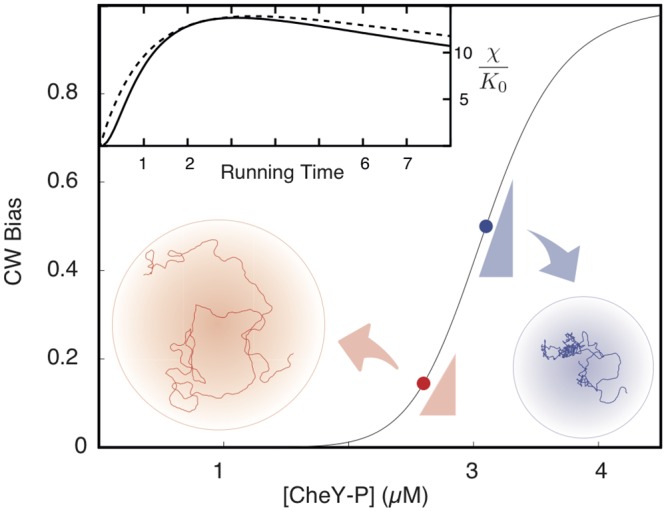
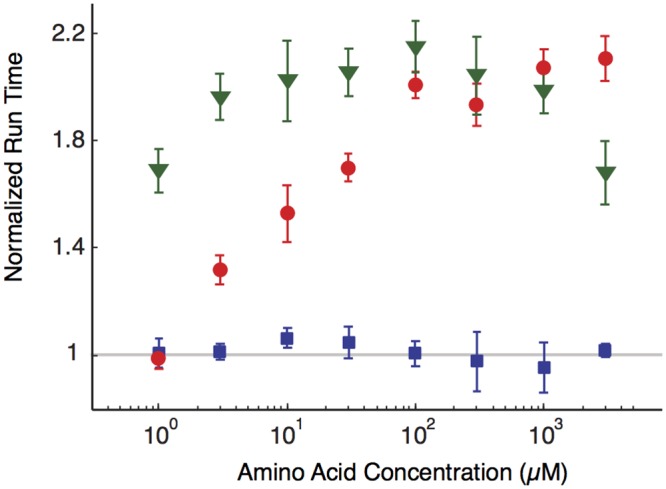
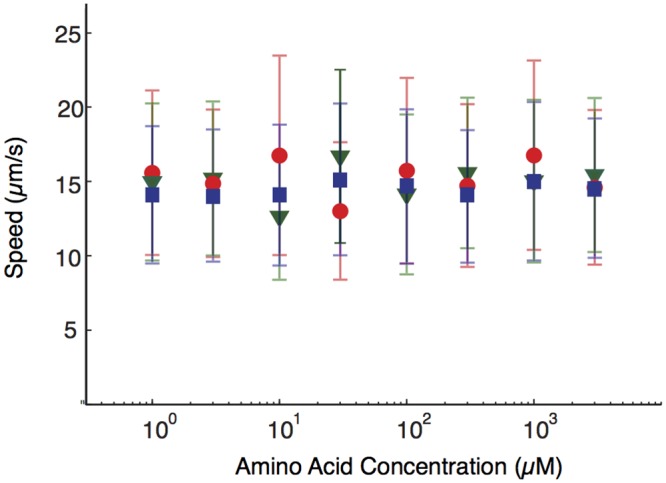
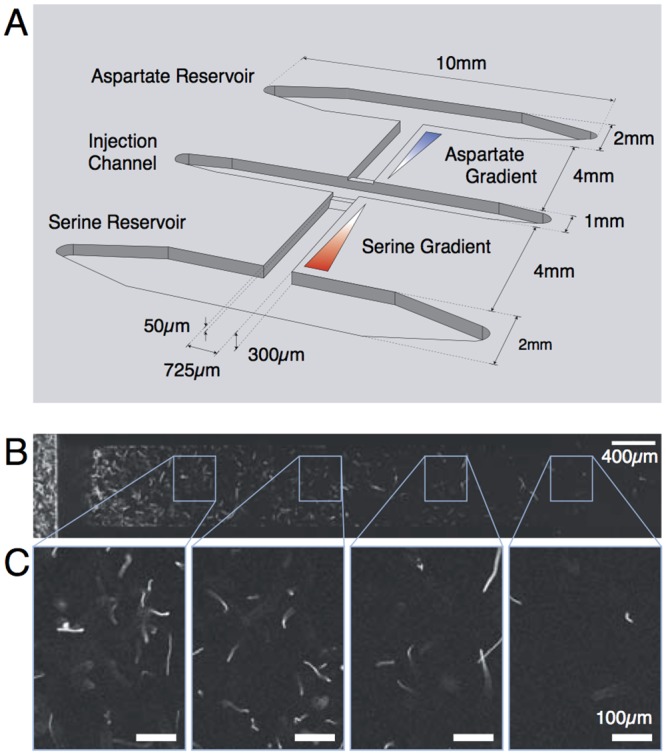
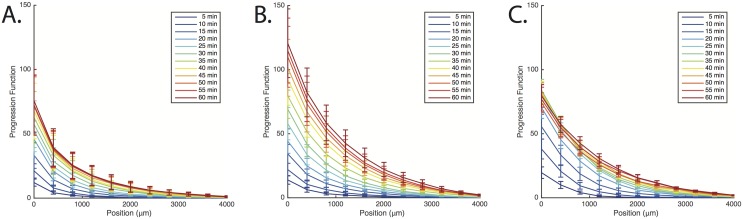
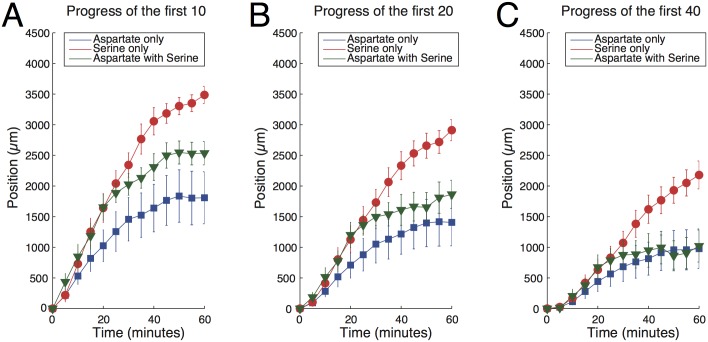
Evolution of biological sensory systems is driven by the need for efficient responses to environmental stimuli. A paradigm among prokaryotes is the chemotaxis system, which allows bacteria to navigate gradients of chemoattractants by biasing their run-and-tumble motion. A notable feature of chemotaxis is adaptation: after the application of a step stimulus, the bacterial running time relaxes to its pre-stimulus level. The response to the amino acid aspartate is precisely adapted whilst the response to serine is not, in spite of the same pathway processing the signals preferentially sensed by the two receptors Tar and Tsr, respectively. While the chemotaxis pathway in E. coli is well characterized, the role of adaptation, its functional significance and the ecological conditions where chemotaxis is selected, are largely unknown. Here, we investigate the role of adaptation in the climbing of gradients by E. coli. We first present theoretical arguments that highlight the mechanisms that control the efficiency of the chemotactic up-gradient motion. We discuss then the limitations of linear response theory, which motivate our subsequent experimental investigation of E. coli speed races in gradients of aspartate, serine and combinations thereof. By using microfluidic techniques, we engineer controlled gradients and demonstrate that bacterial fronts progress faster in equal-magnitude gradients of serine than aspartate. The effect is observed over an extended range of concentrations and is not due to differences in swimming velocities. We then show that adding a constant background of serine to gradients of aspartate breaks the adaptation to aspartate, which results in a sped-up progression of the fronts and directly illustrate the role of adaptation in chemotactic gradient-climbing.
Conflict of interest statement
The authors have declared that no competing interests exist.
Figures
Similar articles
-
Responses of Escherichia coli bacteria to two opposing chemoattractant gradients depend on the chemoreceptor ratio.J Bacteriol. 2010 Apr;192(7):1796-800. doi: 10.1128/JB.01507-09. Epub 2010 Jan 29. J Bacteriol. 2010. PMID: 20118262 Free PMC article.
-
Mathematical modeling and experimental validation of chemotaxis under controlled gradients of methyl-aspartate in Escherichia coli.Mol Biosyst. 2010 Jun;6(6):1082-92. doi: 10.1039/b924368b. Epub 2010 Mar 18. Mol Biosyst. 2010. PMID: 20485750
-
Theoretical results for chemotactic response and drift of E. coli in a weak attractant gradient.J Theor Biol. 2010 Sep 7;266(1):99-106. doi: 10.1016/j.jtbi.2010.06.012. Epub 2010 Jun 15. J Theor Biol. 2010. PMID: 20558183
-
Diversity in bacterial chemotactic responses and niche adaptation.Adv Appl Microbiol. 2009;66:53-75. doi: 10.1016/S0065-2164(08)00803-4. Adv Appl Microbiol. 2009. PMID: 19203648 Review.
-
Emergent properties of bacterial chemotaxis pathway.Curr Opin Microbiol. 2017 Oct;39:24-33. doi: 10.1016/j.mib.2017.07.004. Epub 2017 Aug 17. Curr Opin Microbiol. 2017. PMID: 28822274 Review.
Cited by
-
Chemotactic migration of bacteria in porous media.Biophys J. 2021 Aug 17;120(16):3483-3497. doi: 10.1016/j.bpj.2021.05.012. Epub 2021 May 20. Biophys J. 2021. PMID: 34022238 Free PMC article.
-
Natural search algorithms as a bridge between organisms, evolution, and ecology.Proc Natl Acad Sci U S A. 2016 Aug 23;113(34):9413-20. doi: 10.1073/pnas.1606195113. Epub 2016 Aug 5. Proc Natl Acad Sci U S A. 2016. PMID: 27496324 Free PMC article.
-
Phenotypic diversity and temporal variability in a bacterial signaling network revealed by single-cell FRET.Elife. 2017 Dec 12;6:e27455. doi: 10.7554/eLife.27455. Elife. 2017. PMID: 29231170 Free PMC article.
-
Chemotaxis as a navigation strategy to boost range expansion.Nature. 2019 Nov;575(7784):658-663. doi: 10.1038/s41586-019-1733-y. Epub 2019 Nov 6. Nature. 2019. PMID: 31695195 Free PMC article.
-
Escherichia coli chemotaxis is information limited.Nat Phys. 2021 Dec;17(12):1426-1431. doi: 10.1038/s41567-021-01380-3. Epub 2021 Nov 25. Nat Phys. 2021. PMID: 35035514 Free PMC article.
References
-
- Berg HC (2003) E. coli in Motion (Springer, New York: ).
MeSH terms
Substances
LinkOut - more resources
Full Text Sources
Other Literature Sources
