Comparative Study
. 2016 Jun 3;11(6):e0156734.
doi: 10.1371/journal.pone.0156734. eCollection 2016.

Quantification and Comparison of Anti-Fibrotic Therapies by Polarized SRM and SHG-Based Morphometry in Rat UUO Model

Affiliations
Comparative Study

Quantification and Comparison of Anti-Fibrotic Therapies by Polarized SRM and SHG-Based Morphometry in Rat UUO Model

Hu Sheng Qian et al. PLoS One. .

Abstract

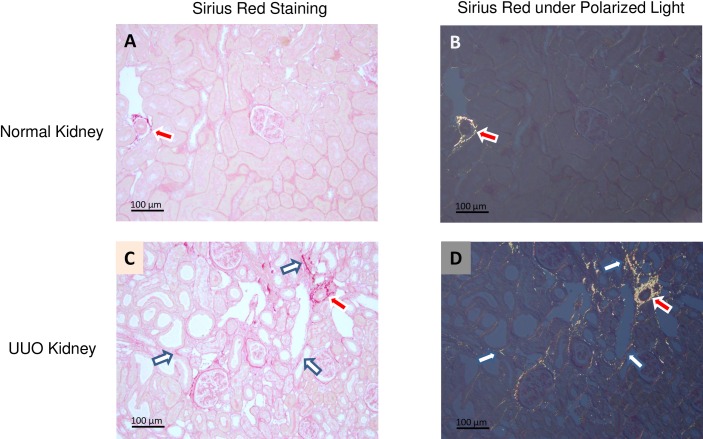
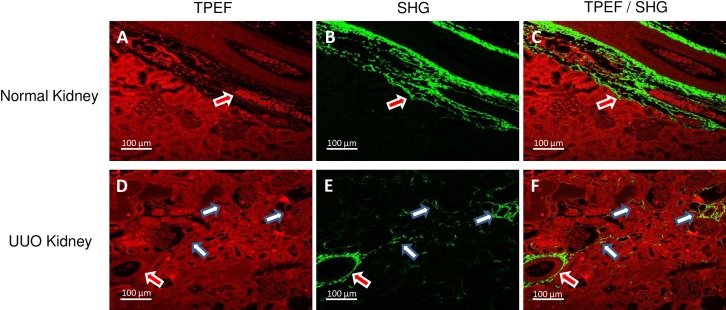
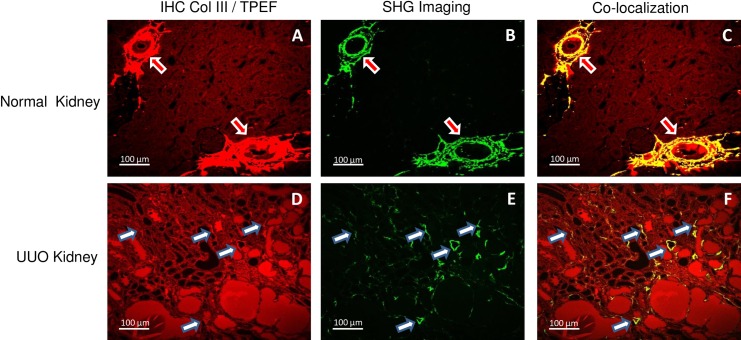
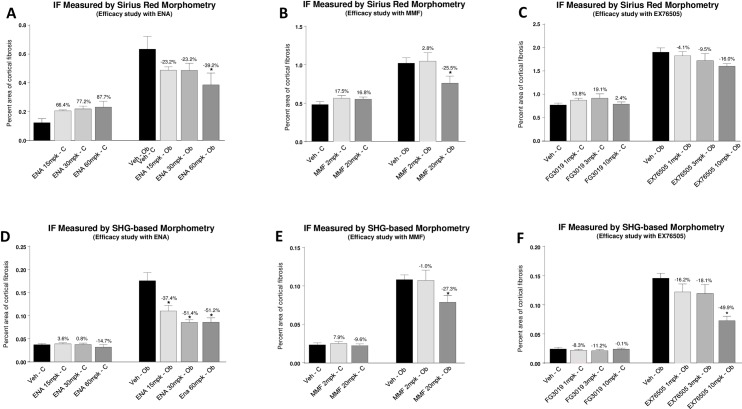
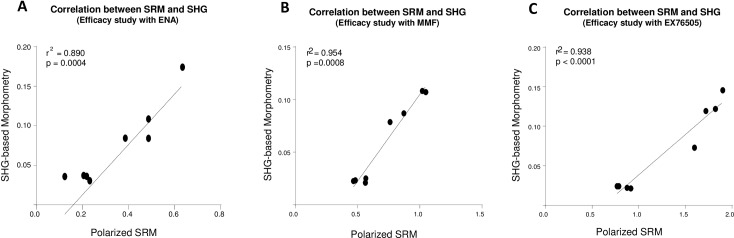
Renal interstitial fibrosis (IF) is an important pathologic manifestation of disease progression in a variety of chronic kidney diseases (CKD). However, the quantitative and reproducible analysis of IF remains a challenge, especially in experimental animal models of progressive IF. In this study, we compare traditional polarized Sirius Red morphometry (SRM) to novel Second Harmonic Generation (SHG)-based morphometry of unstained tissues for quantitative analysis of IF in the rat 5 day unilateral ureteral obstruction (UUO) model. To validate the specificity of SHG for detecting fibrillar collagen components in IF, co-localization studies for collagens type I, III, and IV were performed using IHC. In addition, we examined the correlation, dynamic range, sensitivity, and ability of polarized SRM and SHG-based morphometry to detect an anti-fibrotic effect of three different treatment regimens. Comparisons were made across three separate studies in which animals were treated with three mechanistically distinct pharmacologic agents: enalapril (ENA, 15, 30, 60 mg/kg), mycophenolate mofetil (MMF, 2, 20 mg/kg) or the connective tissue growth factor (CTGF) neutralizing antibody, EX75606 (1, 3, 10 mg/kg). Our results demonstrate a strong co-localization of the SHG signal with fibrillar collagens I and III but not non-fibrillar collagen IV. Quantitative IF, calculated as percent cortical area of fibrosis, demonstrated similar response profile for both polarized SRM and SHG-based morphometry. The two methodologies exhibited a strong correlation across all three pharmacology studies (r2 = 0.89-0.96). However, compared with polarized SRM, SHG-based morphometry delivered a greater dynamic range and absolute magnitude of reduction of IF after treatment. In summary, we demonstrate that SHG-based morphometry in unstained kidney tissues is comparable to polarized SRM for quantitation of fibrillar collagens, but with an enhanced sensitivity to detect treatment-induced reductions in IF. Thus, performing SHG-based morphometry on unstained kidney tissue is a reliable alternative to traditional polarized SRM for quantitative analysis of IF.


Conflict of interest statement

Competing Interests: No competing interests exist, and the commercial affiliation, Boehringer Ingelheim Pharmaceutics, Inc, does not alter the authors' adherence to all PLOS ONE policies on sharing data and materials.

Figures

Fig 1
Fig 1. Representative Sirius Red staining of renal IF: Sirius Red staining was visualized by either transmitted light microcopy or under polarized light microscopy in normal rat kidney (Fig 1A and Fig 1B) and the 5 day UUO kidney (Fig 1C and Fig 1D).
Under polarized light, fibrillar collagen appears as yellow structures; both adventitial vasculature (red arrow) and tubulointerstitum (white arrow) are easily identified. The scare bar in each image is 100μm, and the object is oriented at ±45° between crossed polar, and either the polarizer or the analyzer is rotated through an equal angle (Fig 1B and Fig 1D).
Fig 2
Fig 2. Representative TPEF / SHG imaging of renal IF: By using unstained, de-parrafinized kidney sections, TPEF imaging shows autofluorescence with discernible kidney structure (Fig 2A and Fig 2D with red color), while the SHG signal specifically visualizes fibrillar collagens in both adventitia of blood vessels (red arrow) and tubulointerstitium (white arrow) (Fig 2B and Fig 2E with green color).
Simultaneous TPEF and SHG imaging clearly reveal fibrillar collagen distribution (Fig 2C and Fig 2F). Note that all images were taken in the forward direction, and SHG images were taken using 2P-blocked bandpass emission filter (HQ515/20m-2P, Chroma Technology Corp, Bellows Falls, VT) and TPEF images were taken using bandpass filter (BP565-610, Zeiss Microscopy, Germany). The scare bar in each image is 100μm.
Fig 3
Fig 3. Co-locolization of SHG signal with IHC for fibrillar collagen III: In normal kidney, only adventitia of artery and large vein demonstrated positive IHC signal for collagen III (Fig 3A), however, for the UUO kidney section, many thin and scattered signals were captured in the interstitial area (Fig 3D).
A similar expression pattern was observed using SHG (B and E), and confirmed by co-localized of both the SHG and IHC staining (Fig 3C and Fig 3F). Note that all images were taken in the forward direction, and SHG images were taken used 2P-blocked bandpass emission filter (HQ515/20m-2P, Chroma Technology Corp, Bellows Falls, VT) and TPEF images were taken used bandpass filter (BP565-610, Zeiss Microscopy, Germany). The scare bar in each image is 100μm.
Fig 4
Fig 4. Comparison of response of therapeutic anti-fibrotic effects evaluated by SRM and SHG-based mephometry: Rats with UUO were treated with ACE inhibitor (enalapril), the immunosuppresant agent (mycophenolate mofetil), or CTGF neutralizing antibody.
Treatment-induced reduction in IF was evaluated either by polarized SRM (A, B, and C) or by SHG-based morphometry (D, E, and F).
Fig 5
Fig 5. Correlation between polarized SRM analysis and SHG-based morphometry: In all three UUO treatments, polarized SRM and SHG-based morphometry correlated strongly.

References

    1. Farris AB, Chan S, Climenhaga J, Adam B, Bellamy CO, Serón D, et al. Banff Fibrosis Study: Multicenter visual sssessment and computerized analysis of interstitial fibrosis in kidney biopsies. Am J Transplant 2014; 14: 897–907 10.1111/ajt.12641 - DOI - PubMed
    1. Liu Y. Renal fibrosis: New insights into the pathogenesis and therapeutics. Kidney Int 2006; 69: 213–217 - PubMed
    1. Boor P, Ostendorf T, Floege J. Renal fibrosis: Novel insights into mechanisms and therapeutic targets. Nat Rev Nephrol 2010; 6:643–656. 10.1038/nrneph.2010.120 - DOI - PubMed
    1. Farris AB, Adams CD, Brousaides N, Pelle PAD, Collins AB, Moradi E, et al. Morphometric and visual evaluation of fibrosis in renal biopsies. J Am Soc Nephrol 2011; 22: 176–186 10.1681/ASN.2009091005 - DOI - PMC - PubMed
    1. Junqueira LC, Bignolas G, Brentani RR. Picrosirius staining plus polarization microscopy, a specific method for collagen detection in tissue sections. Histochem J 1979; 11: 447–455 - PubMed

Publication types