. 2016 Jun 3;11(6):e0156262.
doi: 10.1371/journal.pone.0156262. eCollection 2016.

Membrane Transfer from Mononuclear Cells to Polymorphonuclear Neutrophils Transduces Cell Survival and Activation Signals in the Recipient Cells via Anti-Extrinsic Apoptotic and MAP Kinase Signaling Pathways

Affiliations

Membrane Transfer from Mononuclear Cells to Polymorphonuclear Neutrophils Transduces Cell Survival and Activation Signals in the Recipient Cells via Anti-Extrinsic Apoptotic and MAP Kinase Signaling Pathways

Ko-Jen Li et al. PLoS One. .

Abstract

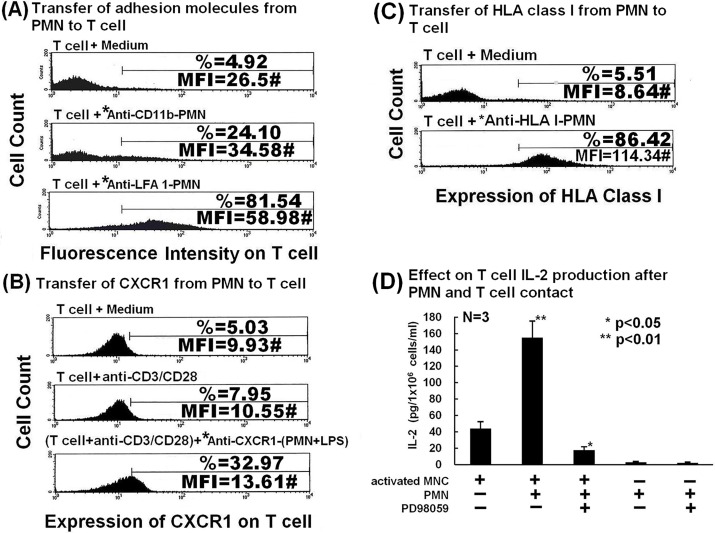
The biological significance of membrane transfer (trogocytosis) between polymorphonuclear neutrophils (PMNs) and mononuclear cells (MNCs) remains unclear. We investigated the biological/immunological effects and molecular basis of trogocytosis among various immune cells in healthy individuals and patients with active systemic lupus erythematosus (SLE). By flow cytometry, we determined that molecules in the immunological synapse, including HLA class-I and-II, CD11b and LFA-1, along with CXCR1, are exchanged among autologous PMNs, CD4+ T cells, and U937 cells (monocytes) after cell-cell contact. Small interfering RNA knockdown of the integrin adhesion molecule CD11a in U937 unexpectedly enhanced the level of total membrane transfer from U937 to PMN cells. Functionally, phagocytosis and IL-8 production by PMNs were enhanced after co-culture with T cells. Total membrane transfer from CD4+ T to PMNs delayed PMN apoptosis by suppressing the extrinsic apoptotic molecules, BAX, MYC and caspase 8. This enhancement of activities of PMNs by T cells was found to be mediated via p38- and P44/42-Akt-MAP kinase pathways and inhibited by the actin-polymerization inhibitor, latrunculin B, the clathrin inhibitor, Pitstop-2, and human immunoglobulin G, but not by the caveolin inhibitor, methyl-β-cyclodextrin. In addition, membrane transfer from PMNs enhanced IL-2 production by recipient anti-CD3/anti-CD28 activated MNCs, and this was suppressed by inhibitors of mitogen-activated protein kinase (PD98059) and protein kinase C (Rottlerin). Of clinical significance, decreased total membrane transfer from PMNs to MNCs in patients with active SLE suppressed mononuclear IL-2 production. In conclusion, membrane transfer from MNCs to PMNs, mainly at the immunological synapse, transduces survival and activation signals to enhance PMN functions and is dependent on actin polymerization, clathrin activation, and Fcγ receptors, while membrane transfer from PMNs to MNCs depends on MAP kinase and PKC signaling. Defective membrane transfer from PMNs to MNCs in patients with active systemic lupus erythematous suppressed activated mononuclear IL-2 production.


Conflict of interest statement

Competing Interests: The authors have declared that no competing interests exist.

Figures

Fig 1
Fig 1. Detection of Trogocytosis.
Flow cytometric (A) and confocal laser scan microscopic (B–E) detection of trogocytosis between PKH-26 (red fluorescence)-labeled CD4+ T cells and PKH-67 (green fluorescence)-labeled PMN. (A) The proportion of trogocytosis in PMN (panel R1; double stain in UR) and CD4+ T (panel R2) detected by flow cytometry after PMN-CD4+ T co-culture. (B) Trogocytosis between PMNs (arrows) and CD4+ T cells (arrowheads) leads to the generation of yellow fluorescence (magnification x400). (C) Membrane transfer from PKH-26-labeled CD4+ T cells to PKH-67-labeled PMNs (arrow) leads to the generation of yellow fluorescence at the site of cell-cell close contact (magnification x1000). (D) Trogocytosis between FITC-anti-CD4 antibody stained CD4+ T cell (arrowhead) and PKH-26-labeled PMN (arrow) demonstrating yellow fluorescence. *Indicates FITC-anti-CD4 antibody stained CD4+ T cells with no evidence of trogocytosis. Both cell types were nuclear stained with DAPI (blue fluorescence). (E) Trogocytosis between FITC-anti-CD16 antibody-stained PMN (arrow) and DAPI/PKH-26-labeled CD4+ T cell (arrowhead) demonstrating yellow fluorescence. *Indicates FITC-anti-CD16 antibody stained PMNs with no evidence of trogocytosis. Images are representative from three independent experiments.
Fig 2
Fig 2. Trogocytosis between PMN and U937 macrophage cells with or without siRNA knockdown of CD11a.
Trogocytosis between PKH-67 (green fluorescence)-labeled PMN and PKH-26 (red fluorescence)-labeled-U937 macrophage cells observed by confocal laser scan microscopy. (A) Direct cell-cell contact of PMNs with U937 cells for 1 h, demonstrating yellow fluorescence in many cells (magnification x400) (B) Transwell co-culture of PKH-67-labeled PMNs with PKH-26 labeled U937 cells for 1 h demonstrating an absence of yellow fluorescence (magnification x400). (C) Magnification of (A) showing yellow fluorescence in a PMN (arrow) and U937 cells (arrowheads) after 1 h co-culture (magnification x1000). (D) Co-culture of PKH-67-labeled PMNs and PKH-26-labeled U937 cells for 24 h; prominent yellow fluorescence is visible on PMNs (arrows) and U937 cells (arrowheads) (magnification x1000). (E) Results of FACS analysis demonstrating transfer of MHC class-II from human monocytes/macrophages to PMNs after co-culture for 2 h. (F) Immunoblot analysis of CD11a expression in U937 cell lysates stably transfected with specific CD11a siRNA or empty vector. (G) Densitometric quantification of CD11a in U937 cell lysates with/without siRNA knockdown by Western blot. (H) Total membrane transfer (expressed as mean fluorescence intensity, MFI) from U937 cells, with or without siRNA knockdown of CD11a, to PMNs after 2 h co-culture.
Fig 3
Fig 3. Enhanced phagocytic activity and IL-8 production of PMNs after cell-cell contact with autologous T cells.
(A) A representative case from three independent experiments showing PMN phagocytotic activity (%) detected by Flow cytometry. (B) IL-8 concentration (pg/ml) in 6 h co-culture supernatants detected by ELISA (N = 8). *Indicates transwell co-culture.
Fig 4
Fig 4. Co-culture of PMNs with lymphocytes or monocytes decreases PMN apoptosis via the anti-extrinsic pro-apoptotic pathway.
(A) A representative case from four independent experiments showing the effect on PMN apoptosis after cell-cell contact with monocytes, lymphocytes or RBCs for 24 h. UR = late stage apoptosis. LR = early apoptosis. *Transwell chamber co-culture. (B) A representative case from three independent experiments to detect caspase 8 (above) and caspase 9 (below) by FLICA. In each case, the upper panel shows results from PMNs cultured alone, whereas the middle and bottom panels are results from PMNs and MNCs co-cultured or cultured in transwell chambers, respectively. (C) Detection of pro-apoptotic (BAX and MYC) and anti-apoptotic gene (BCL2L1 and BCL2) mRNA expression in PMN by RT-PCR after cell-cell contact co-culture with lymphocytes or monocytes/macrophages for 2 h. Two independent experiments were conducted.
Fig 5
Fig 5. Detection of intracellular signaling molecule expression in PMN by Western blot after co-culture with lymphocytes (Lym) or monocytes (Mono) for 2 h and 14h.
Fig 6
Fig 6. Detection of transfer of specific surface-expressed molecules from PMN to T cells and effects on IL-2 production by anti-CD3/anti-CD28 activated MNCs.
Results of FACS analysis demonstrating (A) transfer of adhesion molecules CD11b and LFA-1, (B) transfer of CXCR1, and (C) transfer of HLA class-I from PMN to T cells after co-culture for 2 h. *FITC-antibody-stained PMNs. (D) Effects of autologous PMNs and MAP kinase inhibitor PD98059 on IL-2 production by activated human MNCs.
Fig 7
Fig 7. Comparative total membrane transfer from PMNs to MNCs and effects on IL-2 production by MNCs in active SLE versus healthy controls.
Results of FACS analysis of representative cases showing (A) the proportion of total membrane transfer from PMNs to MNCs using cells from a healthy individual and (B) the proportion of total membrane transfer from PMNs to MNCs in a patient with active SLE. (C) Comparative proportion of total membrane transfer from PMNs to MNCs in patients with active SLE versus healthy controls. (D) Comparative IL-2 production in normal and active SLE groups.

References

    1. Cassatella MA. The production of cytokines by polymorphonuclear neutrophils. Immunol Today. 1995;16: 21–26. - PubMed
    1. Lloyd AR, Oppenheim JJ. Poly's lament: the neglected role of the polymorphonuclear neutrophil in the afferent limb of the immune response. Immunol Today. 1992;13: 169–172. - PubMed
    1. Hirohata S, Yanagida T, Yoshino Y, Miyashita H. Polymorphonuclear neutrophils enhance suppressive activities of anti-CD3-induced CD4+ suppressor T cells. Cell Immunol. 1995;160: 270–277. - PubMed
    1. el-Hag A, Clark RA. Immunosuppression by activated human neutrophils. Dependence on the myeloperoxidase system. J Immunol. 1987;139: 2406–2413. - PubMed
    1. Kudo C, Yamashita T, Araki A, Terashita M, Watanabe T, Atsumi M, et al. Modulation of in vivo immune response by selective depletion of neutrophils using a monoclonal antibody, RP-3. I. Inhibition by RP-3 treatment of the priming and effector phases of delayed type hypersensitivity to sheep red blood cells in rats. J Immunol. 1993;150: 3728–3738. - PubMed

MeSH terms