

Repression of the Antioxidant NRF2 Pathway in Premature Aging
- PMID: 27259148
- PMCID: PMC4893198
- DOI: 10.1016/j.cell.2016.05.017
Repression of the Antioxidant NRF2 Pathway in Premature Aging
Abstract
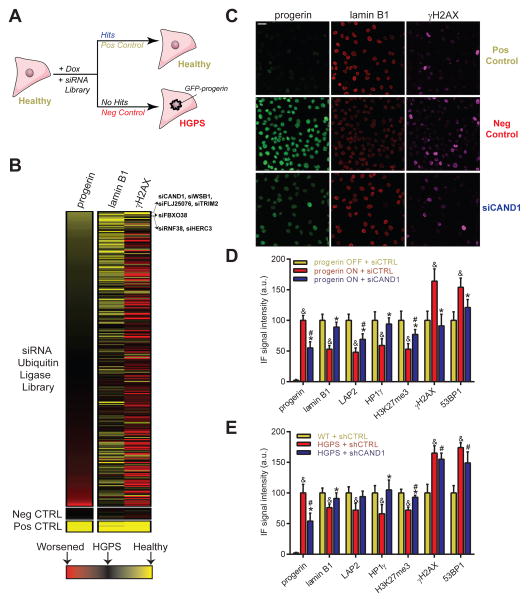
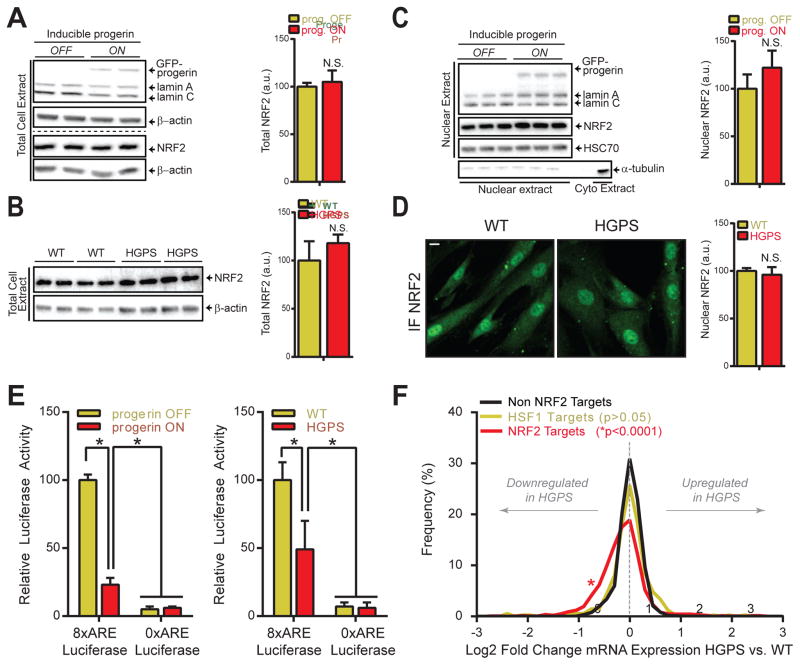
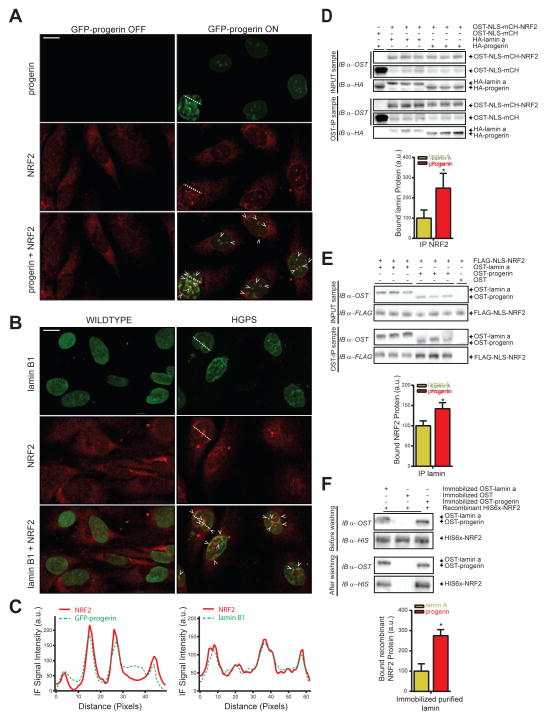
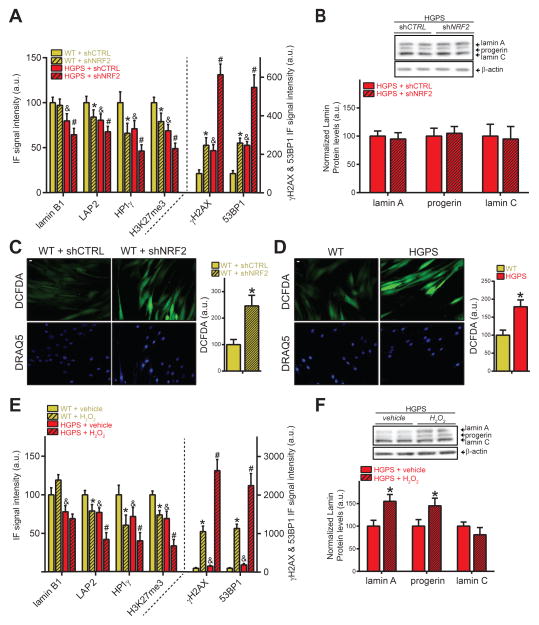
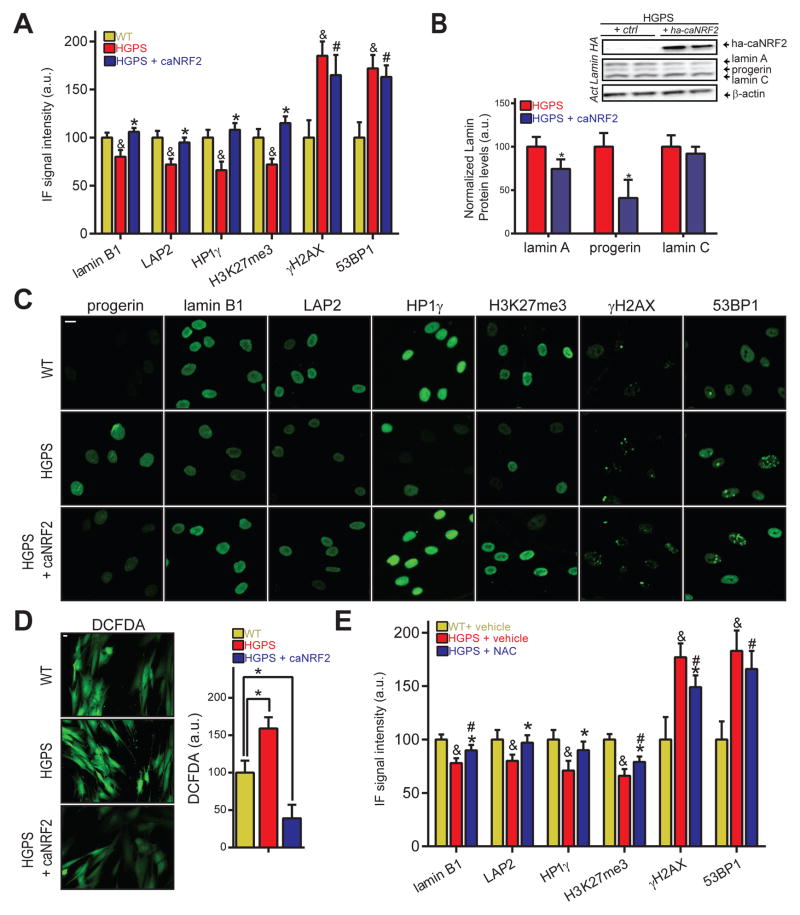
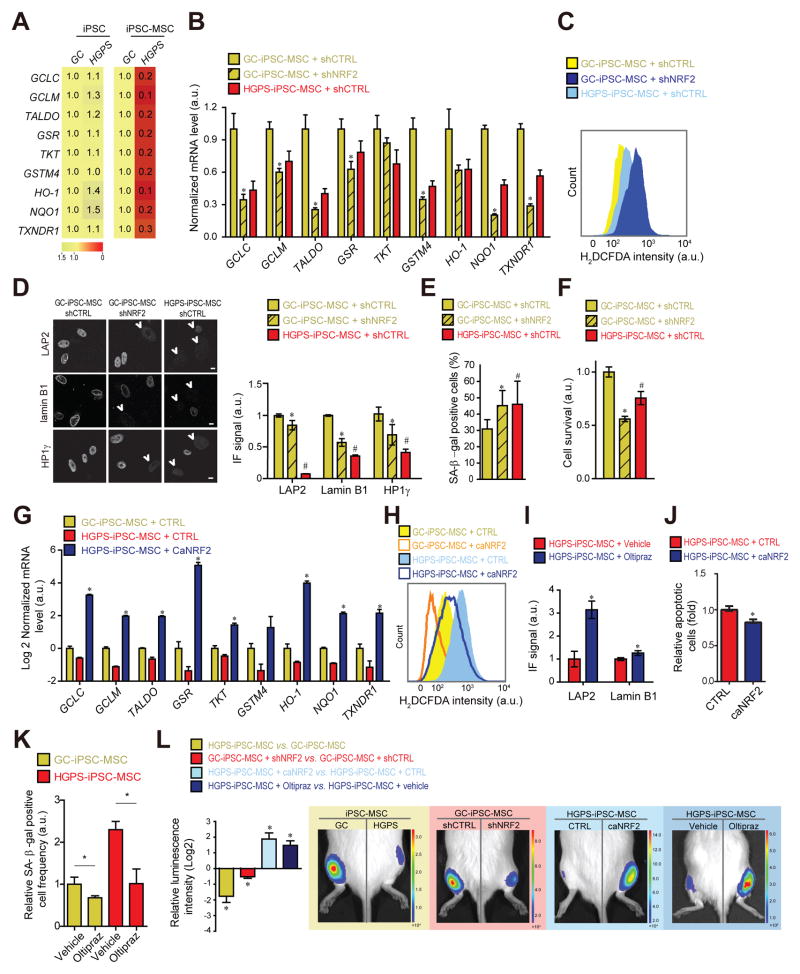
Hutchinson-Gilford progeria syndrome (HGPS) is a rare, invariably fatal premature aging disorder. The disease is caused by constitutive production of progerin, a mutant form of the nuclear architectural protein lamin A, leading, through unknown mechanisms, to diverse morphological, epigenetic, and genomic damage and to mesenchymal stem cell (MSC) attrition in vivo. Using a high-throughput siRNA screen, we identify the NRF2 antioxidant pathway as a driver mechanism in HGPS. Progerin sequesters NRF2 and thereby causes its subnuclear mislocalization, resulting in impaired NRF2 transcriptional activity and consequently increased chronic oxidative stress. Suppressed NRF2 activity or increased oxidative stress is sufficient to recapitulate HGPS aging defects, whereas reactivation of NRF2 activity in HGPS patient cells reverses progerin-associated nuclear aging defects and restores in vivo viability of MSCs in an animal model. These findings identify repression of the NRF2-mediated antioxidative response as a key contributor to the premature aging phenotype.
Keywords: HGPS; NRF2; aging; oxidative stress; progerin.
Published by Elsevier Inc.
Conflict of interest statement
The authors declare no conflicts of interest.
Figures
Comment in
-
Dangerous Entrapment for NRF2.Cell. 2016 Jun 2;165(6):1312-1313. doi: 10.1016/j.cell.2016.05.061. Cell. 2016. PMID: 27259142
Similar articles
-
Nuclear lamins and progerin are dispensable for antioxidant Nrf2 response to arsenic and cadmium.Cell Signal. 2017 May;33:69-78. doi: 10.1016/j.cellsig.2017.02.012. Epub 2017 Feb 14. Cell Signal. 2017. PMID: 28229933 Free PMC article.
-
Cellular stress and AMPK activation as a common mechanism of action linking the effects of metformin and diverse compounds that alleviate accelerated aging defects in Hutchinson-Gilford progeria syndrome.Med Hypotheses. 2018 Sep;118:151-162. doi: 10.1016/j.mehy.2018.06.029. Epub 2018 Jun 28. Med Hypotheses. 2018. PMID: 30037605
-
Vitamin D receptor signaling improves Hutchinson-Gilford progeria syndrome cellular phenotypes.Oncotarget. 2016 May 24;7(21):30018-31. doi: 10.18632/oncotarget.9065. Oncotarget. 2016. PMID: 27145372 Free PMC article.
-
Molecular insights into the premature aging disease progeria.Histochem Cell Biol. 2016 Apr;145(4):401-17. doi: 10.1007/s00418-016-1411-1. Epub 2016 Feb 4. Histochem Cell Biol. 2016. PMID: 26847180 Free PMC article. Review.
-
Hutchinson-Gilford Progeria Syndrome: A premature aging disease caused by LMNA gene mutations.Ageing Res Rev. 2017 Jan;33:18-29. doi: 10.1016/j.arr.2016.06.007. Epub 2016 Jun 29. Ageing Res Rev. 2017. PMID: 27374873 Free PMC article. Review.
Cited by
-
Effect of high-frequency low-intensity pulsed electric field on protecting SH-SY5Y cells against hydrogen peroxide and β-amyloid-induced cell injury via ERK pathway.PLoS One. 2021 Apr 26;16(4):e0250491. doi: 10.1371/journal.pone.0250491. eCollection 2021. PLoS One. 2021. PMID: 33901243 Free PMC article.
-
Association of single nucleotide polymorphisms in the NRF2 promoter with vascular stiffness with aging.PLoS One. 2020 Aug 11;15(8):e0236834. doi: 10.1371/journal.pone.0236834. eCollection 2020. PLoS One. 2020. PMID: 32780748 Free PMC article.
-
The landscape of aging.Sci China Life Sci. 2022 Dec;65(12):2354-2454. doi: 10.1007/s11427-022-2161-3. Epub 2022 Sep 2. Sci China Life Sci. 2022. PMID: 36066811 Free PMC article. Review.
-
DNA repair-related genes and adipogenesis: Lessons from congenital lipodystrophies.Genet Mol Biol. 2022 Nov 7;45(3 Suppl 1):e20220086. doi: 10.1590/1678-4685-GMB-2022-0086. eCollection 2022. Genet Mol Biol. 2022. PMID: 36354755 Free PMC article.
-
Physiological and Pathological Aging Affects Chromatin Dynamics, Structure and Function at the Nuclear Edge.Front Genet. 2016 Aug 23;7:153. doi: 10.3389/fgene.2016.00153. eCollection 2016. Front Genet. 2016. PMID: 27602048 Free PMC article. Review.
References
-
- Andersen JS, Lyon CE, Fox AH, Leung AK, Lam YW, Steen H, Mann M, Lamond AI. Directed proteomic analysis of the human nucleolus. Current biology: CB. 2002;12:1–11. - PubMed
-
- Bloom DA, Jaiswal AK. Phosphorylation of Nrf2 at Ser40 by protein kinase C in response to antioxidants leads to the release of Nrf2 from INrf2, but is not required for Nrf2 stabilization/accumulation in the nucleus and transcriptional activation of antioxidant response element-mediated NAD(P)H:quinone oxidoreductase-1 gene expression. The Journal of biological chemistry. 2003;278:44675–44682. - PubMed
Publication types
MeSH terms
Substances
Grants and funding
LinkOut - more resources
Full Text Sources
Other Literature Sources
Medical
Molecular Biology Databases
