. 2016 Jun 2;165(6):1375-1388.
doi: 10.1016/j.cell.2016.05.050.

Establishing Chromatin Regulatory Landscape during Mouse Preimplantation Development

Affiliations

Establishing Chromatin Regulatory Landscape during Mouse Preimplantation Development

Falong Lu et al. Cell. .

Abstract

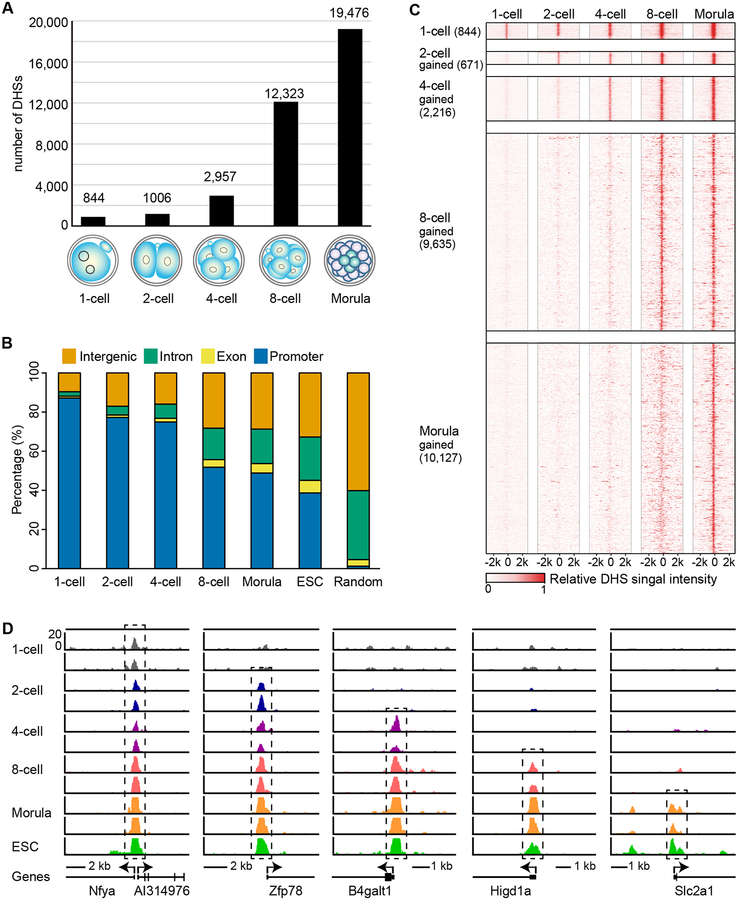
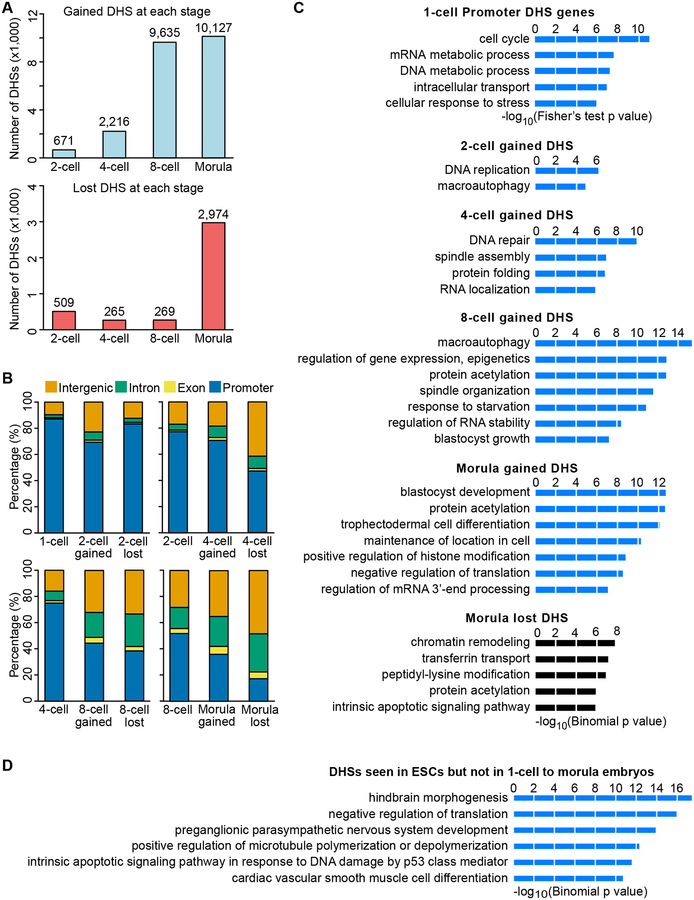
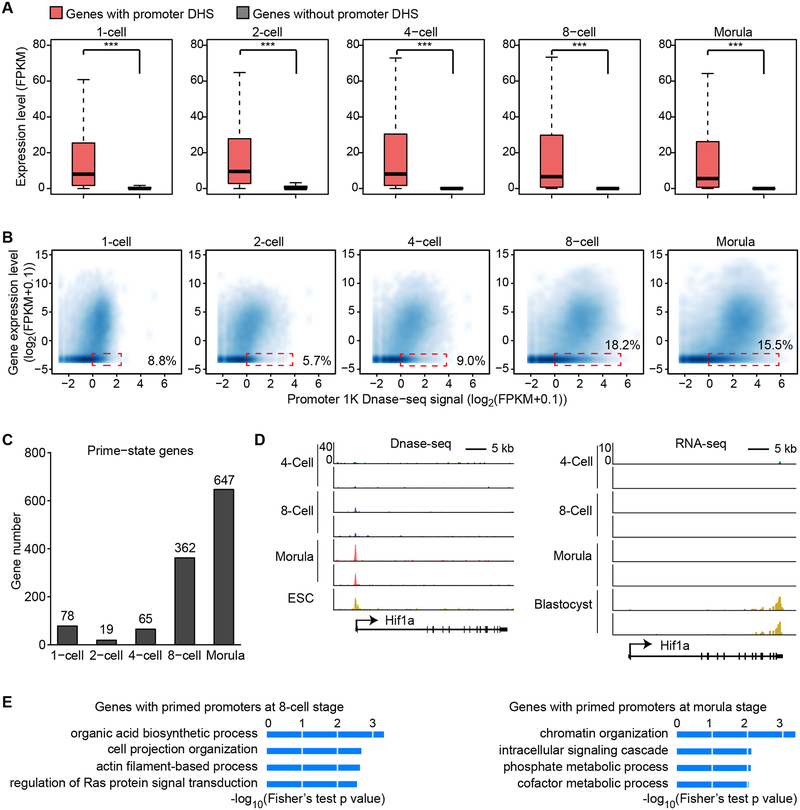
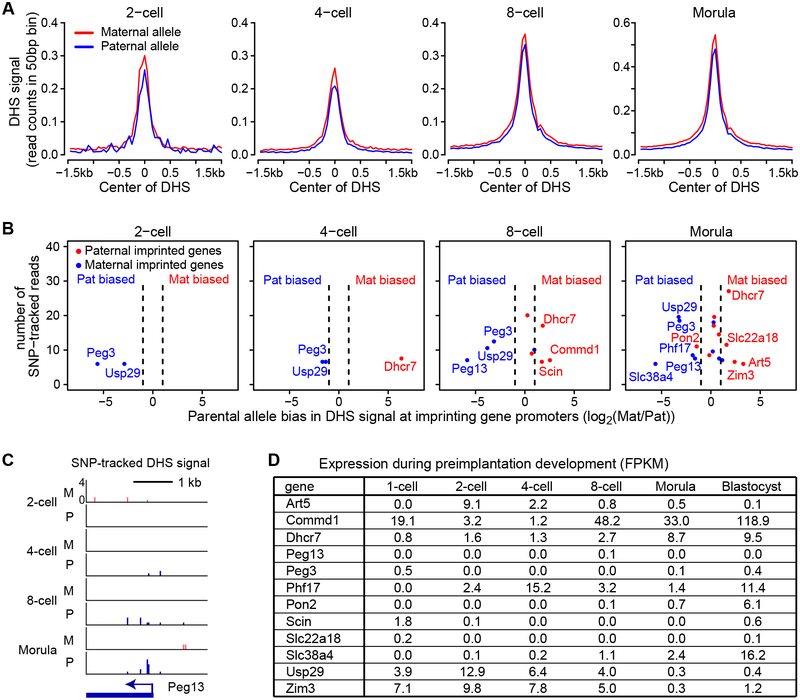
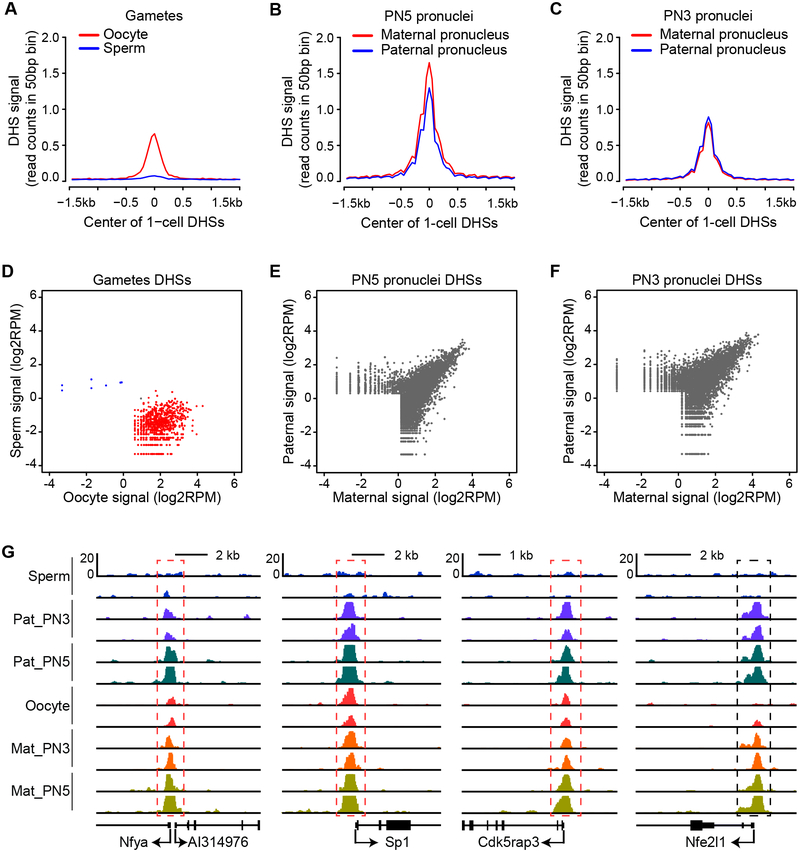
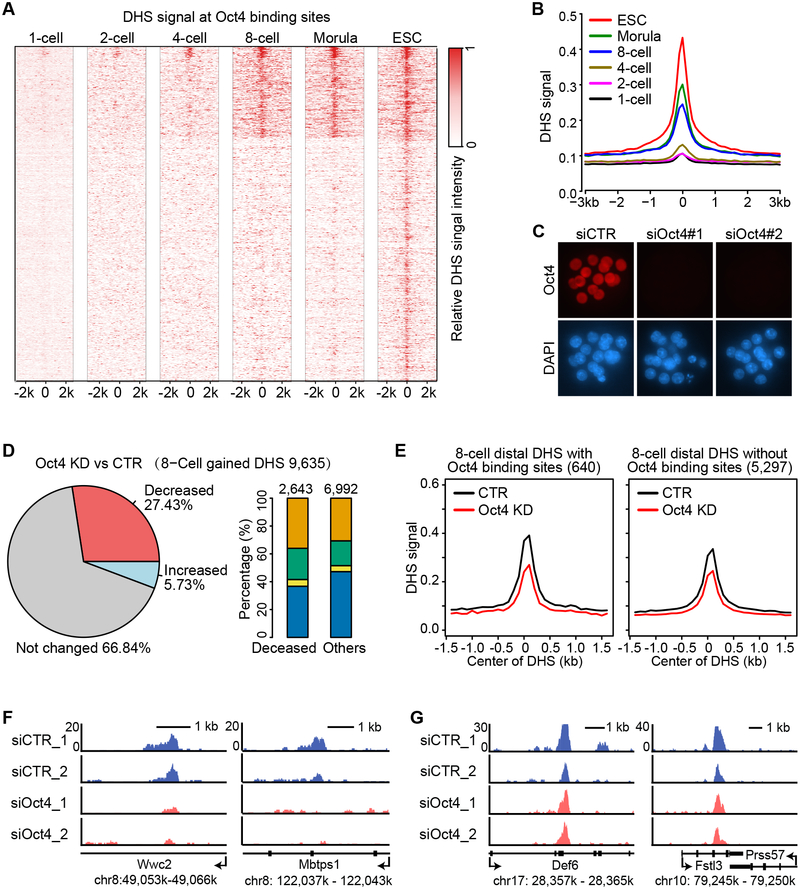
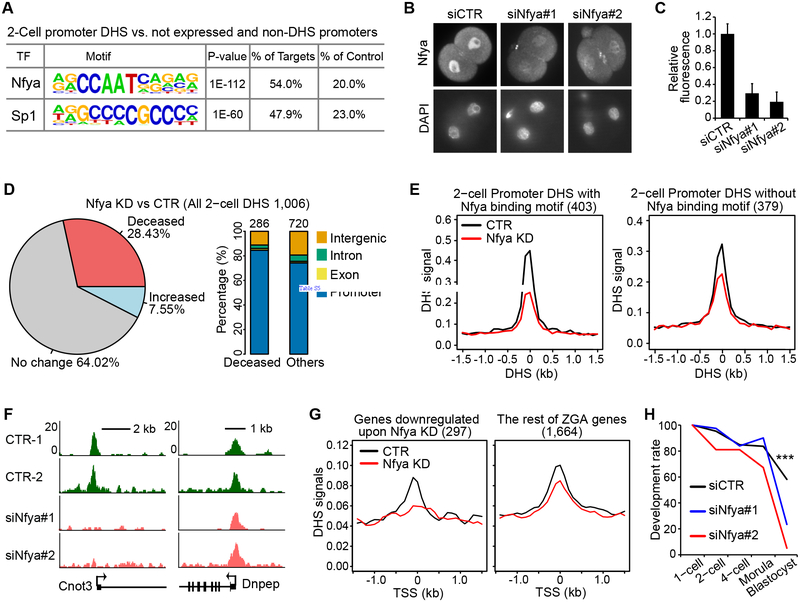
How the chromatin regulatory landscape in the inner cell mass cells is established from differentially packaged sperm and egg genomes during preimplantation development is unknown. Here, we develop a low-input DNase I sequencing (liDNase-seq) method that allows us to generate maps of DNase I-hypersensitive site (DHS) of mouse preimplantation embryos from 1-cell to morula stage. The DHS landscape is progressively established with a drastic increase at the 8-cell stage. Paternal chromatin accessibility is quickly reprogrammed after fertilization to the level similar to maternal chromatin, while imprinted genes exhibit allelic accessibility bias. We demonstrate that transcription factor Nfya contributes to zygotic genome activation and DHS formation at the 2-cell stage and that Oct4 contributes to the DHSs gained at the 8-cell stage. Our study reveals the dynamic chromatin regulatory landscape during early development and identifies key transcription factors important for DHS establishment in mammalian embryos.

Keywords: DNase I hypersensitive sites; Nfya; Oct4; chromatin accessibility; low-input DNase-seq; transcription factor; zygotic genome activation.


Figures

Figure 1.
Figure 1.. DHSs are gradually established during preimplantation development
(A) Bar graphs illustrate the number of DHSs detected at each stage of embryo development. (B) Graph illustrates genomic distribution of the DHSs relative to Refseq annotations. Promoters represent the regions ±0.5 kb around the TSS. (C) Heat map showing that majority of DHSs persist once generated. Each row represents a DHS centered at its summit. The top block shows all the DHSs detected at the 1-cell stage. The following blocks show DHSs gained at the indicated stages. (D) Genome browser view of representative DHSs gained in each developmental stage that are maintained during later stages. Black dashed box indicates DHSs. See also Figure S1, S2, and S3.
Figure 2.
Figure 2.. Dynamics of gaining and losing DHSs during preimplantation development
(A) Bar graph shows the number of gained (upper) and lost (bottom) DHSs at each stage. (B) Bar graph shows genomic distribution of gained and lost DHSs compared to DHS distribution at the previous stage. Promoters represent the regions ±0.5 kb around the TSS. (C) Gene ontology analysis of 1-cell DHSs and DHSs gained at each stage, DHSs lost at the morula stage, and DHSs seen in ESCs but not in 1-cell to morula embryos. DAVID was used for the 1-cell Promoter DHS genes, and GREAT was used for the dynamic DHSs. (D) Gene ontology analysis of DHSs present in ESCs but not in 1-cell to morula embryos. GREAT was used for the GO analysis. The enriched terms are ranked by–log10(p-value).
Figure 3.
Figure 3.. DNase accessibility marks promoters that are active or primed for activation in later stages
(A) Box plot showing the expression level of genes with or without promoter DHSs. Boxes and whiskers represent the 25th/75th and 2.5th/97.5th percentiles, respectively. The difference between the two groups are statistically significant by Wilcoxon rank sum test (*** denotes p < 0.001). (B) Scatter plot showing the correlation between gene expression level and promoter DNase I hypersensitivity signal. Dashed red rectangles represent non-expressed genes (RNA-seq FPKM < 0.1) harboring promoter DHS signals (DNase-seq RPM > 1). (C) Bar graph showing number of genes with promoter DHSs that are transcriptionally inactive at the indicated stage but are activated in the following stage (primed-state). (D) Genome browser view of Hif1a locus as a representative example of primed-state genes. DNase-seq signal is shown on the left. RNA-seq data is shown on the right. (E) Gene ontology analysis of primed-state genes at the 8-cell and morula stages using DAVID. The enriched terms are ranked by–log10(p-value). See also Figure S4.
Figure 4.
Figure 4.. Imprinting gene promoters show allelic-biased accessibility prior to the onset of allelic expression
(A) SNP-tracking analysis shows that the average DHS signals from the JF1 allele (paternal) and the BDF1 allele (maternal) are similar. The DHS signal was plotted at DHSs detected at each stage. (B) Promoters of imprinted genes show allelic-biased DNase I accessibility. Shown are the imprinted genes whose promoters harbor SNP-trackable DHSs. The X-axis represents the fold difference of the DHS signal between the two alleles. The Y-axis represents the average number of SNP tracked reads of the two replicates. The dashed lines represent 2-fold difference cutoff for calculating the parental bias. Blue and red indicate paternal and maternal bias, respectively. (C) Genome browser view of DHS signal at a maternal imprinted gene, Peg13. SNP tracked paternal and maternal DHS signals are shown. M, maternal allele; P, paternal allele. (D) Expression of the imprinted genes listed in panel B during preimplantation development. See also Figure S5.
Figure 5:
Figure 5:. Rapid reprogramming of the paternal chromatin accessibility upon fertilization
(A) Oocytes and sperm show differential accessibility. The plot shows the DHSs signal detected in sperm and GV-stage oocytes at 1-cell DHSs. (B) Paternal and maternal genomes exhibit similar accessibility at PN5 stage. (C) Paternal and maternal genomes exhibit similar accessibility at PN3 stage. The plot shows the average DHS signals of the parental pronuclei at 1-cell DHSs. (D) Scatter plot showing that the two gametes have very different DHS signals. DHSs detected in both gametes are combined and plotted. Blue and red dots represent DHSs differentially detected in sperm and oocytes, respectively (FC>2). (E) Scatter plot showing DHS signals detected in the PN5 pronuclei. DHSs detected in the two parental pronuclei are combined and plotted. (F) Scatter plot showing DHS signals detected in the PN3 pronuclei. (G) Genome browser view of representative DHSs in gametes and pronuclei. Red dashed boxes indicate DHSs present in both pronuclei and oocytes. Black dashed box indicates DHS presented in pronuclei but not in gametes.
Figure 6.
Figure 6.. Oct4 contributes to distal DHS establishment at the 8-cell stage
(A) Heat map showing that presumable Oct4 binding sites become accessible starting from the 8-cell stage. Each row is centered at the mid-point of an Oct4 binding site identified in ESCs. (B) Average DHS signals at the presumable Oct4 binding sites showing a marked increase at the 8-cell stage. (C) Representative images of morula embryos stained with anti-Oct4 (red) and DAPI (blue) showing that Oct4 protein is efficiently depleted by siRNA injection. More than 5 embryos per group were examined. (D) A large proportion of 8-cell gained DHSs are decreased (FC > 2) upon Oct4 KD. Pie-chart (left) shows the proportion of DHSs decreased, increased, or unchanged upon Oct4 KD. Bar graph (right) shows the genomic distribution of either decreased or the rest of DHSs. Orange, green, yellow, and blue represent intergenic, intron, exon, and promoter regions, respectively. (E) Average DHS signals at 8-cell distal DHSs with or without presumed Oct4 binding sites in control (CTR) and Oct4 KD 8-cell embryos. (F) Representative loci containing presumed Oct4 binding sites with reduced distal DHS upon Oct4 KD. (G) Representative loci without presumed Oct4 binding sites with distal DHS unaffected by Oct4 KD. See also Figure S6.
Figure 7.
Figure 7.. Nfya is involved in shaping promoter DHSs and ZGA at 2-cell embryos
(A) Nfya binding motif is the most enriched DNA motif at 2-cell promoter DHSs. The background (control) used are promoters of genes that are neither expressed nor accessible. (B) Representative images of 2-cell embryos stained with anti-Nfya (top) and DAPI (bottom) showing that Nfya protein is efficiently reduced by siRNA injection. (C) Quantification of the fluorescent signal of Nfya staining in control (siCTR) and Nfya KD 2-cell embryos. The total numbers of embryos quantified were 10, 11, and 7, respectively. Error bars indicate s.d. (D) Pie-chart (left) shows a large proportion of 2-cell promoter DHSs is decreased (FC > 2) upon Nfya KD. Bar graph (right) shows the genomic distribution of decreased DHSs. (E) Average DHS signals at 2-cell promoter DHSs with (left) or without (right) the Nfya binding motif. The promoter DHS peaks are centered. (F) A representative locus of promoters with the Nfya binding motif (Cnot3 gene promoter) shows loss of DHS upon Nfya KD (left). A representative example of promoters without Nfya binding motif (Dnpep gene promoter) shows little change upon Nfya KD (right). (G) Downregulated genes upon Nfya KD show decreased promoter DHSs. Genes activated at the 2-cell stage were divided into 2 groups; those downregulated upon Nfya KD (FC >1.5) and the rest of the genes (Figure S7C and S7D). Average promoter DHS signals were plotted for each group. The plots are centered at TSSs. (H) Nfya is required for preimplantation development. Graph shows the percentage of embryos reaching the indicated stages. The numbers of embryos examined were 86 (siCTR), 81 (siNfya#1), and 58 (siNfya#2). *** denotes p < 0.001 (Fisher’s chi-squire test). See also Figure S7.

References

    1. Ahmed K, Dehghani H, Rugg-Gunn P, Fussner E, Rossant J, and Bazett-Jones DP (2010). Global chromatin architecture reflects pluripotency and lineage commitment in the early mouse embryo. PloS one 5, e10531. - PMC - PubMed
    1. Bell O, Tiwari VK, Thoma NH, and Schubeler D (2011). Determinants and dynamics of genome accessibility. Nature reviews Genetics 12, 554–564. - PubMed
    1. Boyle AP, Davis S, Shulha HP, Meltzer P, Margulies EH, Weng Z, Furey TS, and Crawford GE (2008). High-resolution mapping and characterization of open chromatin across the genome. Cell 132, 311–322. - PMC - PubMed
    1. Buenrostro JD, Giresi PG, Zaba LC, Chang HY, and Greenleaf WJ (2013). Transposition of native chromatin for fast and sensitive epigenomic profiling of open chromatin, DNA-binding proteins and nucleosome position. Nature methods 10, 1213–1218. - PMC - PubMed
    1. Buenrostro JD, Wu B, Litzenburger UM, Ruff D, Gonzales ML, Snyder MP, Chang HY, and Greenleaf WJ (2015). Single-cell chromatin accessibility reveals principles of regulatory variation. Nature 523, 486–490. - PMC - PubMed

Publication types