. 2016 Jun 2;165(6):1416-1427.
doi: 10.1016/j.cell.2016.05.046.

Modulated Expression of Specific tRNAs Drives Gene Expression and Cancer Progression

Affiliations

Modulated Expression of Specific tRNAs Drives Gene Expression and Cancer Progression

Hani Goodarzi et al. Cell. .

Abstract

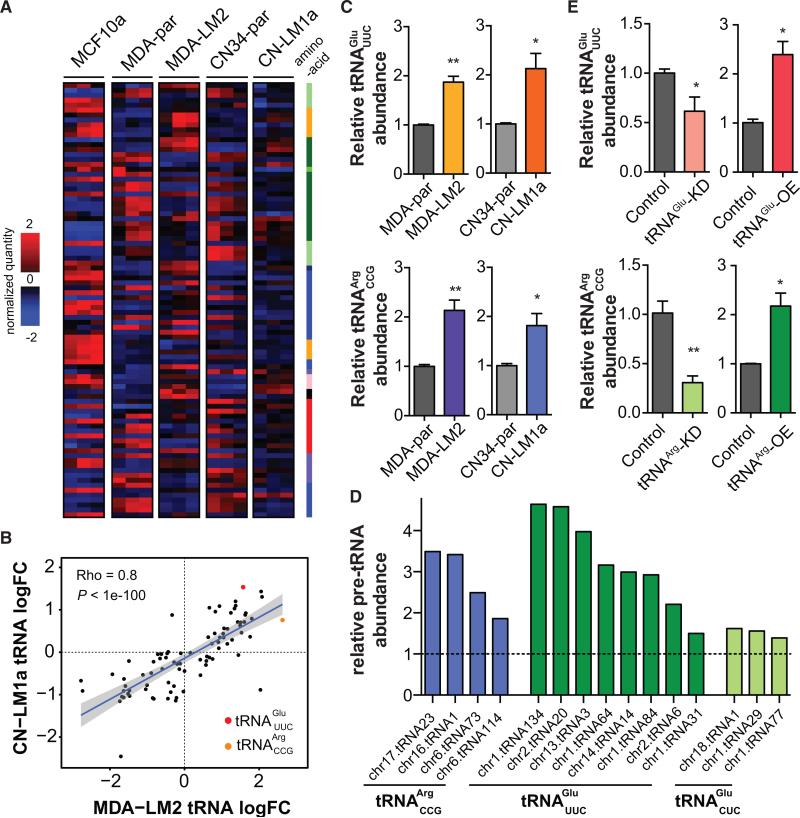
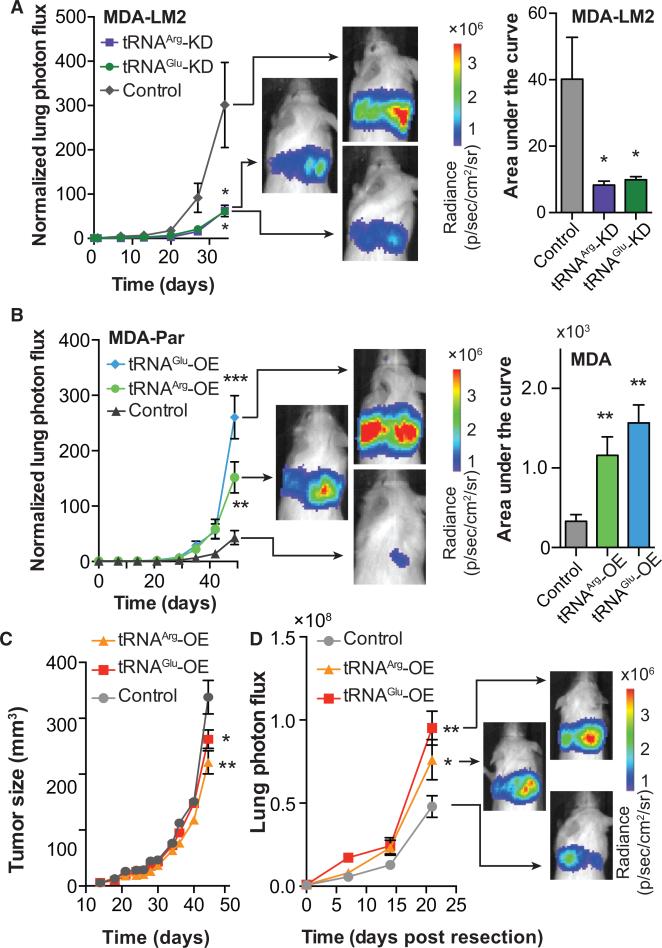
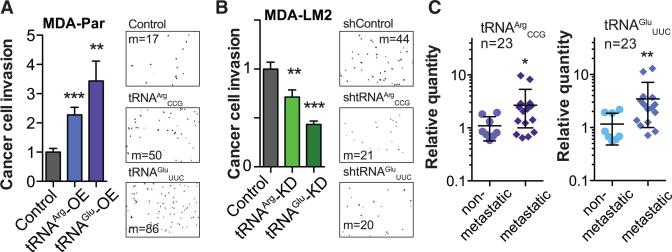
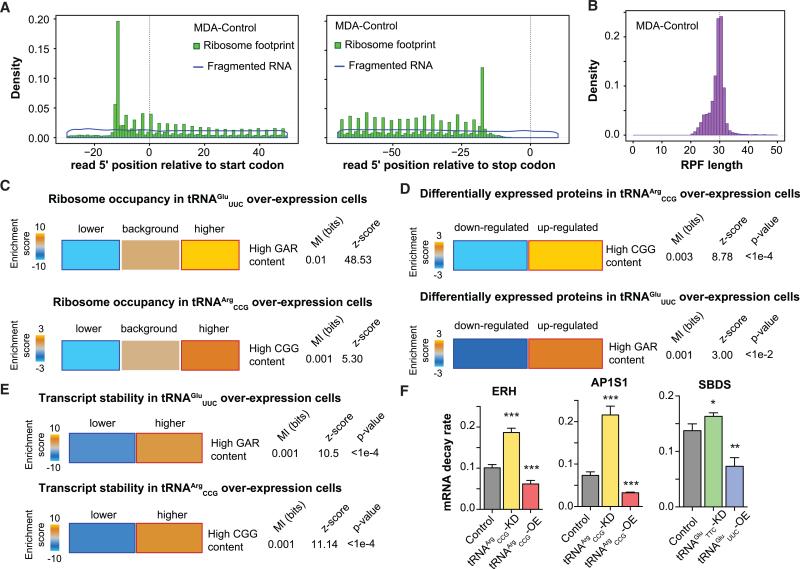
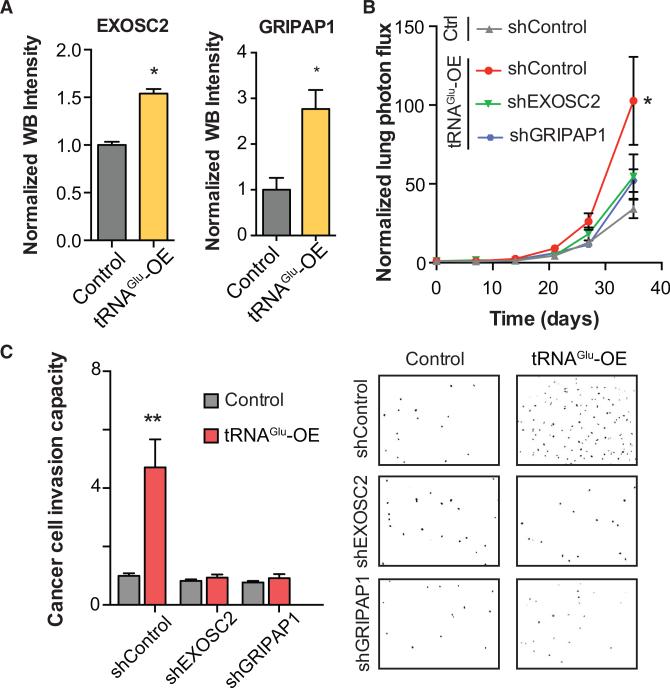
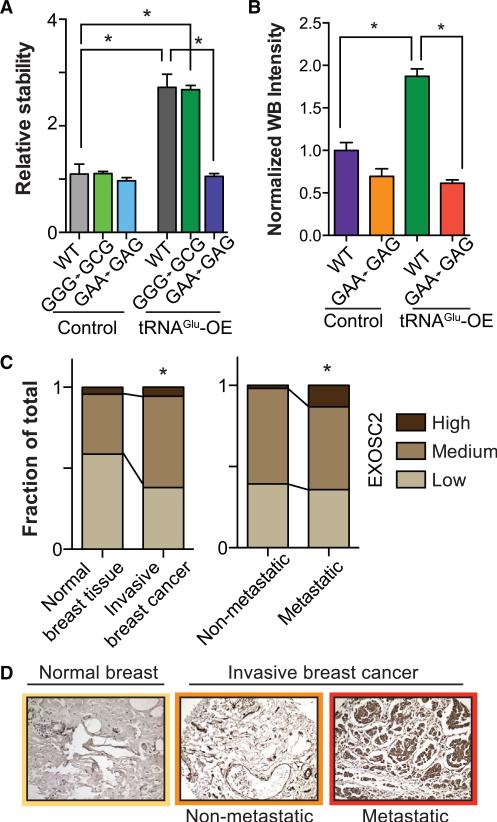
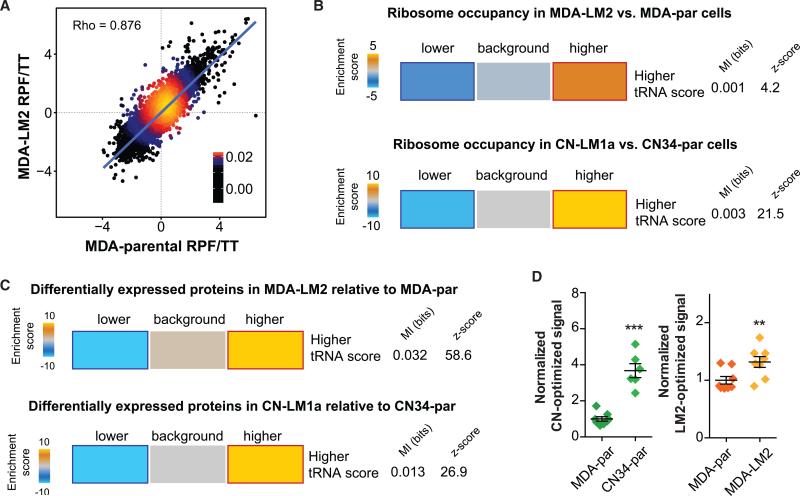
Transfer RNAs (tRNAs) are primarily viewed as static contributors to gene expression. By developing a high-throughput tRNA profiling method, we find that specific tRNAs are upregulated in human breast cancer cells as they gain metastatic activity. Through loss-of-function, gain-of-function, and clinical-association studies, we implicate tRNAGluUUC and tRNAArgCCG as promoters of breast cancer metastasis. Upregulation of these tRNAs enhances stability and ribosome occupancy of transcripts enriched for their cognate codons. Specifically, tRNAGluUUC promotes metastatic progression by directly enhancing EXOSC2 expression and enhancing GRIPAP1-constituting an "inducible" pathway driven by a tRNA. The cellular proteomic shift toward a pro-metastatic state mirrors global tRNA shifts, allowing for cell-state and cell-type transgene expression optimization through codon content quantification. TRNA modulation represents a mechanism by which cells achieve altered expression of specific transcripts and proteins. TRNAs are thus dynamic regulators of gene expression and the tRNA codon landscape can causally and specifically impact disease progression.


Figures

Figure 1
Figure 1. Transfer RNA Profiling of Metastatic and Non-metastatic Breast Cancer Lines
(A) Whole-genome tRNA profiling was performed for MCF10a, MDA-par, MDA-LM2, CN34-par, and CN-LM1a cell lines. Hierarchical clustering was used to cluster the resulting profiles. The tRNAs are labeled based on their cognate amino acid: A, G: light green; C: green; D, E, N, Q: dark green; I, L, M, V: blue; F, W, Y: lilac; H: dark blue; K, R: orange; P: pink; S, T: red. (B) Correlation plot for changes in tRNA levels between MDA-LM2 and CN-LM1a cells. Strong positive correlation suggests these two distinct metastatic derivatives employ similar approach in modulating tRNA levels to attain metastatic phenotypes. TRNAArgCCG and tRNAGluUUC are among the most highly upregulated in both MDA-LM2 and CN-LM1a. (C) Quantitative PCR-based tRNA quantification validated the changes in the abundance of tRNAArgCCG and tRNAGluUUC in metastatic MDA-LM2 and CN-LM1a cells relative to their respective parental lines. (D) Relative pre-tRNA abundances for tRNAArgCCG and tRNAGluUUC across multiple genetic loci as determined by quantitative RT-PCR. tRNAGluCUC, pre-tRNAs for which deregulated expression was not observed, were also included for comparison. (E) TRNAGluUUC and tRNAArgCCG were successfully overexpressed and knocked down as revealed by quantitative PCR. Note that manipulation of the levels of these two tRNAs occurs within the physiological boundaries of the parental or metastatic backgrounds. One-tailed Student's t test was used to measure statistical significance between the two samples in each experiment. Error bars indicate SEM. *p < 0.05 and **p < 0.01.
Figure 2
Figure 2. tRNAGluUUC and tRNAArgCCG Promote Metastatic Breast Cancer
(A) Bioluminescence imaging plot of lung colonization by MDA-LM2 cells expressing short hairpins targeting tRNAGluUUC, tRNAArgCCG, or a control hairpin (shControl); n = 5 in each cohort. Area-under-the-curve was also calculated for each mouse. (B) Bioluminescence imaging plot of lung colonization by tRNAGluUUC or tRNAArgCCG overexpressing lines, as compared to control in MDA-parental cells; n = 5 in each cohort. Area-under-the-curve was also calculated for each mouse. (C) Primary tumor growth measurement after orthotopic injection of Control, tRNAGluUUC, or tRNAArgCCG overexpressing cells into the mammary fat pads of mice; n = 5 in each cohort. (D) Orthotopic metastasis bioluminescence imaging plot of mice after primary tumor resection; n = 5 in each cohort. For comparing lung colonization, primary tumor growth, and orthotopic metastasis assays, two-way ANOVA was used to measure statistical significance. One-tailed Mann-Whitney test was used to measure statistical significance between the areas under the curves. Error bars indicate SEM. *p < 0.05, **p < 0.01, and ***p < 0.001.
Figure 3
Figure 3. In Vitro Characterization of tRNAGluUUC and tRNAArgCCG and Their Clinical Associations with Breast Cancer Progression
(A) Overexpression of tRNAGluUUC or tRNAArgCCG in MDA-parental cells significantly increased cancer cell invasion. Also included are representative fields from the invasion inserts along with the median number of cells observed in each cohort. (B) Conversely, tRNAGluUUC or tRNAArgCCG knockdown in MDA-LM2 cells significantly decreased cancer cell invasion. Also included are representative fields from the invasion inserts along with the median number of cells observed in each cohort. (C) The relative abundance of tRNAArgCCG and tRNAGluUUC in primary breast tumor samples from patients who either developed metastatic relapse (n = 15) or remained disease-free (n = 8), measured using quantitative PCR. One-tailed Mann-Whitney test was used to establish statistical significance between the two cohorts. Error bars indicate SEM. *p < 0.05, **p < 0.01, and ***p < 0.001.
Figure 4
Figure 4. Post-Transcriptional Consequences of tRNAGluUUC and tRNAArgCCG Upregulation
(A) A hallmark of ribosome profiling libraries is a 3-nt periodicity. As an example, we have included the coverage of the 5′-end of reads along the coding sequence with respect to the start (left) or stop codon (right). In comparison, the total RNA library (fragmented RNA) did not exhibit this periodicity. (B) Given the footprint of ribosomes on mRNAs, ribosome protected fragments (RPF) of ~30-nt are expected. Here, as an example, we have shown the RPF length distribution for our control samples. (C) Genes with higher GAR and CGG contents exhibited significant enrichment among transcripts with increased ribosomal occupancy in tRNAGluUUC and tRNAArgCCG overexpressing cells, respectively. (D) Genes with a high abundance of GAG and GAA (GAR) codons were significantly enriched among proteins significantly upregulated (corrected for their transcript changes) in tRNAGluUUC overexpression cells. Similarly, genes with higher CGG content exhibited a significant enrichment among the proteins upregulated (after correction for transcript changes) upon overexpression of tRNAArgCCG. The statistical significance of these enrichments was assessed using mutual-information calculations and associated Z score (based on randomized input vectors). Also included is the χ2 p value for the associated contingency table. The heatmap was generated using the –log of the hypergeometric p value for enrichment and log of p value for depletion (collectively termed the enrichment score). The red and dark-blue borders indicate the statistical significance of the calculated hypergeometric p values (for details, see Goodarzi et al., 2009). (E) Whole-genome transcript stability measurements reveal significant enrichment for genes with higher GAR content among those strongly stablized in tRNAGluUUC overexpressing line. Similarly, stability of transcripts with higher CGG content is also significantly enhanced in the context of tRNAArgCCG overexpression. (F) ERH, AP1S1, and SBDS were chosen to validate by qRT-PCR the impact overexpressing or knocking down corresponding tRNAs has on mRNA stability as a function of decay rate.
Figure 5
Figure 5. Variations in tRNAGluUUC Levels Post-Transcriptionally Modulate Expression of Breast Cancer Metastasis Promoters EXOSC2 and GRIPAP1
(A) Endogenous EXSOC2 and GRIPAP1 protein levels as measured by quantitative western blotting (see Experimental Procedures) in tRNAGluUUC overexpressing or control lines. (B) Bioluminescence imaging plot of lung colonization by EXOSC2 and GRIPAP1 knocked-down cells in MDA-parental overexpressing tRNAGluUUC relative to control cells expressing a control hairpin, shControl; n = 5 in each cohort. Two-way ANOVA was used to measure statistical significance. (C) Knockdown of EXOSC2 or GRIPAP1 abrogated the enhanced invasion capacity of tRNAGluUUC overexpressing line. Also included are representative fields from the invasion inserts along with the median number of cells observed in each cohort. Error bars indicate SEM. *p < 0.05 and **p < 0.01 by one-tailed Student's t test.
Figure 6
Figure 6. Codon-Specific Modulation of EXOSC2 and Its Clinical Association
(A) Relative transcript stability measured by qRT-PCR (see Experimental Procedures) of exogenous wild-type, GGG-to-GCG (Gly) codon mutated, and GAA-to-GAG (Glu) codon mutated transcript in control and tRNAGluUUC overexpressing backgrounds. While overexpression of tRNAGluUUC significantly stabilized wild-type and GGG-to-GCG (negative control) transcripts, such an effect was absent when the specific cognate Glu codons were mutated. (B) Quantitative western blot demonstrated similar loss of translational enhancement brought about by overexpressing tRNAGluUUC when its cognate codons were mutated. Error bars indicate SEM. *p < 0.05 by one-tailed Student's t test. (C) Stacked bars representing the fraction of tissue samples from TMA with respectively low, medium, and high intensity of EXOSC2 in normal breast tissues and invasive breast cancer tissues (n = 46 and 160, respectively). Also shown are fractions of tissues of different EXOSC2 intensity in breast cancer from patients without metastasis and those with detected metastasis in distant organs (n = 107 and 53, respectively). Hypergeometric p values were calculated to assess the significance of the increase in the frequency of samples with higher intensities; *p < 0.05. (D) Shown are representative tissue-microarray immunohistochemical images of stained tissues of median score from normal breast, non-metastatic invasive breast cancer, and metastatic breast cancer tissues. Higher EXOSC2 intensity positively correlated with disease progression stage.
Figure 7
Figure 7. tRNA Preference Scores Were Informative of Differential Ribosome Occupancy and Protein Expression
(A) As an example, we have shown the linear regression of MDA-parental and MDA-LM2 ribosome protected fragment to total RNA ratio (RPF/TT). RPF reads were normalized to TT reads to correct for variation in transcript expression in each cell line. (B) Genes with positive tRNA preference score (based on derivative versus parental tRNA profiling results) were significantly enriched among transcripts with higher corrected ribosome occupancy values in both MDA-LM2 and CN-LM1a relative to MDA-par and CN34-par, respectively (see Experimental Procedures). In other words, coding sequences with more favorable codon content, based on changes in tRNA abundance between parental cells and their highly metastatic derivatives, exhibited a more active translation. (C) Genes with positive tRNA preference score were significantly enriched among the proteins upregulated in MDA-LM2 cells and CN-LM1a compared to MDA-par and CN34-par, respectively. The significance of these enrichments was determined by calculating mutual-information values and their associated Z scores (based on randomized input values). Also included is the χ2 p value for the associated contingency table. The enrichment score, based on which the heatmap was generated, is defined as the –log of hypergeometric p value for enrichment (gold) and log of p value for depletion (blue). The red and dark-blue borders indicate the statistical significance of the calculated hypergeometric p values (Goodarzi et al., 2009). (D) Normalized relative luciferase activity for CN-optimized and LM2-optimized luciferase constructs.

Comment in

  • A Pro-metastatic tRNA Pathway.
    Kuscu C, Dutta A. Kuscu C, et al. Cell. 2016 Jun 2;165(6):1314-1315. doi: 10.1016/j.cell.2016.05.066. Cell. 2016. PMID: 27259143

References

    1. Begley U, Dyavaiah M, Patil A, Rooney JP, DiRenzo D, Young CM, Conklin DS, Zitomer RS, Begley TJ. Trm9-catalyzed tRNA modifications link translation to the DNA damage response. Mol. Cell. 2007;28:860–870. - PMC - PubMed
    1. Chan CT, Dyavaiah M, DeMott MS, Taghizadeh K, Dedon PC, Begley TJ. A quantitative systems approach reveals dynamic control of tRNA modifications during cellular stress. PLoS Genet. 2010;6:e1001247. - PMC - PubMed
    1. Coller J, Parker R. General translational repression by activators of mRNA decapping. Cell. 2005;122:875–886. - PMC - PubMed
    1. Comeron JM. Selective and mutational patterns associated with gene expression in humans: influences on synonymous composition and intron presence. Genetics. 2004;167:1293–1304. - PMC - PubMed
    1. Dever TE, Green R. The elongation, termination, and recycling phases of translation in eukaryotes. Cold Spring Harb. Perspect. Biol. 2012;4:a013706. - PMC - PubMed

Publication types

MeSH terms