. 2016 Jun 2;165(6):1519-1529.
doi: 10.1016/j.cell.2016.04.027.

Direct Identification of Hundreds of Expression-Modulating Variants using a Multiplexed Reporter Assay

Affiliations

Direct Identification of Hundreds of Expression-Modulating Variants using a Multiplexed Reporter Assay

Ryan Tewhey et al. Cell. .

Erratum in

Abstract

Although studies have identified hundreds of loci associated with human traits and diseases, pinpointing causal alleles remains difficult, particularly for non-coding variants. To address this challenge, we adapted the massively parallel reporter assay (MPRA) to identify variants that directly modulate gene expression. We applied it to 32,373 variants from 3,642 cis-expression quantitative trait loci and control regions. Detection by MPRA was strongly correlated with measures of regulatory function. We demonstrate MPRA's capabilities for pinpointing causal alleles, using it to identify 842 variants showing differential expression between alleles, including 53 well-annotated variants associated with diseases and traits. We investigated one in detail, a risk allele for ankylosing spondylitis, and provide direct evidence of a non-coding variant that alters expression of the prostaglandin EP4 receptor. These results create a resource of concrete leads and illustrate the promise of this approach for comprehensively interrogating how non-coding polymorphism shapes human biology.


Figures

Figure 1
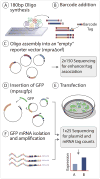
Figure 1. Overview of the MPRA workflow
(A) Oligos are synthesized as 180 mers followed by cleavage off of the array. (B) The ssDNA is amplified, barcoded and converted to dsDNA by emulsion PCR which is then cloned into a reporter vector which has had the reporter gene removed to create the mpra:Δorf library (C). The plasmid library is linearized between the barcode and oligo sequence by restriction digest and a minimal promoter and GFP open reading frame is inserted by gibson assembly to create the final mpra:gfp library (D) which is used for transfection into the desired cell type (E). RNA is harvested from the transfected cells, mRNA is captured, sequenced (F) and barcode counts are compared to the count estimates from the sequencing of the mpra:orf library (D).
Figure 2
Figure 2. Experimental reproducibility
(A) Correlation of normalized oligo counts between two transfection replicates of NA12878. (B) Average normalized oligo counts for all five plasmid replicates compared to normalized counts for the five replicates from NA12878 RNA. Axis across all plots were kept constant with subplots added when additional datapoint were excluded from the main plot (A & B). Blue boxes within the inserts signify the displayed area of the main plots. (C) Luciferase assay validation of estimated effect sizes for individual oligos tested by MPRA. Each point represents the average of 8 MPRA and 4 qPCR replicates. qPCR values were normalized to two non-significant sequences (green points) as determined by MPRA. Blue points: significantly expressed sequences from MPRA; cyan point: marginally significant sequence. Correlation is provided as Pearson's R. (D) Coefficient of variation between experimental replicates as a product of the number of barcodes tagging an oligo.
Figure 3
Figure 3. Validation of expression modifying sequences discovered by MPRA
(A) Distribution of effect sizes (log2 of the RNA/plasmid ratio) for oligos that were detected as being under or over expressed. (B) Log2(odds ratio) for the enrichment of regulatory annotations in the 3432 MPRA active sequences within LCLs relative to non-active sequences. (C) Log2(odds ratio) for the enrichment in LCL DHS sites for active sequences shared between LCLs and HepG2s (blue), active in only LCLs (red) and active in only HepG2 cells (green). Asterisk: fisher's test p-value < 0.01.
Figure 4
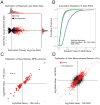
Figure 4. Expression-modulating variant (emVar) reproducibility and effect size distribution
(A) Distribution of expression strength (x-axis) and allelic skew (y-axis) for all 29k variants. (B) Cumulative distribution of the absolute difference of the log2 fold change between the reference and alternate allele for emVars (blue), expression positive variants that were not detected as emVars (green) and all other variants (red). (C) Allelic skew as measured by MPRA for 127 positive controls values discovered in the original 79k library (x-axis) that were tested in the 7.5k library (y-axis). (D) Comparison of allelic skew as estimated from the mean of 2 independent LCLs (NA12878 & NA19239). Red points in both plots denote variants called as emVars from the joint LCL analysis. Correlation is provided as Pearson's R.
Figure 5
Figure 5. emVar concordance with existing measures of allelic effect
(A) Proportion of variants by their MPRA classification that fall in an ENCODE transcription factor (TF) ChIP-seq peak and contain the predicted motif. Variants are binned according to the difference in predicted binding strength between the two alleles. (For multiple TF associations, the one with the largest delta is used). (B) MPRA skew estimates for LCL emVars with TF motif/ChIP annotations compared to the predicted change in binding between the two alleles. (C) Comparison between skew seen in MPRA and that in DHS for all emVars passing stringent filters for high-confidence DHS skew sites (methods). Skew is calculated as log2(Alt-allele counts / Ref-allele counts). (D) Overlap between annotation-positive sites (methods), sequences detected as regulatory by MPRA and emVars. (E) Proportion of EUR eQTLs explained by an emVar plotted against the difference in variance explained between the top variant and the second strongest association in the EUR eQTL analysis. grey line: all emVars, solid red line: annotation positive emVars, dashed red line: annotation negative emVars. All Correlations are provided as Pearson’s R.
Figure 6
Figure 6. emVars associated with ankylosing spondylitis and systemic lupus erythematosus
(A) Plot of the PTGER4 locus which overlaps a GWAS peak for ankylosing spondylitis displaying ChIA-PET and ENCODE annotations (top 6 tracks), observed allelic skew (track 7) and expression strength (track 8) from MPRA. Significant variants for expression (blue) and skew (red) in the MPRA data indicated by color; black: non-significant. (B) MPRA expression values of the PTGER4 variant rs9283753 in LCL's normalized to the plasmid library. (C) LCL eQTL results in EUR and YRI populations for the PTGER4 with rs9283753. (D & E) PTGER4 expression as measured by qPCR for two LCL's that underwent allelic replacement at rs9283753. (F) Plot of the FAM167A-BLK locus associated with systemic lupus erythematosus. (G) MPRA expression values of the chr8:11353110 deletion variant in LCL's normalized to the plasmid library. (H & I) LCL eQTL results in EUR and YRI populations for the FAM167A and BLK associations.

References

    1. Andersson R, Gebhard C, Miguel-Escalada I, Hoof I, Bornholdt J, Boyd M, Chen Y, Zhao X, Schmidl C, Suzuki T, et al. An atlas of active enhancers across human cell types and tissues. Nature. 2014;507:455–461. - PMC - PubMed
    1. Arnold, Gerlach, Stelzer, Boryn, Rath, Stark Genome-Wide Quantitative Enhancer Activity Maps Identified by STARR-seq. Science. 2013;339:1074–1077. - PubMed
    1. Barrett JC, Hansoul S, Nicolae DL, Cho JH, Duerr RH, Rioux JD, Brant SR, Silverberg MS, Taylor KD, Barmada MM, et al. Genome-wide association defines more than 30 distinct susceptibility loci for Crohn's disease. Nat Genet. 2008;40:955–962. - PMC - PubMed
    1. Claussnitzer M, Dankel SN, Kim KHH, Quon G, Meuleman W, Haugen C, Glunk V, Sousa IS, Beaudry JL, Puviindran V, et al. FTO Obesity Variant Circuitry and Adipocyte Browning in Humans. The New England Journal of Medicine. 2015;373:895–907. - PMC - PubMed
    1. Consortium, T. An integrated encyclopedia of DNA elements in the human genome. Nature. 489:57–74. - PMC - PubMed

Publication types