. 2016 Jun 2;165(6):1530-1545.
doi: 10.1016/j.cell.2016.04.048.

Systematic Functional Dissection of Common Genetic Variation Affecting Red Blood Cell Traits

Affiliations

Systematic Functional Dissection of Common Genetic Variation Affecting Red Blood Cell Traits

Jacob C Ulirsch et al. Cell. .

Abstract

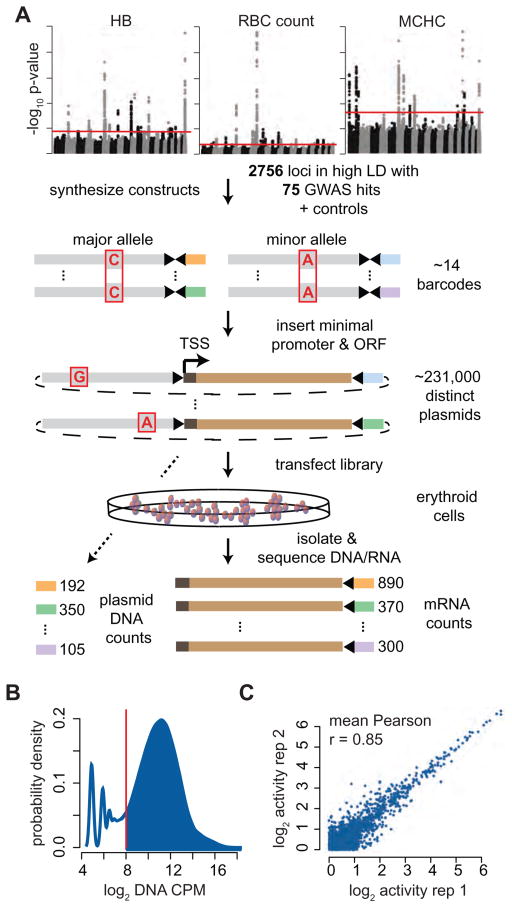
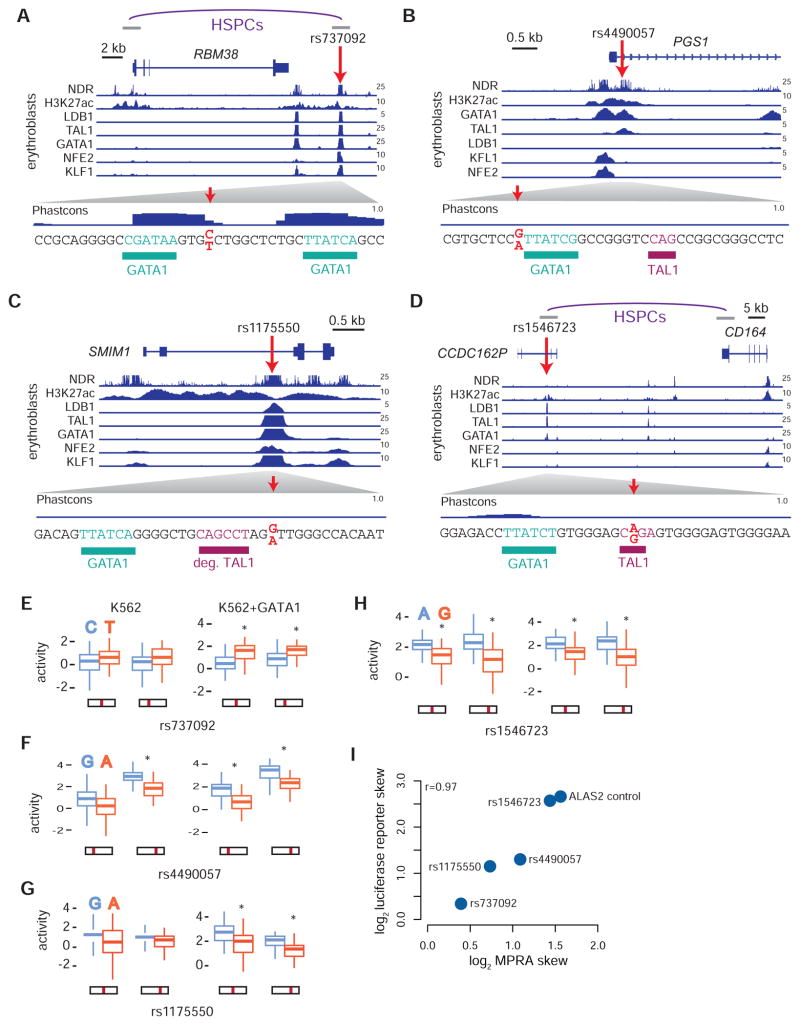
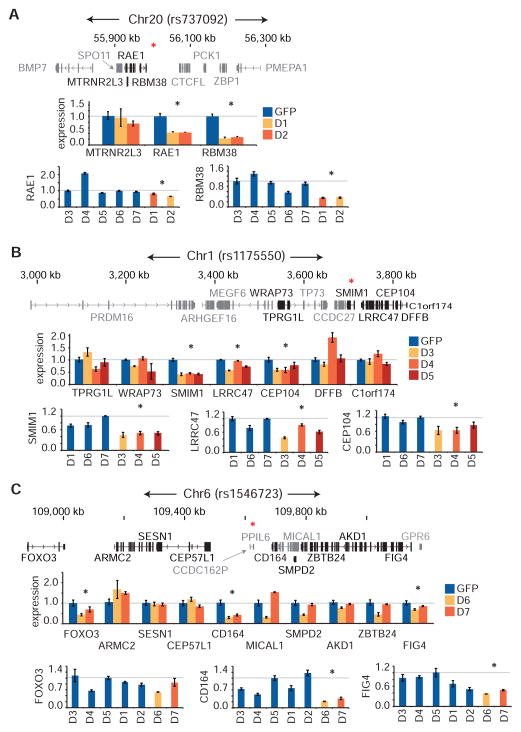
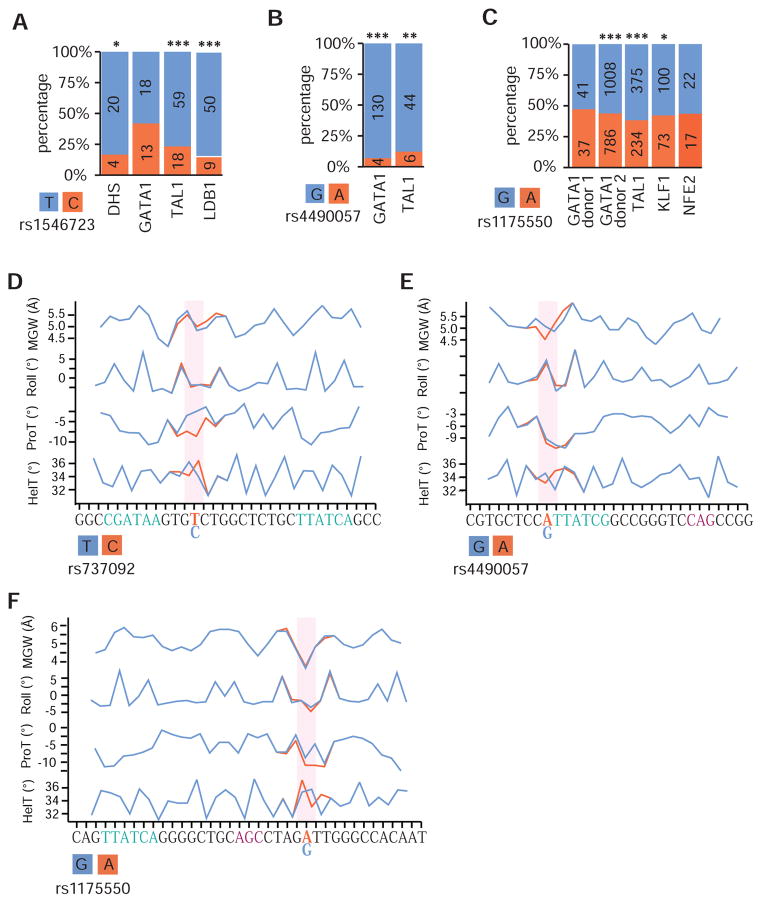
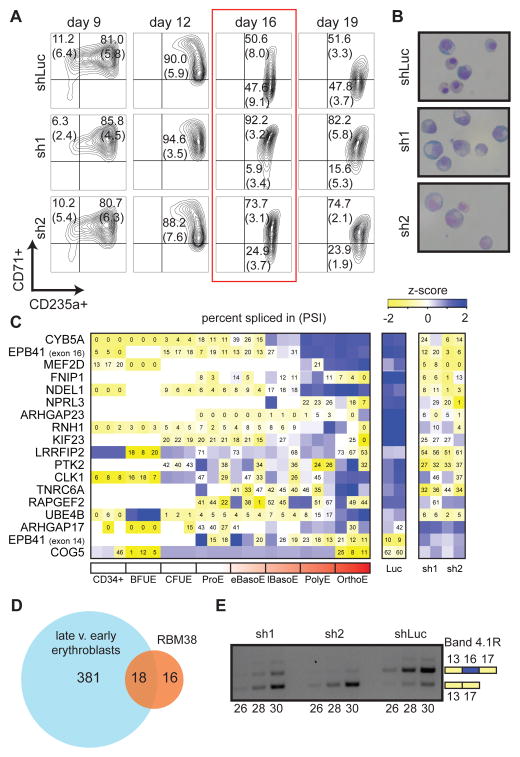
Genome-wide association studies (GWAS) have successfully identified thousands of associations between common genetic variants and human disease phenotypes, but the majority of these variants are non-coding, often requiring genetic fine-mapping, epigenomic profiling, and individual reporter assays to delineate potential causal variants. We employ a massively parallel reporter assay (MPRA) to simultaneously screen 2,756 variants in strong linkage disequilibrium with 75 sentinel variants associated with red blood cell traits. We show that this assay identifies elements with endogenous erythroid regulatory activity. Across 23 sentinel variants, we conservatively identified 32 MPRA functional variants (MFVs). We used targeted genome editing to demonstrate endogenous enhancer activity across 3 MFVs that predominantly affect the transcription of SMIM1, RBM38, and CD164. Functional follow-up of RBM38 delineates a key role for this gene in the alternative splicing program occurring during terminal erythropoiesis. Finally, we provide evidence for how common GWAS-nominated variants can disrupt cell-type-specific transcriptional regulatory pathways.


Figures

Figure 1
Figure 1. Designing and verifying a massively parallel reporter assay as a GWAS screening tool
(A) Overview of the massively parallel reporter assay. Oligonucleotides separately containing each variant were synthesized with restriction enzyme cut sites and multiple barcodes, a minimal promoter and ORF were ligated between the sites, and the pooled plasmid library containing ~231,000 constructs was transfected into erythroid cells. (B) Greater than 80% of bar codes were highly represented in the plasmid library. (C) Representative plot showing MPRA activity (mRNA/DNA) is highly correlated between 2 replicates for the top 50% of constructs with minimal transcriptional capacity. The average Pearson correlations across all 6 K562 and 4 K562+GATA1 replicates (compared separately) is reported.
Figure 2
Figure 2. Red blood cell trait associated variants are enriched for erythroid regulatory regions
(A–B) Cell type enrichment for specifically expressed genes proximal to GWAS hits. Triangular heatmaps of tissue similarity are shown for the Pearson correlations of each tested tissue set and enrichment scores are represented as −log10 p-values. Only cell types reaching a minimum enrichment are plotted. (C) Similarity of DHS peaks across 54 cell types is shown as a triangular heatmap of the Jaccard statistic. Bar plots show the percentage of GWAS hits such that at least one variant in high LD with each tag SNP overlaps with open chromatin in each of the 54 cell types. (D) Regions of open chromatin in HEPs and K562 cells are highly overlapping based upon hierarchical clustering of the 54 cell types in (C). Nearly 75% of the variants in high LD with GWAS hits that fall within open chromatin in HEPs are also in open chromatin in K562 cells. (E) Based upon RNA-seq, K562 gene expression is highly correlated (Pearson r) with that of early HEPs (proerythroblasts, ProEs, and basophilic erythroblasts, BasoEs), while more mature HEPs (polychromatic erythroblasts, PolyEs, and orthochromatic erythroblasts, OrthoEs) show distinct expression profiles. (F) Occupancy by GATA1, TAL1, NFE2, and nucleosome-depleted regions (NDRs) across the GATA1 locus is similar for both HEPs and K562 cells. (G) GATA1 gene expression is similar between early HEPs and K562 cells but increases substantially in mature HEPs. (H and I) Gene Set Enrichment Analyses (GSEA) indicate that K562 cells overexpressing GATA1 exhibit an increased expression of GATA1 target genes, resulting in an overall more mature erythroid gene expression signature. The enrichment score is plotted from GSEA. (J) Upon overexpression of GATA1, multiple erythroid TFs and GATA1 co-factors are upregulated in K562 cells.
Figure 3
Figure 3. Identifying erythroid regulatory elements and MPRA functional variants
(A) Activity boxplots of the 5 unique positive control variants. Constructs with intact GATA1 binding sites (Ref) show increased activity when compared with broken binding sites (Mut). (B) Kernel densities for positive controls as well as for ACs and nACs containing GWAS variants. ACs represent 4% (555/15612) of the MPRA library. (C) Presence or absence of specific 6-mers can effectively be used to discriminate between ACs and nACs using a support vector machine model. (D) The 6-mers that are most strongly weighted towards ACs are similar to ETS/FLI1, GATA1, TAL1, CREB, and NFE2/AP1 motifs. (E) ACs are enriched for erythroid DHS as well as for occupancy sites of the erythroid TFs, GATA1 and TAL1, when compared to low activity constructs (nACs) and ~10,000 background sentinel GWAS hits. (F) Overlap of ACs with sites of open chromatin across multiple cell types. (G) 32 MPRA functional variants (MFVs) representing 23 GWAS hits (median 1 / GWAS hit) were identified based upon differential activity between the major and minor alleles. (insert) Absolute fold change sizes comparing construct pairs meeting the 1% FDR cutoff for MFVs vs. all other constructs. (H) Similar to (E), except for MFVs. (I) Similar to (F), except for MFVs and the enrichment is computed for MFVs compared to ~10,000 background GWAS hits. (J) The group of MPRA functional variant (MFV) constructs is significantly enriched for constructs with dosage-dependent GATA1 activity. (K) Ref, but not Mut, GATA1 binding sites show increased activity upon GATA1 overexpression. (L) Correlations between MRPA and DeepSea (trained on K562 DNase I hypersensitivity) fold change is shown for all MFVs. MPRA fold change was calculated as the mean across all sliding windows (K562+GATA1 fold change shown). (M) Similar to (L), except for the gkmer-SVM algorithm.
Figure 4
Figure 4. Delineating the genomic context of the MFVs rs737092, rs4490057, rs1175550, and rs1546723
(A–D) Location of the variants rs737092 (A), rs4490057 (B), rs1175550 (C) and rs1546723 (D) are shown in context with the neighboring genes. Nucleosome depleted regions (NDRs), H3K27ac histone modifications, and transcription factor occupancy profiles for LDB1, TAL1, GATA1, NFE2 and KLF1 are displayed for HEPs in normalized reads per million. Predicted TF binding sites are highlighted proximal to the MFV. (A,D) Interactions between a promoter and HindIII fragment identified from promoter capture Hi-C in CD34+ hematopoietic stem and progenitor cells (HSPCs) are shown. (E–H) Activity scores for minor and major alleles of rs737092 (E), rs4490057 (F), rs1175550 (G) and rs1546723 (H) in the MPRA for the early (K562) and late (K562+GATA1) erythroid progenitor models are shown as boxplots. Position of the variant in the reporter construct is indicated. *False discovery rate (FDR) < 1%. (I) Correlations between max MPRA fold change estimates for allelic skew in K562 cells and individual luciferase reporter fold change estimates.
Figure 5
Figure 5. Altered gene expression in clonal isogenic deletions of rs737092, rs1175550, and rs1546723
(A–C) Small clonal deletions were made in K562s across rs737092 (clones D1, D2), rs1175550 (clones D3, D4, D5), and rs1546723 (clones D6, D7) using CRISPR-Cas9 genome editing. Control clones were generated by transfecting Cas9 and pLKO.1 GFP constructs. Quantitative RT-PCR analysis of genes within a ~1 megabase wingspan of rs737092 (A), rs1175550 (B) and rs1546723 (C) and expressed over a minimum threshold (FPKM > 2, genes not meeting threshold are in grey) in HEPs was performed. A Bonferroni correction was applied at each locus. A red asterisk (*) indicates the position of the MFV.
Figure 6
Figure 6. Allele specific binding of erythroid transcription factors in individuals heterozygous for MFVs
(A–C) The percentage of reads from ChIP-seq experiments in HEP cells derived from heterozygous donors mapping to either to the major (orange) or minor (blue) alleles is shown for rs1546723 (A), rs4490057 (B) and rs1175550 (C). In each case, allelic skew across all heterozygous donors for the bound erythroid TFs are consistent with the directionality of each variant in the MPRA. (D–F) A machine learning algorithm was applied to predict changes in the DNA shape (MGW, minor groove width; Roll, DNA roll; HelT, helix twist; and ProT, propeller twist) at surrounding nucleotides for rs737092 (D), rs4490057 (E), and rs1175550 (F). *p-value < 0.05, **p-value < 0.001, ***p-value < 10−8 from a two-tailed Student’s t-test.
Figure 7
Figure 7. RBM38 is required for a subset of alternative splicing events during terminal human erythropoiesis
(A) We used two independent short hairpin RNAs (sh1 and sh2) to knockdown RBM38 along with one control hairpin (shLuc). FACS analyses of erythroid markers CD71 and CD235a indicate a block in differentiation that occurs at day 16 and continues into day 19. Percentage of live cells in each quadrant is represented by a mean and standard deviation across three replicate experiments from independent donors (two replicates at day 19). (B) Representative images of May-Grunwald-Giemsa stained cytospins at day 16 of culture (63X objective in oil). (C and D) RNA-seq was performed on cDNA derived from day 16 cells. A heatmap of exons with a > 20% change in percentage spliced in (PSI) shared between RBM38 knockdown and normal erythropoiesis is shown in (C). A Venn diagram of the number of differentially spliced exons shared between normal human erythropoiesis and RBM38 knockdown is shown in (D). (E) Semi-quantitative RT-PCR verifies the loss of EPB41 exon 16 inclusion following RBM38 knockdown at day 16 of differentiation.

References

    1. Bauer DE, Kamran SC, Lessard S, Xu J, Fujiwara Y, Lin C, Shao Z, Canver MC, Smith EC, Pinello L, et al. An erythroid enhancer of BCL11A subject to genetic variation determines fetal hemoglobin level. Science. 2013;342:253–257. - PMC - PubMed
    1. Campagna DR, de Bie CI, Schmitz-Abe K, Sweeney M, Sendamarai AK, Schmidt PJ, Heeney MM, Yntema HG, Kannengiesser C, Grandchamp B, et al. X-linked sideroblastic anemia due to ALAS2 intron 1 enhancer element GATA-binding site mutations (vol 89, pg 315, 2014) Am J Hematol. 2014;89:670–670. - PMC - PubMed
    1. Claussnitzer M, Dankel SN, Kim KH, Quon G, Meuleman W, Haugen C, Glunk V, Sousa IS, Beaudry JL, Puviindran V, et al. FTO Obesity Variant Circuitry and Adipocyte Browning in Humans. The New England journal of medicine. 2015;373:895–907. - PMC - PubMed
    1. Claussnitzer M, Dankel SN, Klocke B, Grallert H, Glunk V, Berulava T, Lee H, Oskolkov N, Fadista J, Ehlers K, et al. Leveraging cross-species transcription factor binding site patterns: from diabetes risk loci to disease mechanisms. Cell. 2014;156:343–358. - PMC - PubMed
    1. Conboy JG, Chasis JA, Winardi R, Tchernia G, Kan YW, Mohandas N. An isoform-specific mutation in the protein 4.1 gene results in hereditary elliptocytosis and complete deficiency of protein 4.1 in erythrocytes but not in nonerythroid cells. J Clin Invest. 1993;91:77–82. - PMC - PubMed

Publication types