An official website of the United States government
The .gov means it’s official.
Federal government websites often end in .gov or .mil. Before
sharing sensitive information, make sure you’re on a federal
government site.
The site is secure.
The https:// ensures that you are connecting to the
official website and that any information you provide is encrypted
and transmitted securely.
1 Key Laboratory of Hepatosplenic Surgery, Ministry of Education, Department of General Surgery, The First Affiliated Hospital of Harbin Medical University, Harbin, China.
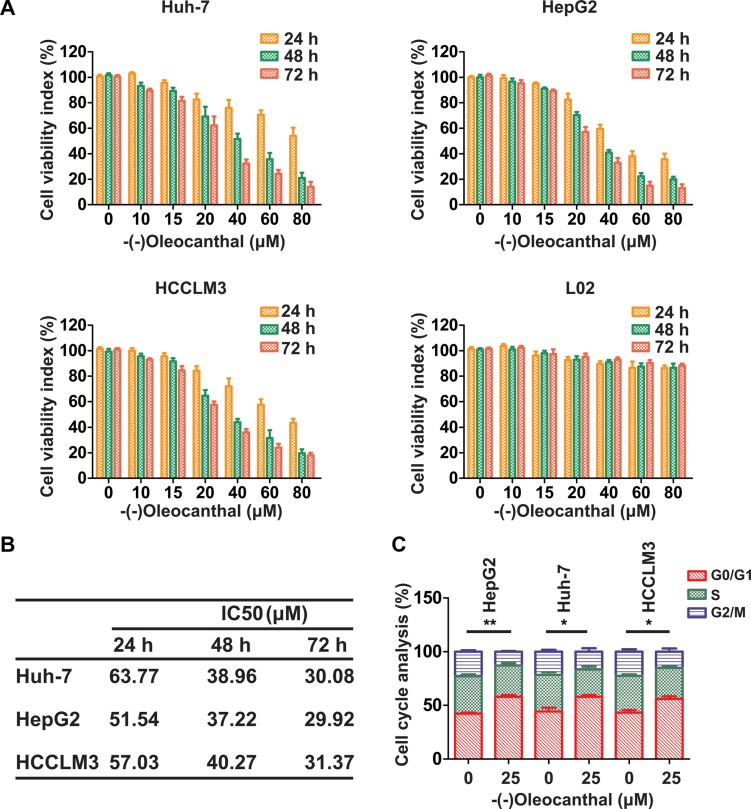
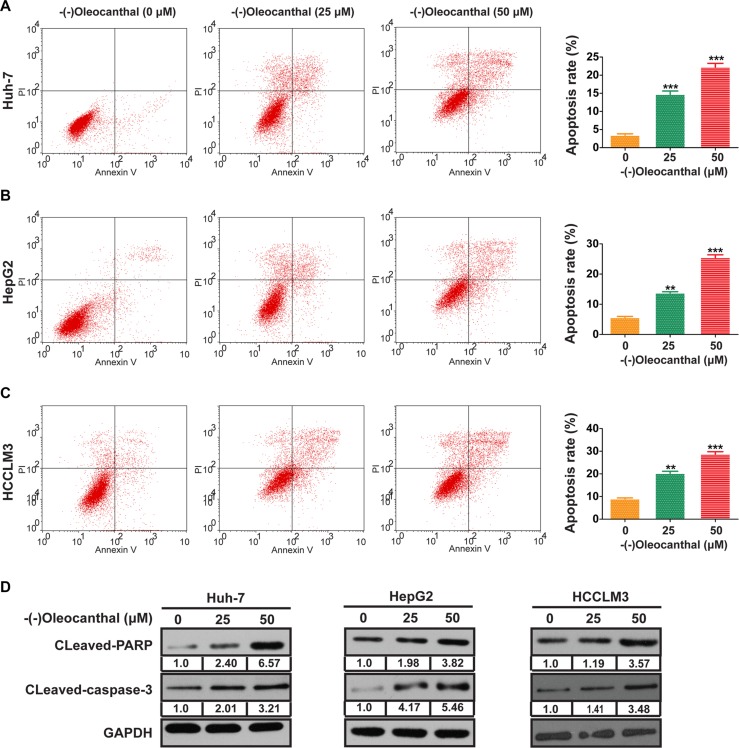
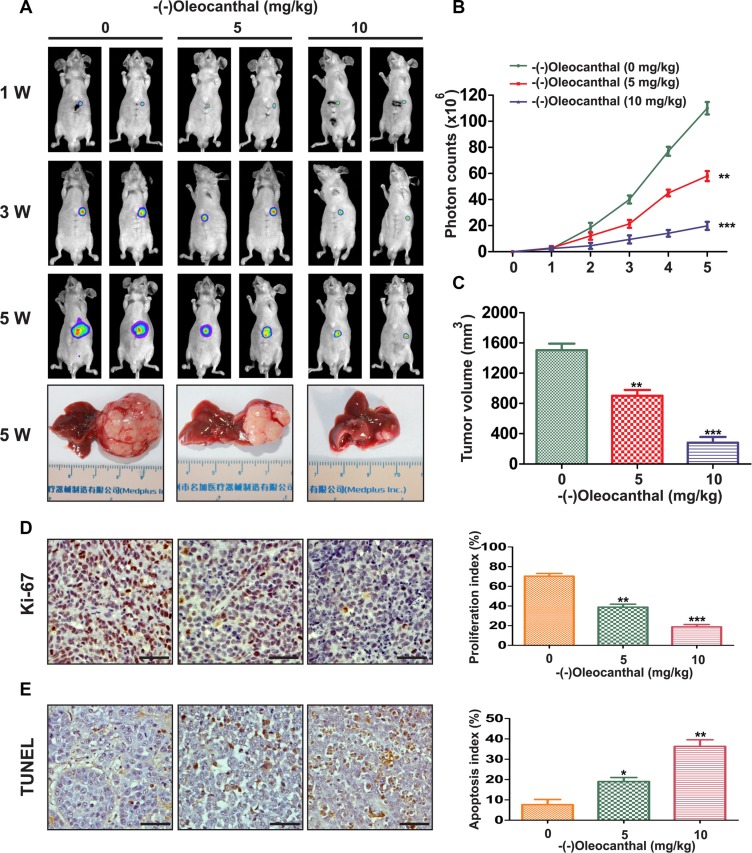
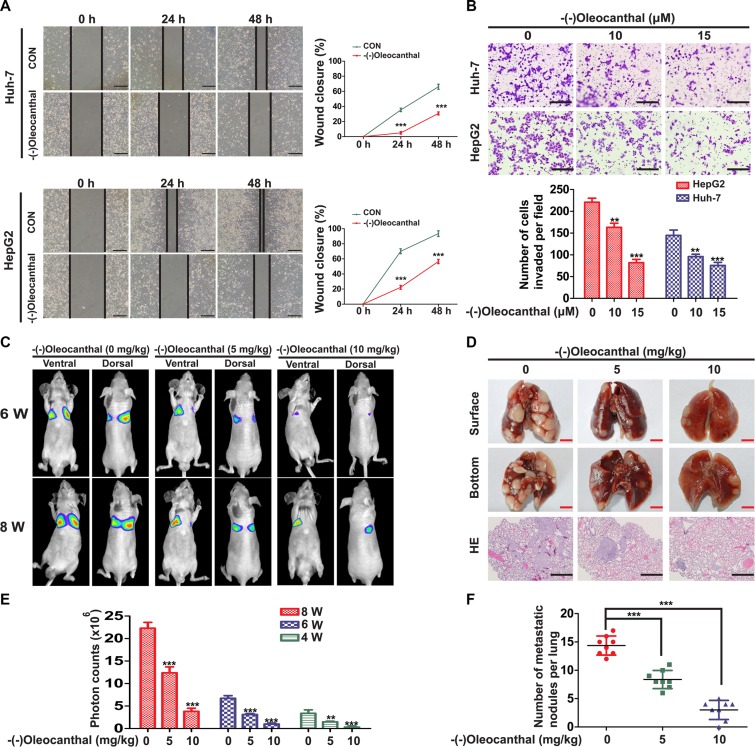
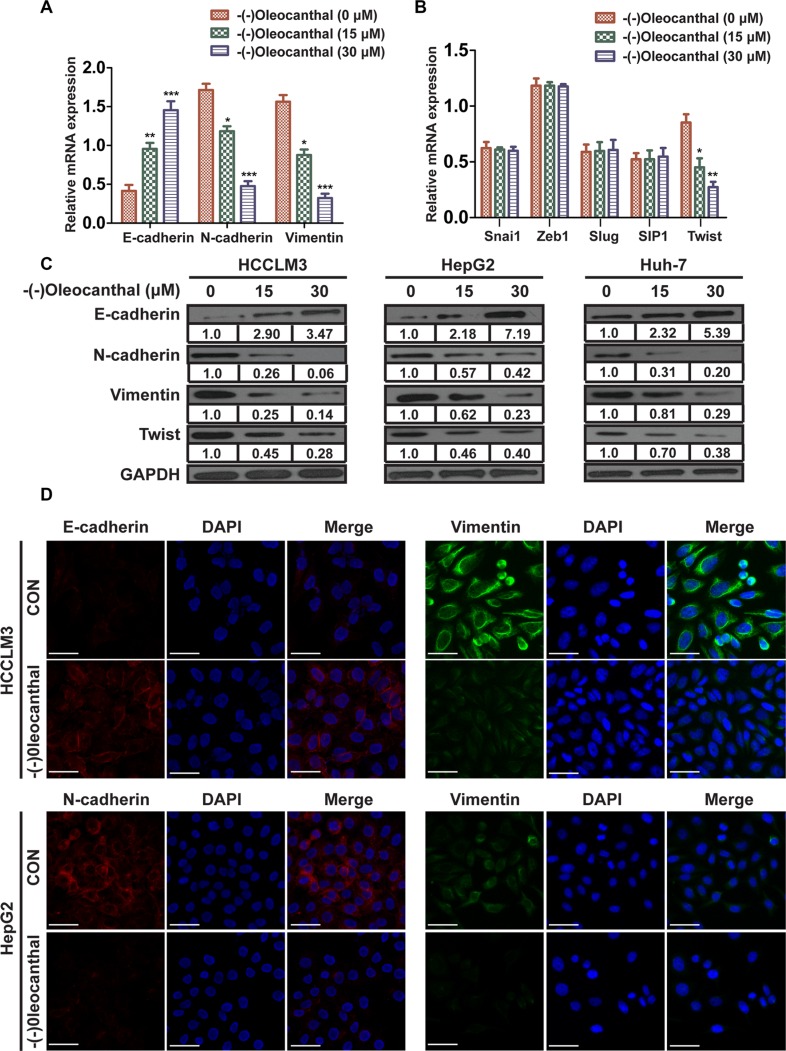
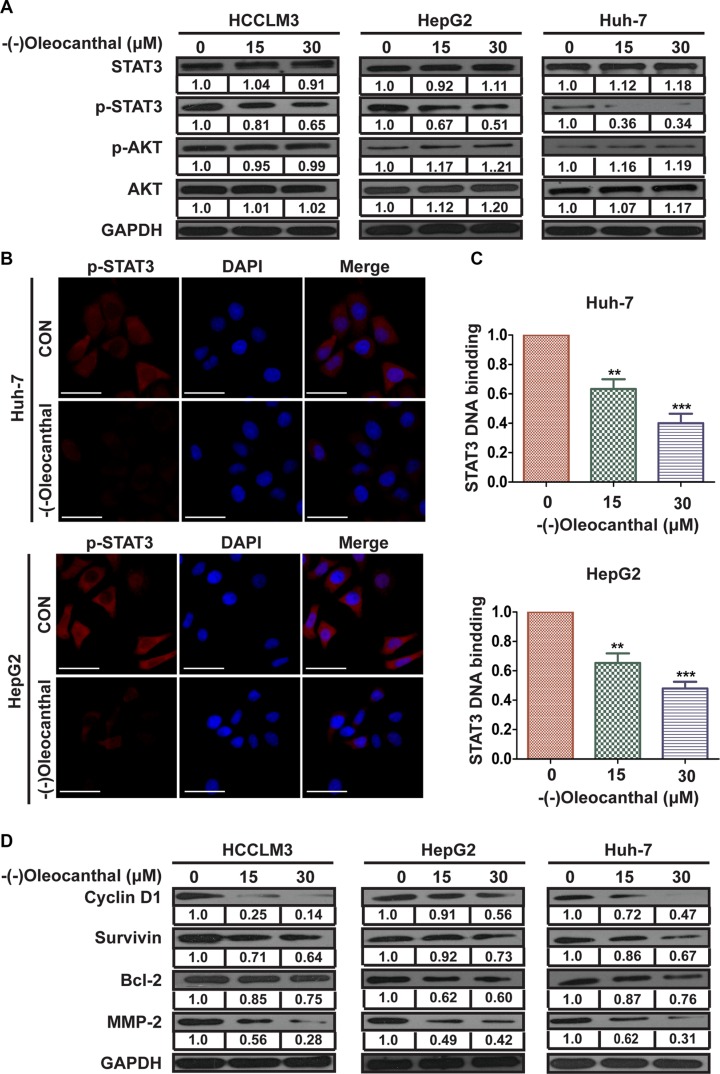
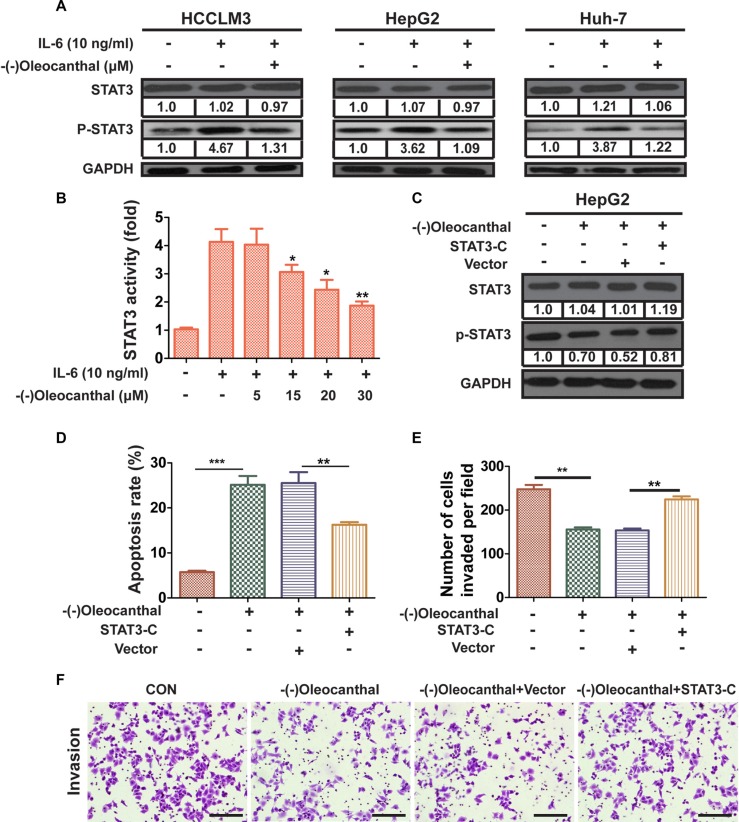
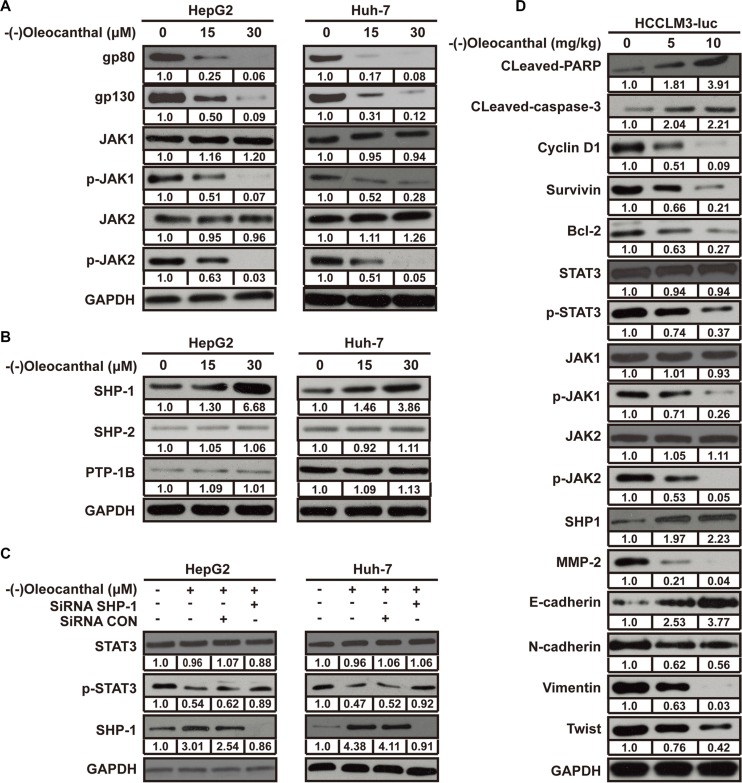
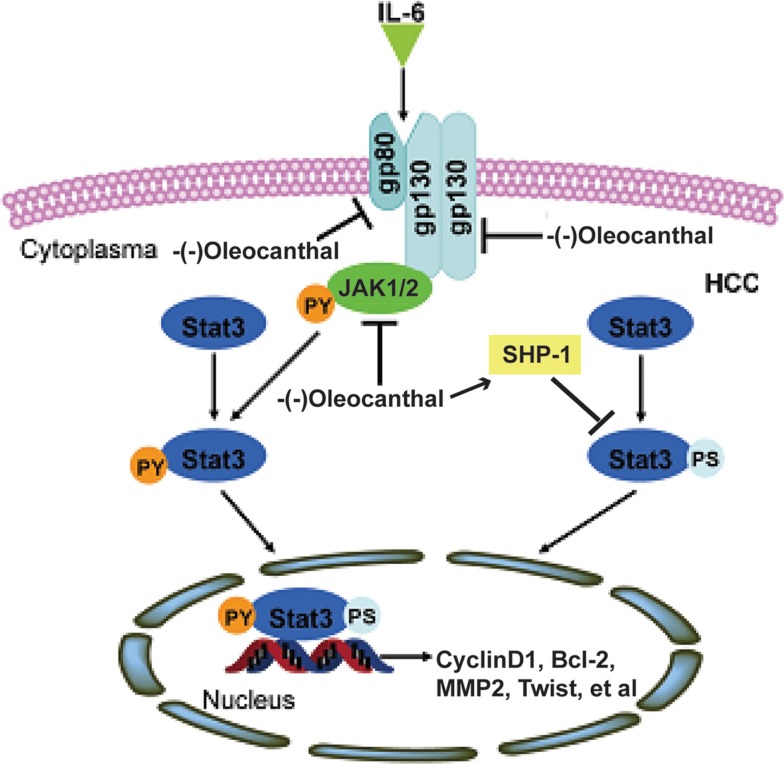
We explored the anti-cancer capacity of (-)-oleocanthal in human hepatocellular carcinoma (HCC). (-)-Oleocanthal inhibited proliferation and cell cycle progression and induced apoptosis in HCC cells in vitro and suppressed tumor growth in an orthotopic HCC model. (-)-Oleocanthal also inhibited HCC cell migration and invasion in vitro and impeded HCC metastasis in an in vivo lung metastasis model. ( )-Oleocanthal acted by inhibiting epithelial-mesenchymal transition (EMT) through downregulation Twist, which is a direct target of STAT3. (-)-Oleocanthal also reduced STAT3 nuclear translocation and DNA binding activity, ultimately downregulating its downstream effectors, including the cell cycle protein Cyclin D1, the anti-apoptotic proteins Bcl-2 and survivin, and the invasion-related protein MMP 2. Overexpression of constitutively active STAT3 partly reversed the anti cancer effects of (-)-oleocanthal, which inhibited STAT3 activation by decreasing the activities of JAK1 and JAK2 and increasing the activity of SHP-1. These data suggest that (-)-oleocanthal may be a promising candidate for HCC treatment.
Figure 1. (−)-Oleocanthal inhibits proliferation and induces…
Figure 1. (−)-Oleocanthal inhibits proliferation and induces cell cycle arrest in HCC cells in vitro
(A) HCC cell lines (Huh-7, HepG2 and HCCLM3) and human normal liver cell line (LO2) were incubated with increasing doses of (−)-oleocanthal (0-80 μM) for 24–72 h. Then, CCK-8 assay was performed to investigate the cell viability index. (B) The IC50 of (−)-oleocanthal was calculated in the three HCC cell lines. (C) Cell cycle analysis in (−)-oleocanthal-treated HCC cells showing arrest in G0/G1 phase. The results represent means ± SD of experiments performed in triplicate. * compared with control, P < 0.05. ** compared with control, P < 0.01.
Figure 2. (−)-Oleocanthal induces cell apoptosis in HCC cells in vitro
( A–C ) The…
Figure 2. (−)-Oleocanthal induces cell apoptosis in HCC cells in vitro
(A–C) The representative flow cytometry histograms of cell apoptosis for HCC cells treated for 48 h with increased doses of (−)-oleocanthal. (D) The expression of cleavages of PARP and caspase-3 was explored by western blotting. GAPDH was used as loading control. Data was presented as the means ± SD of three independent experiments. ** compared with control, P < 0.01. *** compared with control, P < 0.001.
Figure 3. Effects of anti-proliferation and pro-apoptosis…
Figure 3. Effects of anti-proliferation and pro-apoptosis by (−)-oleocanthal in an orthotopic tumor model of…
Figure 3. Effects of anti-proliferation and pro-apoptosis by (−)-oleocanthal in an orthotopic tumor model of HCC in vivo.
(A) Representative images of mice from bioluminescent imaging at the first, third and fifth week after (−)-oleocanthal treatment, respectively. The mice were sacrificed at the end of treatment and representative images of gross specimen were shown. (B) Quantification of the tumor growth based on the luciferase intensity. (C) The tumor volumes were measured with vernier calipers. (D) Immunohistochemical analysis of Ki-67 for cell proliferation in tumor tissues. Ki-67-positive cells were counted to evaluate the proliferation index. Scale bars = 200 μm. (E) TUNEL analysis was used to detect the apoptosis in tumor tissues. TUNEL-positive cells were counted to calculate the apoptosis index. Scale bars = 200 μm. Data was presented as the means ± SD of three independent experiments. * compared with control, P < 0.05. ** compared with control, P < 0.01. *** compared with control, P < 0.001.
Figure 4. (−)-Oleocanthal inhibits migration and invasion…
Figure 4. (−)-Oleocanthal inhibits migration and invasion abilities of HCC in vitro and in vivo
(A) Representative images of cell migration for Huh-7 and HepG2 cells using wound-healing assay after the treatment with 10 μM of (−)-oleocanthal (left panel). The wound closure was quantified at 24 h and 48 h post-wound by measuring the migrated area (right panel). Scale bar = 50 μm. (B) Representative images of invasion assay for Huh-7 and HepG2 cells after the pre-treatment with increasing doses of (−)-oleocanthal for 24 h (top panel). The number of invaded cells was counted (bottom panel). Scale bar = 100 μm. (C) Representative images of mice from bioluminescent imaging at the sixth and eighth week, respectively. (D) The mice were sacrificed and lungs were excised at the end of treatment. Representative images of gross specimen were shown in the top and middle panel. Hematoxylin and eosin staining of lung tissue samples from the different experimental groups were shown in the bottom panel. Black scale bar = 100 μm. Red scale bar = 0.5 cm. (E) Quantification of the tumor growth based on the luciferase intensity. (F) Number of metastatic lung foci was detected in each group. Data was presented as the means ± SD of three independent experiments. ** compared with control, P < 0.01. *** compared with control, P < 0.001.
Figure 5. (−)-Oleocanthal suppresses EMT through downregulating…
Figure 5. (−)-Oleocanthal suppresses EMT through downregulating the expression of Twist in HCC
( A …
Figure 5. (−)-Oleocanthal suppresses EMT through downregulating the expression of Twist in HCC
(A) 12 hours after (−)-oleocanthal (15 and 30 μM) treatment, real-time PCR was performed to assess mRNA levels of epithelial marker (E-cadherin) and mesenchymal markers (N-cadherin and vimentin) in HCCLM3 cells. Results were normalized against GAPDH. (B) Real-time PCR was performed to assess mRNA levels of several transcription factors including Zeb1, Slug, Snai1, Twist, and SIP1 in HCCLM3 cells. Results were normalized against GAPDH. (C) Western blots analysis for the expression of E-cadherin, N-cadherin, vimentin and Twist in HCC cells. GAPDH was used as the internal control. (D) Single and merged images were taken to show immunofluorescence staining of E-cadherin (red), N-cadherin (red) and vimentin (green) accompanied by the cell nucleus (blue) stained by DAPI. Scale bar = 50 μm. The results represent means ± SD of experiments performed in triplicate. * compared with control, P < 0.05. ** compared with control, P < 0.01. *** compared with control, P < 0.001.
Figure 6. (−)-Oleocanthal suppresses the transcriptional activity…
Figure 6. (−)-Oleocanthal suppresses the transcriptional activity of STAT3 and downregulates the expression of its…
Figure 6. (−)-Oleocanthal suppresses the transcriptional activity of STAT3 and downregulates the expression of its target in HCC cells
(A) Western blots analysis for the critical regulator of PI3K-AKT and STAT3 signal pathway in HCCLM3, HepG2 and Huh-7 cells. (B) (−)-Oleocanthal lead to the inhibition of translocation of p-STAT3 to the nucleus. HepG2 and Huh-7 cells were incubated with or without 15 μM for 12 h. Immunofluorescence was then used to analyze the intracelullar distribution of p-STAT3. Scale bar = 50 μm. (C) (−)-Oleocanthal inhibited STAT3 DNA-binding ability in HepG2 and Huh-7 cells. Cells were treated with (−)-oleocanthal for indicated dose; nuclear extracts were prepared for ELISA-based DNA-binding assay. (D) Western blots analysis for STAT3 and STAT3-regulated gene products in HCCLM3, HepG2 and Huh-7, with GAPDH as protein internal control. Data was presented as the means ± SD of three independent experiments. ** compared with control, P < 0.01. *** compared with control, P < 0.001.
Figure 7. (−)-Oleocanthal inhibits IL6-inducible activation of STAT3 and its anti-cancer effects are dependent on…
Figure 7. (−)-Oleocanthal inhibits IL6-inducible activation of STAT3 and its anti-cancer effects are dependent on STAT3 expression
(A) HCCLM3, HepG2 and Huh-7 cells were treated with DMSO or (−)-oleocanthal (30 μM) for 24 h and then stimulated with IL-6 (10 ng/ml) for 4 h. The expression of p-STAT3 was detected by western blot. (B) HepG2 cells were transfected with STAT3-luciferase (STAT3-Luc) plasmid for 24 h, and treated with DMSO or (−)-oleocanthal (5, 15, 20, 30 μM) for 12 h and then stimulated with IL-6 (10 ng/ml) for 2 h. The transcriptional activity of STAT3 was measured by luciferase gene reporter assay. The measured luciferase activity was normalized to the activity of renilla luciferase. (C) HepG2 cells were transiently transfected with the vector control or the STAT3-C expression plasmid for 48 h and subsequently treated with (−)-oleocanthal (30 μM) for 24 h. Then, cells were harvested for western blots assay. (D) HepG2 cells was transfected with STAT3-C or vector for 48 hours. Cells were treated with (−)-oleocanthal (50 μM) for another 48 hours and cell apoptosis was tested by flow cytometry assay. (E and F) HepG2 cells was transfected with STAT3-C or vector for 48 hours. Cells were treated with (−)-oleocanthal (10 μM) for 24 hours and invasion assay was performed as abovementioned method. Representative images were shown and invaded cells were counted. Scale bar = 100 μm. Data was presented as the means ± SD of three independent experiments. * compared with control, P < 0.05. ** compared with control, P < 0.01. *** compared with control, P < 0.001.
Figure 8. (−)-Oleocanthal inhibits the activation of…
Figure 8. (−)-Oleocanthal inhibits the activation of STAT3 through regulating the expression of positive and…
Figure 8. (−)-Oleocanthal inhibits the activation of STAT3 through regulating the expression of positive and negative regulators
(A) Western blots analysis for the positive regulator of STAT3 in HepG2 and Huh-7 cells. (B) Western blots analysis for the negative regulator of STAT3 in HepG2 and Huh-7 cells. (C) HepG2 and Huh-7 cells were transfected with either SHP-1 siRNA or scrambled siRNA. After 48 h, cells were treated with 30 μM of (−)-oleocanthal for 48 h and whole cell extracts were subjected to Western blot analysis for phosphorylated STAT3. (D) Western blot analysis was performed to detect the expression of indicated protein in tumor tissue.
Figure 9. A schematic model for the…
Figure 9. A schematic model for the role of (−)-oleocanthal in HCC
Bruix J, Boix L, Sala M, Llovet JM. Focus on hepatocellular carcinoma. Cancer cell. 2004;5:215–219.
-
PubMed
Lai EC, Fan ST, Lo CM, Chu KM, Liu CL, Wong J. Hepatic resection for hepatocellular carcinoma. An audit of 343 patients. Annals of surgery. 1995;221:291–298.
-
PMC
-
PubMed
Zhu GQ, Shi KQ, Yu HJ, He SY, Braddock M, Zhou MT, Chen YP, Zheng MH. Optimal adjuvant therapy for resected hepatocellular carcinoma: a systematic review with network meta-analysis. Oncotarget. 2015;6:18151–18161. doi: 10.18632/oncotarget.4098.
-
DOI
-
PMC
-
PubMed
Llovet JM, Burroughs A, Bruix J. Hepatocellular carcinoma. Lancet. 2003;362:1907–1917.
-
PubMed
Cervello M, McCubrey JA, Cusimano A, Lampiasi N, Azzolina A, Montalto G. Targeted therapy for hepatocellular carcinoma: novel agents on the horizon. Oncotarget. 2012;3:236–260. doi: 10.18632/oncotarget.466.
-
DOI
-
PMC
-
PubMed