. 2016 Jun 3;17(1):120.
doi: 10.1186/s13059-016-0984-2.

Comprehensive analysis of promoter-proximal RNA polymerase II pausing across mammalian cell types

Affiliations

Comprehensive analysis of promoter-proximal RNA polymerase II pausing across mammalian cell types

Daniel S Day et al. Genome Biol. .

Abstract

Background: For many genes, RNA polymerase II stably pauses before transitioning to productive elongation. Although polymerase II pausing has been shown to be a mechanism for regulating transcriptional activation, the extent to which it is involved in control of mammalian gene expression and its relationship to chromatin structure remain poorly understood.

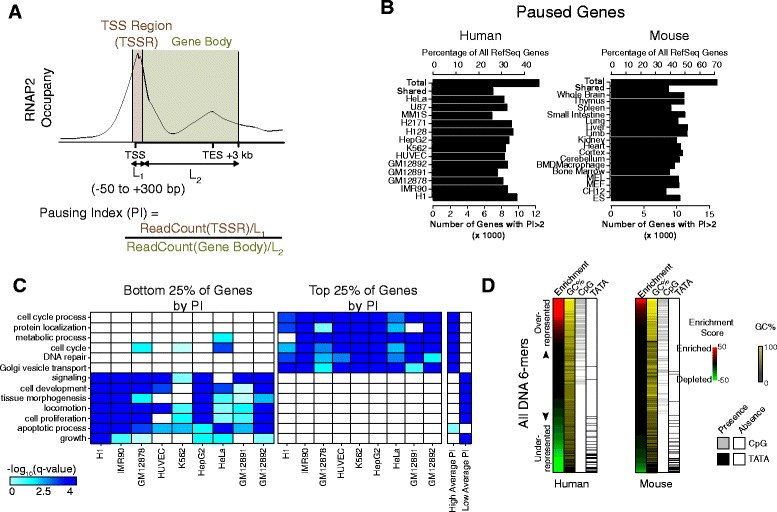
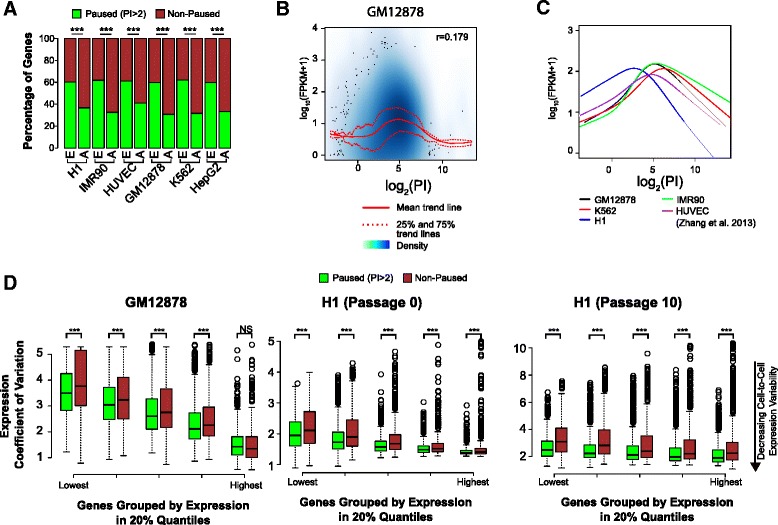
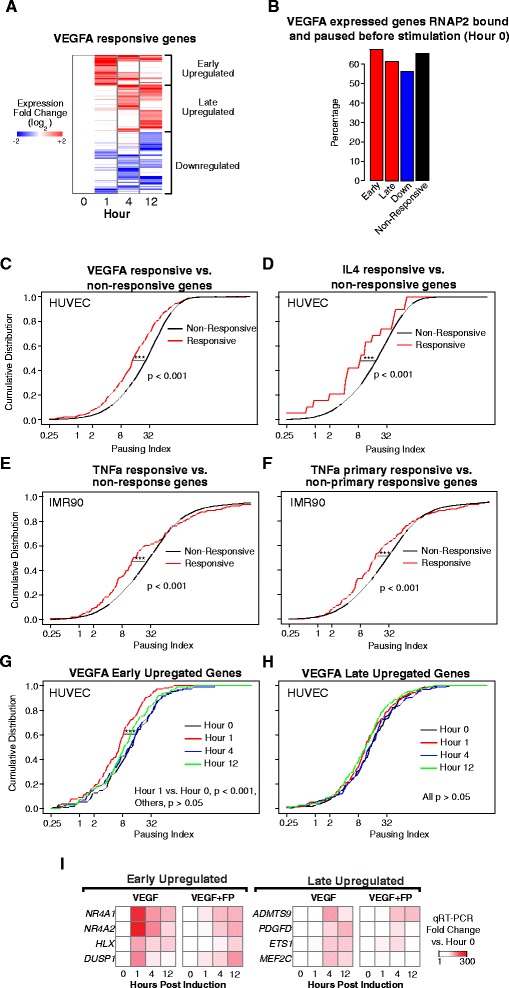
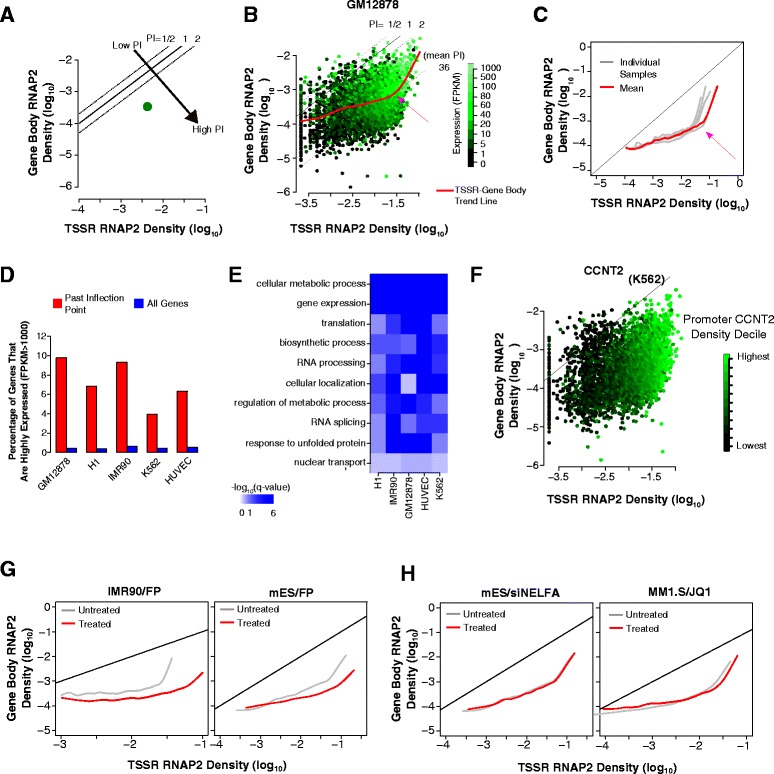
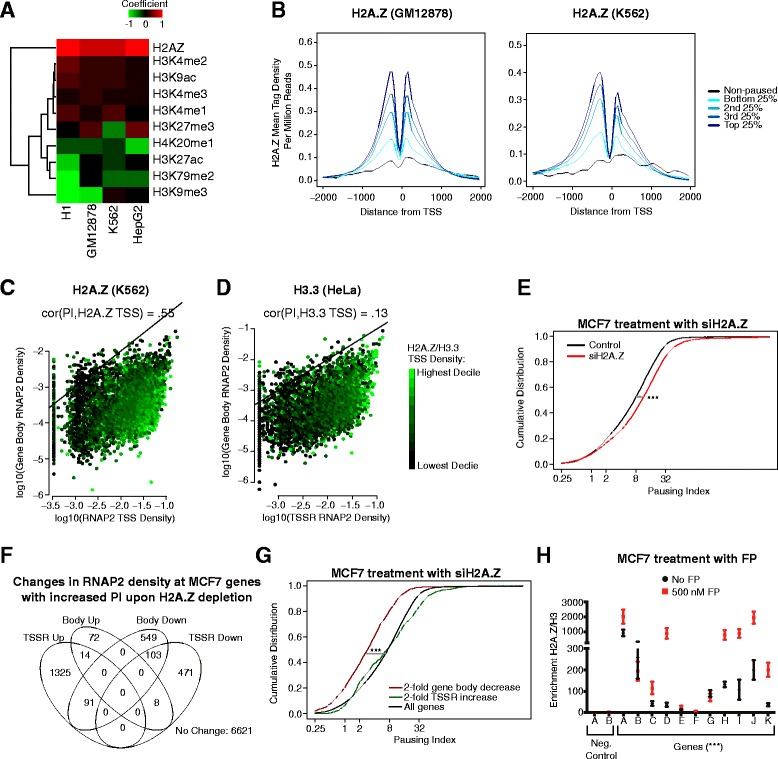
Results: Here, we analyze 85 RNA polymerase II chromatin immunoprecipitation (ChIP)-sequencing experiments from 35 different murine and human samples, as well as related genome-wide datasets, to gain new insights into the relationship between polymerase II pausing and gene regulation. Across cell and tissue types, paused genes (pausing index > 2) comprise approximately 60 % of expressed genes and are repeatedly associated with specific biological functions. Paused genes also have lower cell-to-cell expression variability. Increased pausing has a non-linear effect on gene expression levels, with moderately paused genes being expressed more highly than other paused genes. The highest gene expression levels are often achieved through a novel pause-release mechanism driven by high polymerase II initiation. In three datasets examining the impact of extracellular signals, genes responsive to stimulus have slightly lower pausing index on average than non-responsive genes, and rapid gene activation is linked to conditional pause-release. Both chromatin structure and local sequence composition near the transcription start site influence pausing, with divergent features between mammals and Drosophila. Most notably, in mammals pausing is positively correlated with histone H2A.Z occupancy at promoters.

Conclusions: Our results provide new insights into the contribution of RNA polymerase II pausing in mammalian gene regulation and chromatin structure.


Figures

Fig. 1
Fig. 1
Overview of paused genes across multiple human and mouse cell types. a Estimation of a gene’s “pausing index” (PI) from RNAP2 ChIP-seq data. b Occurrence of paused genes across cell types. The frequency of paused genes (PI ≥2) was similar in diverse human and mouse cell types. c Functional annotations enriched among the most or least paused genes in human cell lines. The top quartile of genes by PI rank had similar GO biological process term enrichment across both normal and cancer cell types, as did the bottom quartile. Similar enrichments were observed when considering genes with pausing greater than (“high average PI”) or less than (“low average PI”) the median PI across all cell types. d Sequence composition analysis of gene promoters. All DNA 6-mers were tested for enrichment in human paused promoters versus non-paused promoters. Each 6-mer was ranked by its enrichment score (see “Methods”). Human paused promoters were over-represented for 6-mers with high GC and CpG content and depleted for the TATA motif
Fig. 2
Fig. 2
Paused genes have lower cell-to-cell expression variability than non-paused genes. a Paused genes comprised the majority of expressed (FPKM >1) genes in each cell type. E, expressed genes (FPKM >1); A, All Refseq genes. (***p <0.001, Mann–Whitney U test). b “Hill-shaped” relationship between gene expression and PI in GM12878. We found no linear correlation between the PI and gene expression levels. The broadest range and strongest level of gene expression occurred at intermediate PI values, while extreme PI values were associated with reduced gene expression. c Similar “hill-shaped” relationships were observed in the four other cell lines examined, with the hill peak occurring within a similar PI range for 4/5 cell lines. d Using single cell RNA-seq data for GM12878 [18] and H1 [19], we analyzed the effect of RNAP2 pausing on cell-to-cell gene expression variability. We measured the coefficient of variation (standard deviation/mean) of gene expression across individual cells, stratified by gene expression quintiles based on the single-cell population wide mean expression level. We then compared between paused and non-paused genes. For nearly all expression quintiles in both cell lines, paused genes had lower coefficient of variation on average, suggesting that at the same expression level RNAP2 pausing dampens expression variability. (***p <0.001, NS, not significant; Mann–Whitney U test.)
Fig. 3
Fig. 3
RNAP2 pause-release in signal-induced gene expression. a VEGFA-stimulated changes in gene expression in HUVECs [21]. VEGFA-responsive genes were clustered into three groups by the temporal pattern of their VEGFA-induced expression change (see “Methods”). b Both the responsive and non-responsive (genes expressed during the time course without a significant change) gene sets had RNAP2 pre-loaded and paused prior to VEGFA-stimulation. cf Genes responsive (red line) to VEGF (c), IL4 (d), or TNFα (e, f) overall had lower PI compared to genes non-responsive (black line) to each stimulus. “Primary responsive genes” (f) were defined as those that respond in the presence of the protein synthesis inhibitor cycloheximide (***p <0.001; Mann–Whitney U test.) g, h VEGFA rapidly induced overall pause-release among early upregulated genes (g) but not late upregulated genes (h). i Pause-release is required for rapid signal-induced gene expression. Treatment of HUVECs with pause-release inhibitor FP markedly attenuated VEGFA activation of early upregulated genes. FP had more moderate effects on VEGFA activation of late upregulated genes
Fig. 4
Fig. 4
High RNAP2 TSSR density triggers increased RNAP2 gene body density. a, b Scheme to visualize a gene’s RNAP2 density by its TSSR and gene body density and a third variable, such as gene expression. PI is shown by the gene’s position along indicated diagonals. a Schematic plot of one gene, colored by its expression level. b All genes in GM12878. A smoothed spline mean trend line between RNAP2 TSSR and gene body density showed a biphasic slope, with an inflection point (pink arrow) and higher slope at high RNAP2 TSSR density. The steeper portion of the trend line suggested that high TSSR RNAP2 density enhanced RNAP2 gene body density. c Mean trend lines for five different cell types. A biphasic trend line with an inflection point at high RNAP2 TSSR density was a common feature of all cell lines. d Highly expressed genes (FPKM >1000) were over-represented among genes on the steep portion of the mean trend line, compared to all genes. e Functional annotations associated with genes on the steep portion of the mean trend line were consistently enriched for multiple GO biological process terms across several cell types. f Promoter density of CCNT2, a pause-release protein, correlated with TSSR RNAP2 density in K562 cells. g Inhibition of pause-release abrogated enhanced RNAP2 gene body density at high RNAP2 TSSR density. Treatment with pause-release inhibitor FP flattened the steeper portion of the mean trend line observed in untreated cells in both IMR90 and mES cells. h Modulation of pause-release regulators NELFA and BRD4 did not abrogate the inflection point. NELFA was knocked down with siRNA and BRD4 was antagonized with the small molecule JQ1. Neither treatment abolished the inflection point or the steeper portion of the mean trend line
Fig. 5
Fig. 5
H2A.Z deposition is strongly tied with greater RNAP2 pausing. a Correlation of TSS chromatin features with PI in four cell types. Correlation was modeled with a multi-dimensional linear regression. H2A.Z had a strong positive coefficient across all four tested cell types, suggesting that H2A.Z occupancy correlated with increased PI. b H2A.Z mean tag density around the TSS in GM12878 and K562 by increasing PI quintile. H2A.Z density increased with increasing PI. c, d Relationship of H2A.Z or H3.3 TSSR density to RNAP2 TSSR and gene body density. H2A.Z correlated with PI (Spearman r = 0.55) whereas H3.3 did not (Spearman r = 0.13). Genes with the same PI values align on the diagonal; one example line with PI = 1 is shown. eg H2A.Z knockdown in MCF7 cells globally increased RNAP2 pausing. MCF7 cells were treated with H2A.Z or control siRNA. RNAP2 pausing was then determined from RNAP2 ChIP-seq. H2A.Z knockdown in MCF7 cells globally increased RNAP2 pausing (e; ***p <0.001; Mann–Whitney U test). We counted the number of genes with absolute fold-change in RNAP2 density >2 in TSSR or gene body (f). Predominantly, genes increased TSSR RNAP2 density or decreased either TSSR or gene body density, but rarely both. Genes with exclusively ≥2-fold decrease in gene body RNAP2 density had a lower PI pre-knockdown than all genes or genes with exclusively ≥2-fold increase in their TSS RNAP2 density, further suggesting that H2A.Z differentially affects genes based on their PI. (g; ***p <0.001; Mann–Whitney U test.) (h). Antagonizing pause-release predominantly increased H2A.Z enrichment at promoters (all 500 NM FP vs. no FP, ***p <0.001; t-test). MCF7 cells were treated with FP to block pause-release. H2A.Z occupancy at 11 promoters was measured by ChIP-qPCR and normalized to histone H3 occupancy

Similar articles

Cited by

References

    1. Adelman K, Lis JT. Promoter-proximal pausing of RNA polymerase II: emerging roles in metazoans. Nat Rev Genet. 2012;13:720–31. doi: 10.1038/nrg3293. - DOI - PMC - PubMed
    1. Jonkers I, Lis JT. Getting up to speed with transcription elongation by RNA polymerase II. Nat Rev Mol Cell Biol. 2015;16:167–77. doi: 10.1038/nrm3953. - DOI - PMC - PubMed
    1. Kwak H, Fuda NJ, Core LJ, Lis JT. Precise maps of RNA polymerase reveal how promoters direct initiation and pausing. Science. 2013;339:950–3. doi: 10.1126/science.1229386. - DOI - PMC - PubMed
    1. Gilmour DS, Lis JT. In vivo interactions of RNA polymerase II with genes of Drosophila melanogaster. Mol Cell Biol. 1985;5:2009–18. doi: 10.1128/MCB.5.8.2009. - DOI - PMC - PubMed
    1. Rougvie AE, Lis JT. The RNA polymerase II molecule at the 5′ end of the uninduced hsp70 gene of D. melanogaster is transcriptionally engaged. Cell. 1988;54:795–804. doi: 10.1016/S0092-8674(88)91087-2. - DOI - PubMed

Publication types