. 2016 Jun 4;9(1):62.
doi: 10.1186/s13041-016-0244-0.

Loss of AP-2delta reduces retinal ganglion cell numbers and axonal projections to the superior colliculus

Affiliations

Loss of AP-2delta reduces retinal ganglion cell numbers and axonal projections to the superior colliculus

Xiaodong Li et al. Mol Brain. .

Abstract

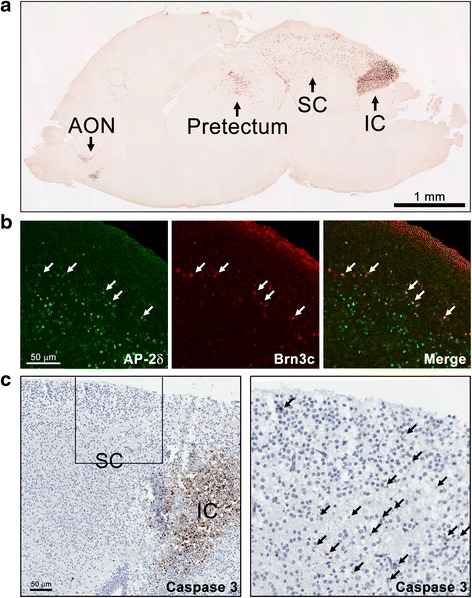
Background: AP-2δ is the most divergent member of the Activating Protein-2 (TFAP2) family of transcription factors. AP-2δ is restricted to specific regions of the CNS, including a subset of ganglion cells in the retina. Retinal ganglion cells (RGCs), the only output neurons of the retina, are responsible for transmitting the visual signal to the brain.

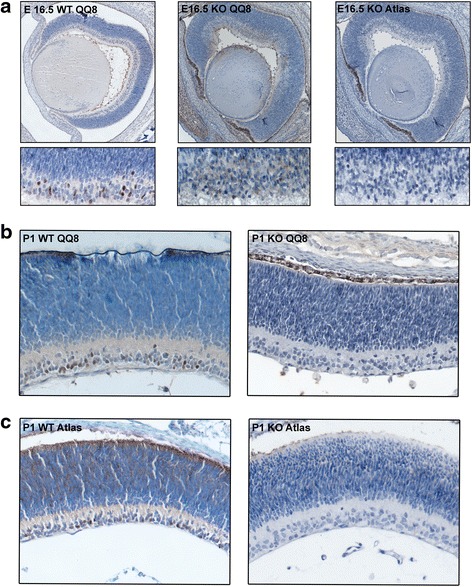
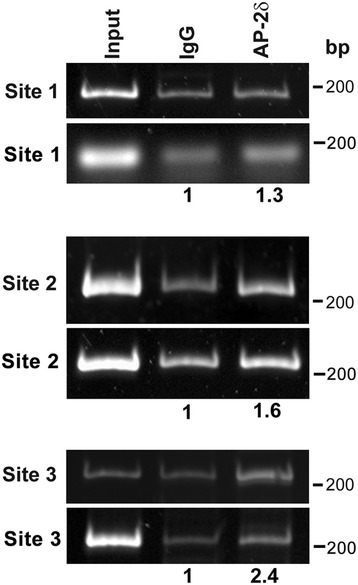
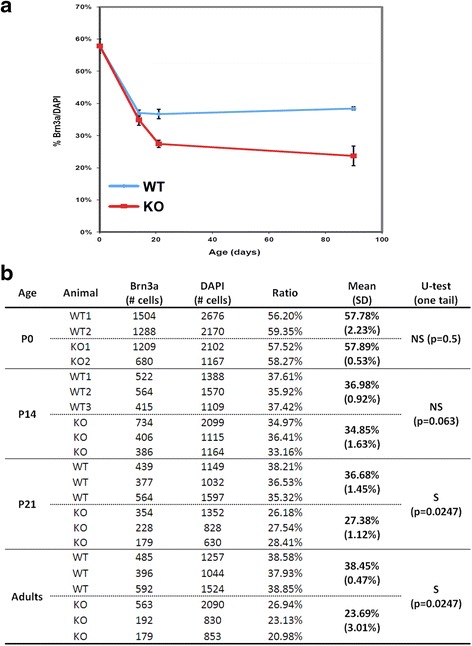
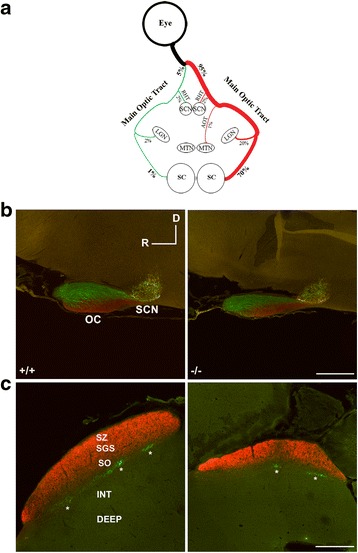
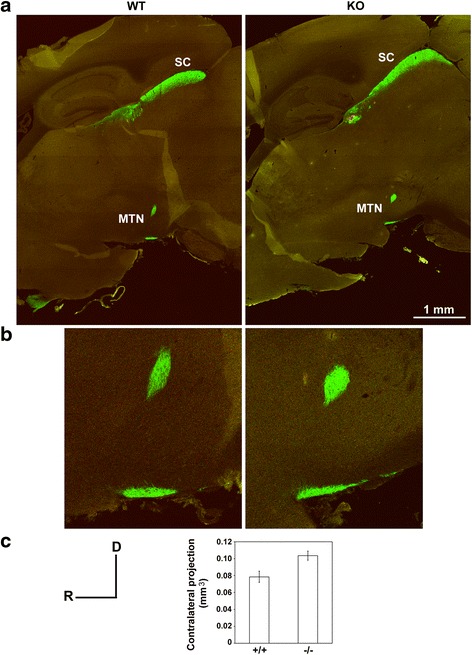
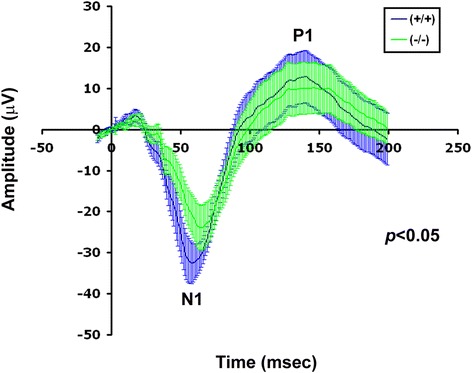
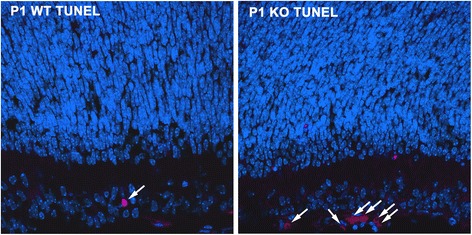
Results: AP-2δ knockout results in loss of Brn3c (Pou4f3) expression in AP-2δ -positive RGCs. While AP-2δ-/- mice have morphologically normal retinas at birth, there is a significant reduction in retinal ganglion cell numbers by P21, after eye opening. Chromatin immunoprecipitation indicates that Brn3c is a target of AP-2δ in the retina. Using fluorochrome-conjugated cholera toxin subunit B to trace ganglion cell axons from the eye to the major visual pathways in the brain, we found 87 % and 32 % decreases in ipsilateral and contralateral projections, respectively, to the superior colliculus in AP-2δ-/- mice. In agreement with anatomical data, visually evoked responses recorded from the brain confirmed that retinal outputs to the brain are compromised.

Conclusions: AP-2δ is important for the maintenance of ganglion cell numbers in the retina. Loss of AP-2δ alters retinal axonal projections to visual centers of the brain, with ipsilaterial projections to the superior colliculus being the most dramatically affected. Our results have important implications for integration of the visual signal at the superior colliculus.

Keywords: AP-2; Axon; Brain; Electrophysiology; Ganglion cells; Retina; Superior colliculus; Transcription factor.


Figures

Fig. 1
Fig. 1
Immunohistochemical analysis of AP-2δ in mouse retina. Retinal tissue sections from E16.5, P1, P7, P15 and adult mice were immunostained with anti-AP-2δ antibody. The sections were counterstained with hematoxylin to label the nuclei. Photographs were taken with a 5× (E16.5) or 20× lens (P1, P7, P15 and adult) using a Zeiss Axioskop 2 plus microscope. The E16.5 image was assembled by taking overlapping photographs which were automatically merged in Photoshop. Scale bars = 100 μm for E16.5 tissue and 50 μm for P1, P7, P15 and adult tissues
Fig. 2
Fig. 2
AP-2δ is expressed in a subset of RGCs in mouse retina. Retinal tissue sections from E16.5, P1, P16 and adult mice were co-immunostained with anti-AP-2δ and anti-Brn3a antibodies followed by secondary antibodies conjugated with Alexa 555 and Alexa 488, respectively. Sections were counterstained with DAPI to label the nuclei. The inset in E16.5 shows a magnified view of the area indicated by the square. Of the five AP-2δ-positive cells shown in the inset, two do not co-immunostain with Brn3a (indicated by arrows). Photographs were taken with a Zeiss LSM710 confocal microscope equipped with 20× lens. Abbreviations: NBL, neuroblastic layer; ONL, outer nuclear layer; INL, inner nuclear layer; GCL, ganglion cell layer. Scale bar = 100 μm
Fig. 3
Fig. 3
AP-2δ and AP-2α are found in different subsets of cells in the ganglion cell layer. Retinal tissue sections from wild-type mice at P1 were immunostained with anti-AP-2δ and anti-AP-2α (amacrine and displace amacrine marker) antibodies followed by secondary antibodies conjugated to Alexa 488 and Alexa 555, respectively. There was no overlap in cells expressing AP-2δ and AP-2α in the ganglion cell layer (see merged signal)
Fig. 4
Fig. 4
Co-expression of AP-2δ and Brn3c in retinal ganglion cells. P1 retinal tissue sections were immunostained with anti-AP-2δ and anti-Brn3c antibodies followed by secondary antibodies conjugated to Alexa 488 and Alexa 555, respectively. Sections were counterstained with DAPI to label the nuclei. Images were automatically assembled from multiple scans (4 × 4 scan; 4096 × 4096 pixels) using the Tile-scan function of the LSM program. The area outlined by the rectangle is magnified to show AP-2δ-positive cells (green), Brn3c-positive cells (red) and merged AP-2δ and Brn3c
Fig. 5
Fig. 5
Loss of Brn3c expression in AP-2δ−/− retina. Paraffin-embedded tissue sections from E16.5 (a) and P1 (b, c) AP-2δ+/+ and AP-2δ−/− retina were processed as previously described [81] and immunostained with two anti-Brn3c antibody: mouse anti-Brn3c (QQ8) (a, b) and rabbit anti-Brn3c antibody (Atlas) (a, c). The signal was detected using the Dako-Cytomation EnVision + anti-rabbit or anti-mouse secondary systems. Tissues were counterstained with the nuclear stain hematoxylin. Photographs were taken using a 20× lens. Images of the entire E16.5 retina sections were assembled from multiple overlapping photographs using the Adobe Photoshop merge function. The bottom panels in a show a higher magnification of the E16.5 ganglion cell layer
Fig. 6
Fig. 6
ChIP analysis of putative AP-2 binding sites located upstream of the Brn3c gene. P1 mouse retinal tissue was cross-linked and genomic DNA/AP-2δ complexes immunoprecipitated with anti-AP-2δ antibody. DNA purified from cross-linked complexes was PCR amplified using primer pairs flanking three putative AP-2 binding sites located within 3 kb of the Brn3c transcription start site. Normal rabbit IgG served as the negative control. Input DNA is the DNA following sonication but prior to immunoprecipitation. Results are shown from two experiments. Note that the second gel shown for site 1 was prepared using agarose rather than acrylamide. The intensity of the DNA signal was quantified by densitometric analysis using Adobe Photoshop and background subtraction. Values indicate the average of 2 independent experiments, with signal density in the IgG lanes set at 1
Fig. 7
Fig. 7
Decrease in RGC numbers in AP-2δ−/− mice. a Retinal tissue sections at P0, P14, P21 and adult stages were stained with anti-Brn3a antibody and DAPI. Graphical representation of the changes in the number of Brn3a-positive RGCs in wild-type versus AP-2δ−/− eyes at P0, P14, P21 and adult. b Brn3a-positive cells relative to DAPI-stained cells were counted throughout the ganglion cell layer of multiple sections from each of the eyes analysed. Significance of differences in the percentages of Brn3a-positive cells was calculated using the non-parametric Mann–Whitney U-test. Abbreviations: WT, wild-type; KO, knock-out; S, significant; NS, not-significant
Fig. 8
Fig. 8
RGC projections to the optic chiasm (OC), suprachiasmatic nucleus (SCN) and superior colliculus (SC). a Diagram depicting the three major optic tracts [main optic tract, accessory optic tract (OAT) and retino-hypothalamic tract (RHT)] in brain and associated visual centers (nuclei) [SCN, lateral geniculate nuclei (LGN), medial terminal nucleus (MTN) and SC. b, c Sagittal brain sections from AP-2δ+/+ and AP-2δ−/− mice intravitreally injected with CTB. Red, projections from the contralateral eye to the OC and SCN (b) and SC (c); green, projections from the ipsilateral eye to the OC and SCN (b) and SC (c). D, dorsal; R, rostral; SZ, stratum zonale; SGS, stratum griseum superficiale; SO, stratum opticum. Asterisks indicate clusters of ipsilateral projections. Scale bars = 200 μm (b) and 500 μm (c). Photographs were taken with a Zeiss LSM710 confocal microscope equipped with 10× lens
Fig. 9
Fig. 9
RGC projections to the medial terminal nuclei (MTN). a, b Sagittal brain sections (30 μm) from AP-2δ+/+ (W4) and AP-2δ−/− (AF1) mice (intravitreally injected with CTB) were photographed with a 10× lens using the Tile-scan function of the LSM program. The image for the AP-2+/+ mouse was constructed using a 12 × 10 tile scan, and the image for the AP-2δ−/− mouse was constructed using a 11 × 8 tile scan. Projections from the contralateral eye to the SC and MTN are shown in green, with a magnified view of the MTN shown in (b). c Graph depicting volume of contralateral projections to the MTN in three AP-2δ+/+ and four AP-2δ−/− mice (values obtained from Table 1). Fiber volumes were measured in all sections containing components of the MTN. D, dorsal; R, rostral
Fig. 10
Fig. 10
Visually evoked response in AP-2δ+/+ and AP-2δ−/− mice. VER traces in AP-2δ+/+ and AP-2δ−/− mice. Response amplitude (μV, y-axis) is shown as a function of time (x-axis). Traces of both AP-2δ+/+ mice (blue) and AP-2δ−/− mice (green) are shown as filled-in lines which include the maximum and minimum amplitudes recorded for each mice at the indicated times. The solid lines represent amplitude averages for AP-2δ+/+ and AP-2δ−/− mice
Fig. 11
Fig. 11
Dark-adapted intensity responses in AP-2δ+/+ and AP-2δ−/− mice. Recordings of dark-adapted ERG a-waves (a, b) and b-waves (c, d) in AP-2δ+/+ and AP-2δ−/− mice elicited by step-wise increases in stimulus strength. ERG a-wave and b-wave amplitudes as a function of stimulus strength are shown in a and c. ERG a-wave and b-wave implicit times as a function of stimulus strength are shown in (b and d). e Dark-adapted b-wave to a-wave ratio
Fig. 12
Fig. 12
Photopic intensity responses in AP-2δ+/+ and AP-2δ−/− mice. Recordings of lighted-adapted ERG a-waves (a, b) and b-waves (c, d) in AP-2δ+/+ and AP-2δ−/− mice elicited by step-wise increases in stimulus strength. ERG a-wave and b-wave amplitudes as a function of stimulus strength are shown in (a and c). ERG a-wave and b-wave implicit times as a function of stimulus strength are shown in (b and d). e ERG recordings of light-adapted flicker responses as a function of stimulus frequency
Fig. 13
Fig. 13
AP-2δ expression and apoptosis in the superior colliculus. (a) Wild-type P1 mouse brain sagittal section immunostained with anti-AP-2δ antibody. Photographs were taken with a 5× lens and photo-merged in Photoshop. A positive signal is observed in the inferior colliculus (IC), superior colliculus (SC), pretectum and anterior olfactory nucleus (AON). b Sagittal section from wild-type P1 brain co-immunostained with anti-AP-2δ and anti-Brn3c antibodies followed by secondary antibodies conjugated with Alexa 488 and Alexa 555, respectively. AP-2δ-positive cells are observed throughout the SC, with Brn3c cells co-expressed with AP-2δ (e.g. see arrows) in a subset of AP-2δ-positive cells. c Sagittal section from AP-2δ−/− P1 brain immunostained with anti-caspase 3 antibody showing apoptosis in the inferior colliculus and to a much lesser extent in the SC. Inset is magnified on the right. Arrows point to apoptotic cells
Fig. 14
Fig. 14
Increased apoptosis in the ganglion cell layer of AP-2δ−/− P1 retina. Apoptotic cells in P1 retinal tissue sections from AP-2δ+/+ (WT) and AP-2δ−/− (KO) mice were stained using the In Situ Cell Death Detection kit, TMR red (Roche). Photographs were taken using a Zeiss LSM510 confocal microscope. Arrows point to apoptotic cells

Similar articles

Cited by

References

    1. Zarelli VE, Dawid IB. Inhibition of neural crest formation by Kctd15 involves regulation of transcription factor AP-2. Proc Natl Acad Sci U S A. 2013;110(8):2870–5. doi: 10.1073/pnas.1300203110. - DOI - PMC - PubMed
    1. Rada-Iglesias A, Bajpai R, Prescott S, Brugmann SA, Swigut T, Wysocka J. Epigenomic annotation of enhancers predicts transcriptional regulators of human neural crest. Cell Stem Cell. 2012;11(5):633–48. doi: 10.1016/j.stem.2012.07.006. - DOI - PMC - PubMed
    1. Van Otterloo E, Li W, Garnett A, Cattell M, Medeiros DM, Cornell RA. Novel Tfap2-mediated control of soxE expression facilitated the evolutionary emergence of the neural crest. Development. 2012;139(4):720–30. doi: 10.1242/dev.071308. - DOI - PMC - PubMed
    1. Schmidt M, Huber L, Majdazari A, Schutz G, Williams T, Rohrer H. The transcription factors AP-2beta and AP-2alpha are required for survival of sympathetic progenitors and differentiated sympathetic neurons. Dev Biol. 2011;355(1):89–100. doi: 10.1016/j.ydbio.2011.04.011. - DOI - PubMed
    1. Kousa YA, Schutte BC. Toward an orofacial gene regulatory network. Dev Dyn. 2016;245(3):220–32. doi: 10.1002/dvdy.24341. - DOI - PMC - PubMed

MeSH terms

Grants and funding

LinkOut - more resources