. 2016 Jul;67(14):4325-38.
doi: 10.1093/jxb/erw220. Epub 2016 Jun 3.

The subtilisin-like protease SBT3 contributes to insect resistance in tomato

Affiliations

The subtilisin-like protease SBT3 contributes to insect resistance in tomato

Michael Meyer et al. J Exp Bot. 2016 Jul.

Abstract

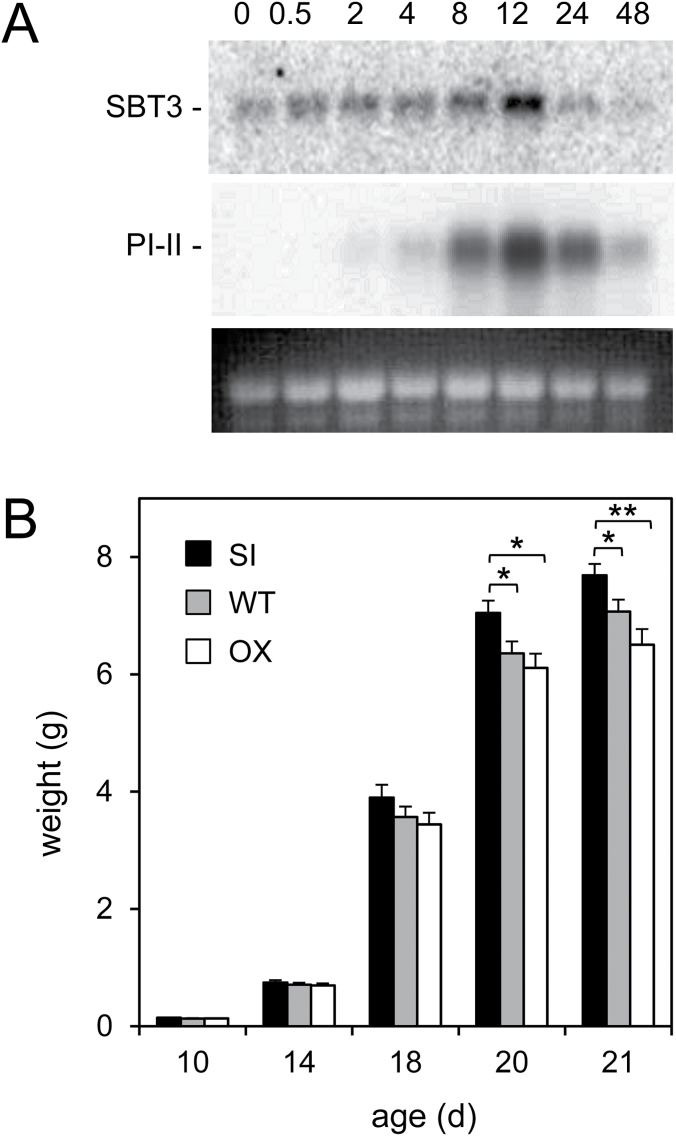
Subtilisin-like proteases (SBTs) constitute a large family of extracellular plant proteases, the function of which is still largely unknown. In tomato plants, the expression of SBT3 was found to be induced in response to wounding and insect attack in injured leaves but not in healthy systemic tissues. The time course of SBT3 induction resembled that of proteinase inhibitor II and other late wound response genes suggesting a role for SBT3 in herbivore defense. Consistent with such a role, larvae of the specialist herbivore Manduca sexta performed better on transgenic plants silenced for SBT3 expression (SBT3-SI). Supporting a contribution of SBT3 to systemic wound signaling, systemic induction of late wound response genes was attenuated in SBT3-SI plants. The partial loss of insect resistance may thus be explained by a reduction in systemic defense gene expression. Alternatively, SBT3 may play a post-ingestive role in plant defense. Similar to other anti-nutritive proteins, SBT3 was found to be stable and active in the insect's digestive system, where it may act on unidentified proteins of insect or plant origin. Finally, a reduction in the level of pectin methylesterification that was observed in transgenic plants with altered levels of SBT3 expression suggested an involvement of SBT3 in the regulation of pectin methylesterases (PMEs). While such a role has been described in other systems, PME activity and the degree of pectin methylesterification did not correlate with the level of insect resistance in SBT3-SI and SBT3 overexpressing plants and are thus unrelated to the observed resistance phenotype.

Keywords: Manduca sexta; pectin methylesterase; proteinase inhibitor; subtilase; systemin; wound signaling..


Figures

Fig. 1.
Fig. 1.
SBT3 expression and its effect on insect performance. (A) RNA gel blot analysis of SBT3 expression. RNA was isolated from leaves of tomato plants from 0 to 48h after the onset of M. sexta feeding, and 4.5 µg of total RNA were analysed on RNA gel blots using radio-labelled cDNA probes for SBT3 (top) and PI-II (center). Blots were analysed on a phosphoimager (Typhoon Imager; GE Healthcare). A duplicated gel was stained with ethidium bromide as a control for RNA loading (bottom). (B) Effect of SBT3 expression on the performance of M. sexta larvae. One hundred and fifty 3-day-old M. sexta larvae were placed on each of the three genotypes, SBT3 over-expressors (OX, white bars), plants silenced for SBT3 expression (SI, black bars) and wild-type controls (WT, gray bars). Larval weight is shown as the mean±standard error. Asterisks indicate statistically significant differences at P<0.05 (*) and P<0.01 (**); Mann–Whitney rank sum test.
Fig. 2.
Fig. 2.
Local and systemic induction of SBT3 as compared with early and late wound response genes. One leaf of 2-week-old wild-type (white bars) and SBT3-SI seedlings (grey bars) was wounded with a hemostat across the main vein of the terminal leaflet. At each time point after wounding, the damaged leaves (left) as well as the systemic unwounded leaves (right) of five plants were harvested and pooled for RNA extraction followed by qRT-PCR analysis. Transcript abundance of SBT3 (A), two ‘early’ genes (B: LoxD, C: OPR3) and two ‘late’ genes (D: PI-II, E: LapA) was normalized to UBI3 and EF-1α expression, and is given as fold change relative to healthy (0h) wild-type leaves. Data represent the mean±standard error of three biological replicates using three different SBT3-SI lines (SI lines 12, 14, and 21).
Fig. 3.
Fig. 3.
Promoter:reporter (GUS) analysis of SBT3 expression. A 2kb SBT3 promoter fragment was used to drive the expression of the β-glucuronidase (GUS) ORF in transgenic tomato plants. GUS activity was analysed histochemically in seeds at 24h (A), 48h (B), and 72h (C) after imbibition, in shoots (D) and roots (E) of 3-week-old plants and in cross sections of the stem (F, light microscopy, with inset enlarged in G). Arrow heads in A: micropylar endosperm. Scale bars: 200 µm in F, 30 µm in G. CC, companion cell; eP, external phloem; iP, internal phloem; SE, sieve element; XP, xylem parenchyma; XV, xylem vessel. Equivalent expression patterns were observed in four independent transgenic lines.
Fig. 4.
Fig. 4.
Effect of SBT3 expression on early and late systemin responses. (A) Systemin-triggered alkalinization response. Medium pH was recorded in tomato (S. peruvianum) cell cultures after addition of 1nM systemin at t=0min. The alkalinization response was compared in three independent transgenic cell lines showing different levels of SBT3 expression as indicated by the western blot signal. (B) Induction of proteinase inhibitor activity in response to wounding. The inhibition of chymotrypsin activity after addition of plant extracts obtained from SBT3-OX (line G2, triangle), SBT3-SI (line 21, filled circles) and wild-type plants (open circles) at the indicated time points after wounding was analysed in triplicate (three biological replicates, each including the pooled leaf material of five plants) and is shown as the mean±standard deviation.
Fig. 5.
Fig. 5.
Effect of SBT3 expression on PME activity and pectin composition. (A) PME activity was analysed in leaf extracts of WT (grey), SBT3-OX (white) and SBT3-SI plants (black) and is expressed as nanomoles methanol released per minute and microgram protein. Each data point represents the mean of at least three biological replicates, with six independent measurements per data point. Two and three independent transgenic lines were analysed for SBT3-OX (G18, G19) and SBT3-SI (SI-12, SI-14, SI-21), respectively. PME activity differs significantly in SBT3-OX as compared with SBT3-SI and WT plants at P=0.004 (one-way ANOVA with Tukey’s post hoc test for multiple comparisons). (B) Protein extracts from WT and SBT3-OX (line G18) plants (2 and 5 µg of total protein) were separated by isoelectric focusing. Ruthenium red staining of de-methylesterified pectin was used to detect PME activity with citrus pectin as the substrate. (C) The degree of pectin methylesterification (DM) was analysed in 6-week-old tomato plants and compared with WT (grey), SBT3-OX (white) and SBT3-SI plants (black). At least three biological replicates were analysed for WT, for each of the three independent SBT3-SI lines (SI-12, SI-14, SI-21), and four SBT3-OX lines from two independent transformation events (G18, G19). Data represent the mean±standard deviation. Asterisks indicate statistically significant differences from WT at P<0.001 (t-test).
Fig. 6.
Fig. 6.
Post-ingestive activity of SBT3. (A) Stability of SBT3 in the digestive system of M. sexta larvae. Larvae of M. sexta were raised on WT, SBT3-OX (G2) or SBT3-SI (SI-21) plants. Protein extracts from frass (10 µg total protein) of fifth-instar larvae were separated by SDS-PAGE and analysed on western blots using a polyclonal antiserum against SBT3. (B) Activity of SBT3 in the digestive system of M. sexta larvae. Protein extracts from SBT3-OX plants (20 µg) and M. sexta midgut (20 µg) and purified SBT3 protein (15ng; positive control, +) were separated by acidic PAGE on 6.75% gels with 0.5% co-polymerized gelatine. Gelatinolytic activity of SBT3 is visualized by Coomassie staining as a clear band against a dark background. (C) Growth of M. sexta larvae raised on artificial diet supplemented with 100 µg g–1 fresh weight of SBT3 (circles) or BSA (triangles). Larval weight was determined after 3 (n=37), 6 (n=32), 8 (n=23), 9 (n=20), and 10 (n=18) days. Data represent the average weight of all larvae alive at the respective time point±standard error.

References

    1. Bédouet L, Courtois B, Courtois J. 2003. Rapid quantification of O-acetyl and O-methyl residues in pectin extracts. Carbohydrate Research 338, 379–383. - PubMed
    1. Bergey DR, Howe GA, Ryan CA. 1996. Polypeptide signaling for plant defensive genes exhibits analogies to defense signaling in animals. Proceedings of the National Academy of Sciences of the United States of America 93, 12053–12058. - PMC - PubMed
    1. Bosch M, Berger S, Schaller A, Stintzi A. 2014. a Jasmonate-dependent induction of polyphenol oxidase activity in tomato foliage is important for defense against Spodoptera exigua but not against Manduca sexta . BMC Plant Biology 14, 257. - PMC - PubMed
    1. Bosch M, Wright LP, Gershenzon J, Wasternack C, Hause B, Schaller A, Stintzi A. 2014. b Jasmonic acid and its precursor 12-oxophytodienoic acid control different aspects of constitutive and induced herbivore defenses in tomato. Plant Physiology 166, 396–410. - PMC - PubMed
    1. Calderón-Cortés N, Quesada M, Watanabe H, Cano-Camacho H, Oyama K. 2012. Endogenous plant cell wall digestion: A key mechanism in insect evolution. Annual Review of Ecology, Evolution, and Systematics 43, 45–71.

Publication types