. 2016 Jun 4;13(1):137.
doi: 10.1186/s12974-016-0600-0.

Histamine induces microglia activation and dopaminergic neuronal toxicity via H1 receptor activation

Affiliations

Histamine induces microglia activation and dopaminergic neuronal toxicity via H1 receptor activation

Sandra M Rocha et al. J Neuroinflammation. .

Abstract

Background: Histamine is an amine widely known as a peripheral inflammatory mediator and as a neurotransmitter in the central nervous system. Recently, it has been suggested that histamine acts as an innate modulator of microglial activity. Herein, we aimed to disclose the role of histamine in microglial phagocytic activity and reactive oxygen species (ROS) production and to explore the consequences of histamine-induced neuroinflammation in dopaminergic (DA) neuronal survival.

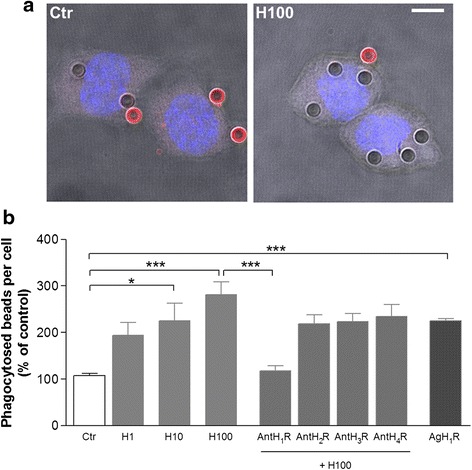
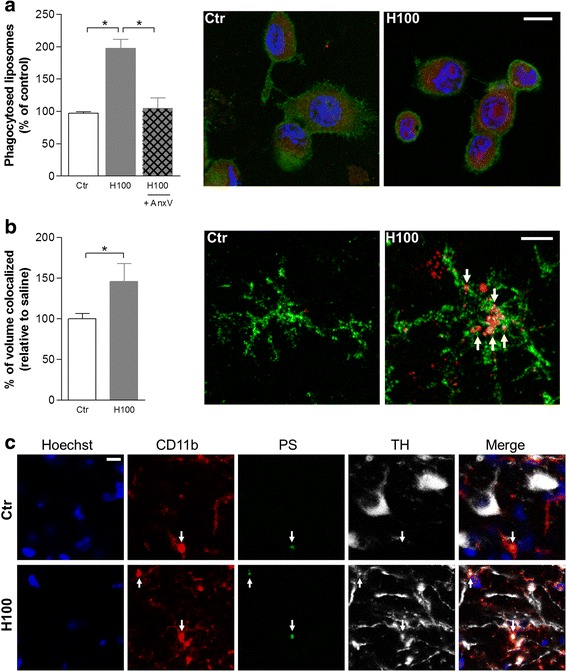
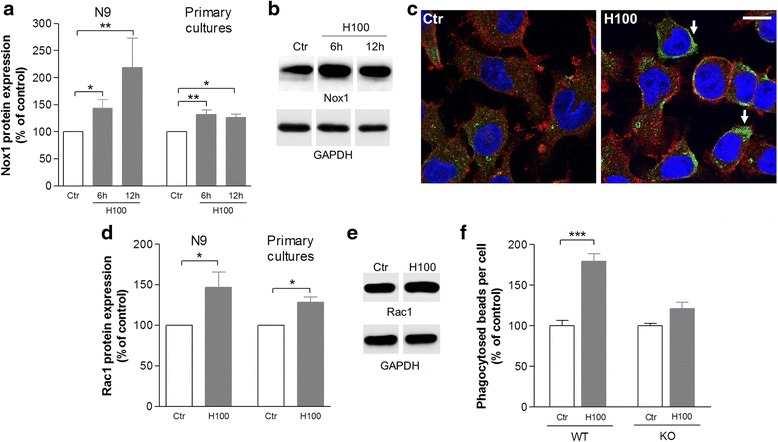
Methods: The effect of histamine on phagocytosis was assessed both in vitro by using a murine N9 microglial cell line and primary microglial cell cultures and in vivo. Cells were exposed to IgG-opsonized latex beads or phosphatidylserine (PS) liposomes to evaluate Fcγ or PS receptor-mediated microglial phagocytosis, respectively. ROS production and protein levels of NADPH oxidases and Rac1 were assessed as a measure of oxidative stress. DA neuronal survival was evaluated in vivo by counting the number of tyrosine hydroxylase-positive neurons in the substantia nigra (SN) of mice.

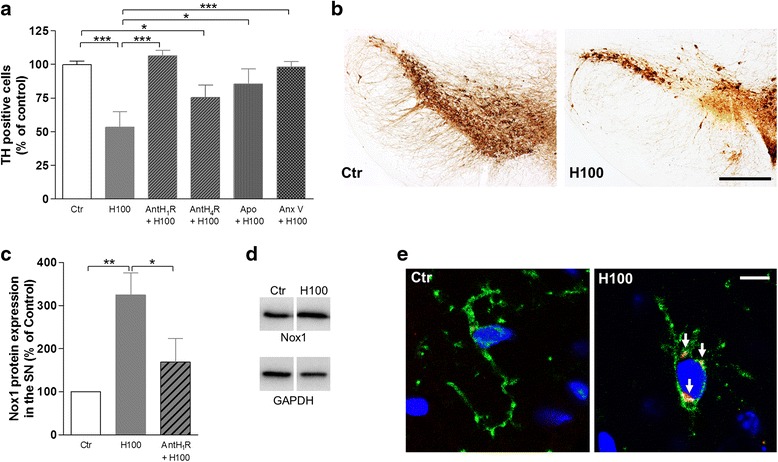
Results: We found that histamine triggers microglial phagocytosis via histamine receptor 1 (H1R) activation and ROS production via H1R and H4R activation. By using apocynin, a broad NADPH oxidase (Nox) inhibitor, and Nox1 knockout mice, we found that the Nox1 signaling pathway is involved in both phagocytosis and ROS production induced by histamine in vitro. Interestingly, both apocynin and annexin V (used as inhibitor of PS-induced phagocytosis) fully abolished the DA neurotoxicity induced by the injection of histamine in the SN of adult mice in vivo. Blockade of H1R protected against histamine-induced Nox1 expression and death of DA neurons in vivo.

Conclusions: Overall, our results highlight the relevance of histamine in the modulation of microglial activity that ultimately may interfere with neuronal survival in the context of Parkinson's disease (PD) and, eventually, other neurodegenerative diseases which are accompanied by microglia-induced neuroinflammation. Importantly, our results also open promising new perspectives for the therapeutic use of H1R antagonists to treat or ameliorate neurodegenerative processes.

Keywords: Dopaminergic neurons; Histamine; Microglia; NADPH oxidase; Neurotoxicity; Phagocytosis.


Figures

Fig. 1
Fig. 1
Histamine-induced microglial FcγR-mediated phagocytosis through H1R activation. a Representative photomicrographs illustrate the stimulatory effect of 100 μM histamine on microglial phagocytosis of IgG latex beads. Non-ingested beads display red labeling whereas ingested beads do not show any fluorescence signal. Scale bar 10 μm. b Only 10 (H10) and 100 (H100) μM histamine significantly increased the number of phagocytosed IgG latex beads per cell as compared with untreated controls (Ctr). Microglial phagocytosis induced by 100 μM histamine was fully blocked by an H1R antagonist (AntH1R, mepyramine maleate, 1 μM) and mimicked by an H1R agonist (AgH1R, 4-methylhistamine dihydrochloride, 20 μM). The involvement of other receptors was excluded since the application of their respective antagonists (“Ant”) did not interfere with the phagocytosis-inducing effect of histamine (H2R antagonist (cimetidine), 5 μM; H3R antagonist (carcinine ditrifluoroacetate), 5 μM; and H4R antagonist (JNJ7777120), 5 μM). Data are expressed as mean ± SEM (n = 5–15). *P < 0.05 and ***P < 0.001, using one-way ANOVA followed by Bonferroni’s multiple comparison test
Fig. 2
Fig. 2
Histamine-induced microglial phagocytosis of PS particles/residues. a Bar graph displays the stimulatory effect of 100 μM histamine (H100) on the phagocytosis of phosphatidylserine (PS)-conjugated liposomes in vitro. Specific effect on PS-induced phagocytosis was ruled out by using annexin V (AnxV). Data are expressed as mean ± SEM (n = 2–10) and as a percentage of control. *P < 0.05, using one-way ANOVA followed by Bonferroni’s multiple comparison test. Right panel: representative photomicrographs illustrate the stimulatory effect of 100 μM histamine on microglial phagocytosis of PS liposomes in vitro. PS liposomes: red labeling; CD11b: green labeling; nuclei (Hoechst 33342): blue. Scale bar 10 μm. b The bar graph represents the volume of CD11b+ cells containing PS liposomes in SN slices from mice injected intracranially with 100 μM histamine for 18 h. Data are expressed as mean ± SEM (n = 4–6 mice) and as a percentage of saline. *P < 0.05, using an unpaired t test as compared with saline mice. Right panel: representative photomicrographs illustrate the stimulatory effect of histamine on microglial phagocytosis of PS liposomes in vivo. PS liposomes: red labeling; CD11b: green labeling; nuclei (Hoechst 33342): blue. Arrows highlight co-labeling events. Scale bar 10 μm. c Representative confocal photomicrographs showing that the stereotaxic injection with 100 μM histamine (H100) in the SN of adult mice for 3 days induced co-localization (highlighted with white arrows) between PS residues (green), CD11b labeling (red), and TH dopaminergic neuronal staining (white). This co-localization was less evident in saline animals. Cell nuclei were stained with Hoechst 33342 (in blue). Scale bar 10 μm
Fig. 3
Fig. 3
Histamine-induced microglial cytoskeleton rearrangement. a Representative confocal photomicrographs showing that 100 μM histamine (H100) induced membrane ruffling. Cells were stained for phalloidin (red), CD11b (green), and Hoechst 33342 (nuclei in blue). b Histamine also increased α-tubulin acetylation expression levels especially in some microglial processes (white arrows) as compared with the faint staining present in microtubule organization centers (asterisk) found in resting microglial cells, as detected by immunolabeling for acetylated α-tubulin (red), CD11b (green), and Hoechst 33342 (nuclei in blue). Scale bars 10 μm. c Bar graph displays the increased expression levels of acetylated α-tubulin in histamine-activated cells. Data are expressed as mean ± SEM (n = 4–8) and as a percentage of control. ***P < 0.001, using one-way ANOVA followed by Bonferroni’s multiple comparison test
Fig. 4
Fig. 4
Histamine-induced ROS generation contributes to microglial phagocytosis. a Only 10 (H10) and 100 μM histamine (H100) significantly increased the levels of ROS as compared with untreated controls (Ctr). b Cellular ROS production induced by 100 μM histamine was blocked by an H1R antagonist (AntH1R, mepyramine maleate, 1 μM) or H4R antagonist (AntH4R, JNJ7777120, 5 μM) and mimicked by an H1R agonist (AgH1R, 4-methylhistamine dihydrochloride, 20 μM) or a H4R agonist (4-methylhistamine dihydrochloride, 20 μM). The involvement of other receptors was excluded since the application of their respective antagonists did not interfere with ROS levels induced by histamine (H2R antagonist (cimetidine), 5 μM; H3R antagonist (carcinine ditrifluoroacetate), 5 μM). Apocynin (5 μM) was used to rule out the involvement of the NADPH oxidase system in cellular production of ROS (c) and in the phagocytosis of IgG latex beads (d) induced by histamine. Apocynin-treated cells are represented in slashed columns both in (c and d). Data are expressed as mean ± SEM (n = 3–16) and as a percentage of control. *P < 0.05, **P < 0.01, and ***P < 0.001, using one-way ANOVA followed by Bonferroni’s multiple comparison test
Fig. 5
Fig. 5
Rac-1/Nox1 signaling is involved in microglial phagocytosis triggered by histamine. a Bar graph depicting Nox1 protein expression levels upon treatment with 100 μM histamine (H100) for 6 or 12 h, both in the N9 cell line and primary microglial cell cultures. Data are expressed as mean ± SEM (n = 4–10) and as a percentage of control. *P < 0.05 and **P < 0.01, using Bonferroni’s multiple comparison test as compared with control. b Representative Nox1 (65 kDa) and GAPDH (37 kDa) Western blots in primary microglial cell cultures. c Representative confocal photomicrographs showing that 100 μM histamine-induced Nox1 expression in the luminal side of the plasma membrane of N9 microglial cells (highlighted by white arrows). Cells were stained for CD11b (red), Nox1 (green), and Hoechst 33342 (nuclei in blue). Scale bar 10 μm. d Bar graph depicting Rac1 protein expression levels upon treatment with 100 μM histamine (H100) for 1 h, both in the N9 cell line and primary microglial cell cultures. Data are expressed as mean ± SEM (n = 3–8) and as a percentage of control. *P < 0.05 using paired t test as compared with control. e Representative Rac1 (22 kDa) and GAPDH (37 kDa) Western blots in primary microglial cell cultures. f Bar graph displays the effect of histamine on the phagocytosis of IgG latex beads in Nox1 knockout mice (KO) and their respective wild-type (WT) littermates. Data are expressed as mean ± SEM (n = 4) and as a percentage of control. ***P < 0.001 using Bonferroni’s multiple comparison test as compared with control
Fig. 6
Fig. 6
Histamine induces DA toxicity via H1R activation and involves oxidative stress and PS-mediated phagocytosis. a Bar graph depicts the percentage of TH+ cells in the SN of mice. A significant reduction in the number of TH+ neurons was found in 100 μM histamine (H100)-treated mice as compared with saline. Antagonist (Ant) for H1R abolished the toxicity induced by histamine. The toxic effect induced by histamine involves the production of ROS and PS-induced phagocytosis, since both apocynin (“Apo”, NADPH oxidase inhibitor) and annexin V (“AnxV”, blocker of PS residues) could inhibit dopaminergic toxicity. Data are expressed as mean ± SEM (n = 4–7 mice) and as a percentage of saline animals. *P < 0.05 and ***P < 0.001, using one-way ANOVA followed by Bonferroni’s multiple comparison test. b Representative immunostainings for TH in the SN of adult mice. A notable decrease in the number of TH+ cells could be observed in mice injected with histamine when compared with saline animals. c Bar graph depicts Nox1 protein expression levels in the SN. Increased expression of Nox1 protein found in histamine (H100)-treated mice was completely abolished by the H1R antagonist. Data are expressed as mean ± SEM (n = 4 mice). *P < 0.05 and **P < 0.01, using one-way ANOVA followed by Bonferroni’s multiple comparison test. d Representative Nox1 (65 kDa) and GAPDH (37 kDa) Western blots in the SN of adult mice in vivo. e Representative confocal photomicrographs showing that histamine-induced Nox1 expression in the perinuclear region of microglial cells in the SN in vivo. Cells were stained for CD11b (green), Nox1 (red), and Hoechst 33342 (nuclei in blue). White arrows highlight Nox1 staining in microglial cells. Scale bar 10 μm

Similar articles

Cited by

References

    1. Brown RE, Stevens DR, Haas HL. The physiology of brain histamine. Prog Neurobiol. 2001;63:637–672. doi: 10.1016/S0301-0082(00)00039-3. - DOI - PubMed
    1. Katoh Y, Niimi M, Yamamoto Y, Kawamura T, Morimoto-Ishizuka T, Sawada M, Takemori H, Yamatodani A. Histamine production by cultured microglial cells of the mouse. Neurosci Lett. 2001;305:181–184. doi: 10.1016/S0304-3940(01)01835-3. - DOI - PubMed
    1. Chikahisa S, Kodama T, Soya A, Sagawa Y, Ishimaru Y, Sei H, Nishino S. Histamine from brain resident MAST cells promotes wakefulness and modulates behavioral states. PLoS One. 2013;8:e78434. doi: 10.1371/journal.pone.0078434. - DOI - PMC - PubMed
    1. Passani MB, Blandina P. Histamine receptors in the CNS as targets for therapeutic intervention. Trends Pharmacol Sci. 2011;32:242–249. doi: 10.1016/j.tips.2011.01.003. - DOI - PubMed
    1. Watanabe T, Taguchi Y, Shiosaka S, Tanaka J, Kubota H, Terano Y, Tohyama M, Wada H. Distribution of the histaminergic neuron system in the central nervous system of rats; a fluorescent immunohistochemical analysis with histidine decarboxylase as a marker. Brain Res. 1984;295:13–25. doi: 10.1016/0006-8993(84)90811-4. - DOI - PubMed

Publication types

MeSH terms

LinkOut - more resources