. 2016 Oct:94:18-31.
doi: 10.1016/j.nbd.2016.05.016. Epub 2016 May 31.

Pathological conformations involving the amino terminus of tau occur early in Alzheimer's disease and are differentially detected by monoclonal antibodies

Affiliations

Pathological conformations involving the amino terminus of tau occur early in Alzheimer's disease and are differentially detected by monoclonal antibodies

Benjamin Combs et al. Neurobiol Dis. 2016 Oct.

Abstract

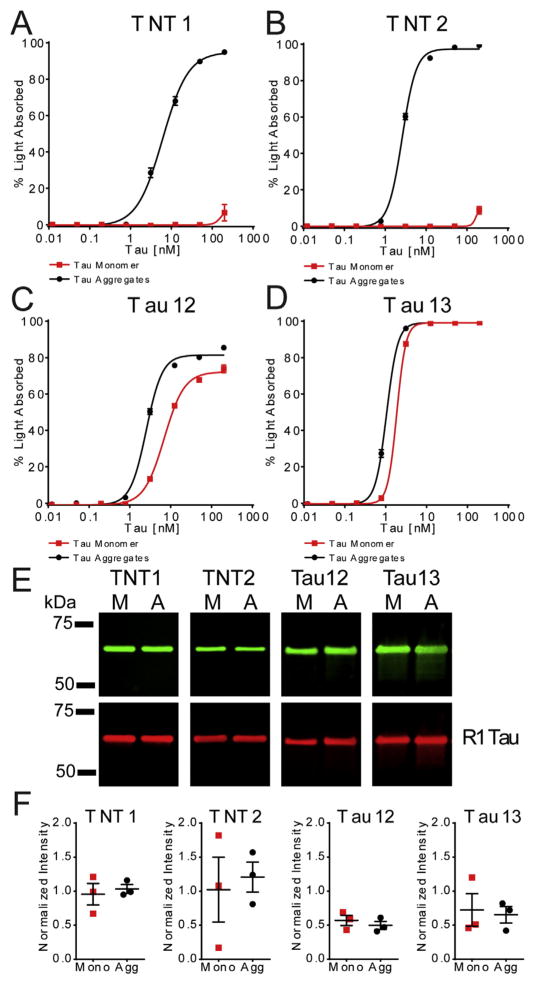
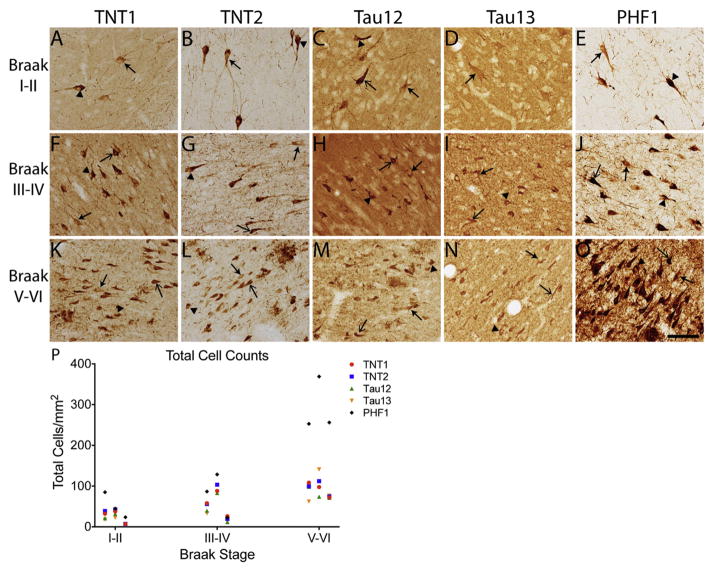
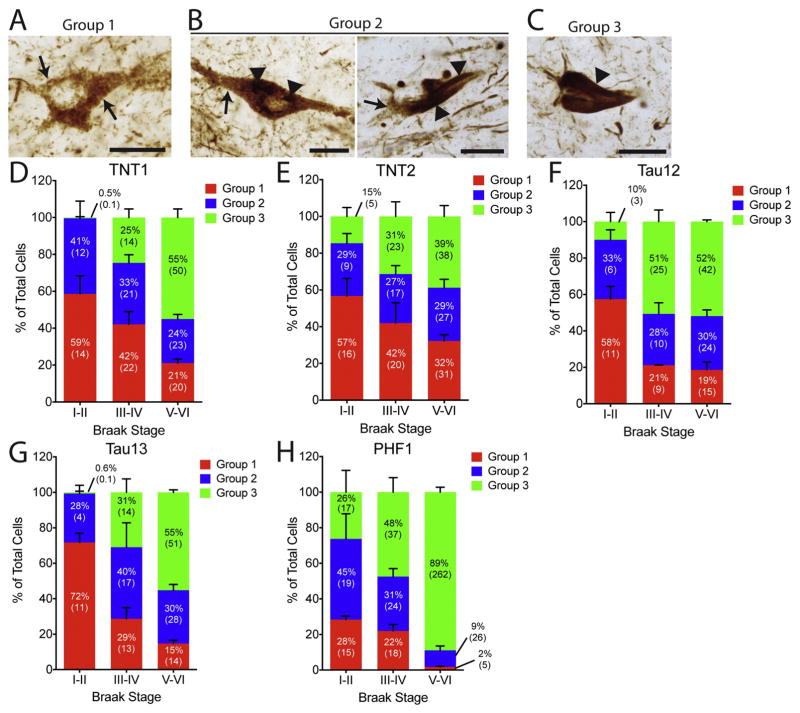
Conformational changes involving the amino terminus of the tau protein are among the earliest alterations associated with tau pathology in Alzheimer's disease and other tauopathies. This region of tau contains a phosphatase-activating domain (PAD) that is aberrantly exposed in pathological forms of the protein, an event that is associated with disruptions in anterograde fast axonal transport. We utilized four antibodies that recognize the amino terminus of tau, TNT1, TNT2 (a novel antibody), Tau12, and Tau13, to further study this important region. Using scanning alanine mutations in recombinant tau proteins, we refined the epitopes of each antibody. We examined the antibodies' relative abilities to specifically label pathological tau in non-denaturing and denaturing assays to gain insight into some of the mechanistic details of PAD exposure. We then determined the pattern of tau pathology labeled by each antibody in human hippocampal sections at various disease stages in order to characterize PAD exposure in the context of disease progression. The characteristics of reactivity for the antibodies fell into two groups. TNT1 and TNT2 recognized epitopes within amino acids 7-12 and specifically identified recombinant tau aggregates and pathological tau from Alzheimer's disease brains in a conformation-dependent manner. These antibodies labeled early pre-tangle pathology from neurons in early Braak stages and colocalized with thiazine red, a marker of fibrillar pathology, in classic neurofibrillary tangles. However, late tangles were negative for TNT1 and TNT2 indicating a loss of the epitope in later stages of tangle evolution. In contrast, Tau12 and Tau13 both identified discontinuous epitopes in the amino terminus and were unable to differentiate between normal and pathological tau in biochemical and tissue immunohistological assays. Despite the close proximity of these epitopes, the antibodies demonstrated remarkably different abilities to identify pathological changes in tau indicating that detection of conformational alterations involving PAD exposure is not achieved by all N-terminal tau antibodies and that a relatively discrete region of the N-terminus (i.e., amino acids 7-12, the TNT1 and TNT2 epitope) is central to the differences between normal and pathological tau. The appearance of PAD in early tau pathology and its disappearance in late-stage tangles suggest that toxic forms of tau are associated with the earliest forms of tau deposits. Collectively, these findings demonstrate that the TNT antibodies are useful markers for early conformational display of PAD and provide information regarding conformational changes that have potential implications in the toxic mechanisms of tau pathology.

Keywords: Alzheimer's disease; Antibodies; Conformation; Neurodegeneration; Protein aggregation; Protein misfolding; Tau; Tauopathies.


Conflict of interest statement

Conflict of interest

The authors report no conflicts of interest.

Figures

Fig. 1
Fig. 1. Antibodies recognize similar but distinct epitopes with high affinity
(AE) The epitopes were mapped using scanning alanine mutant tau proteins in western blots. (A) TNT1 reactivity was eliminated upon mutating amino acids 7–12. Similarly, TNT2 reactivity was disrupted with mutation of amino acids 7–12, and TNT2 displayed less reactivity in general compared to the other antibodies in western blotting. The Tau12 epitope (previously mapped to 2–23 (Horowitz et al., 2004)) was discontinuous as mutating amino acids 8–9 and 13–21 had a strong impact on reactivity. Tau13 is a very high-affinity antibody (previously mapped to 9–18 (Garcia-Sierra et al., 2003)), and similar to Tau12, reactivity for Tau13 was affected by mutating amino acids 8–9, and 13–21. Notably, none of the alanine mutant constructs completely eliminated reactivity, but deletion of amino acids 2–18 completely eliminated reactivity as before (Garcia-Sierra et al., 2003). The R1 tau antibody, a rabbit polyclonal total tau antibody with epitopes throughout the protein (i.e., unaffected by mutant protein changes), was used to identify total levels of all protein constructs. (BE) Signal intensity was quantified for (B) TNT1, (C) TNT2, (D) Tau12, and (E) Tau13 and normalized to R1 signal to confirm elimination/reduction in reactivity with each recombinant tau protein. (F) A schematic representing the specific epitopes for each antibody (TNT1 and TNT2: 7–12; Tau12 and Tau13: 8–9, 13–21) and showing sequence alignments between the first 24 amino acids of human tau. (G) N-terminal antibody-binding affinities for full-length recombinant tau in indirect ELISAs. The antibodies (ranging from 48.8 pg/ml to 100 ng/ml) were incubated with recombinant tau (100 ng/well) bound to a titer ELISA plate. The data were fit to a sigmoidal dose–response curve and EC50 values were determined (vertical lines), indicating the antibody concentration at which half of the maximum signal is obtained. TNT1 (black circles) EC50 = 4.86 ng/ml, TNT2 (blue squares) EC50 = 9.21 ng/ml, Tau12 (red diamonds) EC50 = 3.27 ng/ml, Tau13 (green triangles) EC50 = 2.51 ng/ml.
Fig. 2
Fig. 2. TNT1 and TNT2 binding is selective for aggregated tau and is conformation dependent
(AD). The binding affinity of (A) TNT1, (B) TNT2, (C) Tau12, and (D) Tau13 for monomeric and aggregated recombinant tau samples (ranging from 12.2 pM to 200 nM) were measured using sandwich ELISAs (n = 3; mean ± SEM). (A) TNT1 showed reactivity with aggregated tau (black circles) starting at 3.125 nM (EC50 = 6.0 nM) but did not detect monomeric tau (red squares) until it reached 200 nM (EC50 = undetermined). (B) Similarly, TNT2 robustly reacted with aggregated tau starting at 0.781 nM (TNT2: EC50 = 2.6 nM) but did not detect monomeric tau until it reached 200 nM (EC50 = undetermined). (C) Tau12 displayed a slight preference for aggregated tau (EC50 = 6.9 nM) over monomeric tau (EC50 = 2.5 nM). (D) Tau13 recognized monomeric (EC50 = 1.9 nM) and aggregated (EC50 = 1.1 nM) tau similarly at all concentrations. (E) The same monomer and aggregated tau samples were denatured and run on SDS-PAGE/western blots to determine whether the aggregated tau-selective reactivity was conformation-dependent. Representative blots with TNT1, TNT2, Tau12, and Tau13 demonstrating equal reactivity to the denatured monomeric and aggregated samples (top). Equivalent amounts of tau were confirmed with R1, a pan-tau antibody (bottom). (F) The signal intensities associated with each antibody’s reactivity to monomeric (red squares) and aggregated (black circles) tau samples were quantified and normalized to the R1 values. This quantitation showed equal reactivity in western blots with TNT1: p = 0.593, t(2) = 0.630; TNT2: p = 0.550, t(2) = 0.713; Tau12: p = 0.368, t(2) = 1.153; Tau13: p = 0.742, t(2) = 0.378 (compared with paired t-tests).
Fig. 3
Fig. 3. TNT1 and TNT2 recognize pathological but not normal tau dependent upon conformation
TNT1 and TNT2 display conformation-dependent recognition of PAD-exposed tau in Alzheimer’s disease, which is not present in non-demented controls. (A) Soluble protein fractions from human frontal cortex lysates of control and AD brains were used in sandwich ELISAs using TNT1, TNT2, Tau12, Tau13, or PHF1 as the capture antibody. TNT1, TNT2, and PHF1 all detected significantly more tau in AD lysates (black squares) than in control lysates (red circles) (n = 6; mean ± SEM; *p < 0.05, unpaired t-test, TNT1: t(10) = 4.843, p = 0.0007; TNT2: t(10) = 7.303; p < 0.0001; Tau12: t(10) = 1.228; p = 0.2475; Tau13: t(10) = 0.9758; p = 0.3522; PHF1: (t(10) = 2.504; p = 0.0312)). (B) Sandwich ELISAs were also carried out with sarkosyl-insoluble protein fractions from human frontal cortex lysates of control and AD brains. Significantly more tau was detected in the sarkosyl-insoluble protein fractions from AD lysates than the control lysates with all antibodies (n = 5 for control and n = 6 AD; mean ± SEM; *p < 0.05, unpaired t-test, TNT1: (t(9) = 2.923; p = 0.0169), TNT2: (t(9) = 4.301; p = 0.002), Tau12: (t(9) = 3.228; p = 0.0103), Tau13: (t(9) = 2.398; p = 0.04) and PHF1: (t(9) = 2.264; p = 0.0499)). (C) The soluble fractions for control and AD brains were run under denaturing conditions in western blots. Samples were loaded at 60 μg total protein/lane for TNT1 and TNT2 and 20 μg total protein/lane for Tau12 and Tau13. GAPDH was used as a loading control to confirm equal loading and R1, a pan-tau antibody, was used to determine the total amounts of tau in the samples. Notably, TNT1 and TNT2 did not work as well as Tau12 or Tau13 in western blot assays. (D) Tau signal intensities from the control and AD western blots were quantified and normalized to the GAPDH signal. All antibodies detected similar levels of tau in the control samples (red circles) compared to the AD samples (black squares) under denaturing conditions (mean ± SEM, p > 0.05 for all comparisons in unpaired t-tests, TNT1: t(4) = 0.234, p = 0.827; TNT2: t(4) = 0.029, p = 0.978; Tau12: t(4) = 0.451, p = 0.675; Tau13: t(4) = 2.699, p = 0.055). Detection with the pan-tau R1 antibody confirmed that similar amounts of tau were present in the control and AD samples (mean ± SEM, p > 0.05 for all comparisons in unpaired t-tests, t(4) = 0.881, p = 0.428 (TNT1 blot); t(4) = 0.984, p = 0.381 (TNT2 blot); t(4) = 1.198, p = 0.297 (Tau12 blot); t(4) = 1.727, p = 0.159 (Tau13 blot)).
Fig. 4
Fig. 4. N-terminal antibodies label early tau pathology in the hippocampus and the extent of pathology increases with advancing Braak stage
(A) TNT1, (B) TNT2, (C) Tau12, (D) Tau13, and (E) PHF1 labeled diffuse, granular pre-tangle neurons in hippocampal neurons of Braak stage I–II cases. There was a notable difference in the extent of parenchymal tau labeled by each of the antibodies. TNT1, TNT2, and PHF1 produced little to no parenchymal tau signal. In contrast, both Tau12 and Tau13 robustly labeled parenchymal tau (i.e., non-pathological tau). (F–J) In Braak stage III–IV cases, (F) TNT1, (G) TNT2, (H) Tau12, (I) Tau13, and (J) PHF1 detected increased pathology and more compact tau inclusions characteristic of group 2 and 3 neurons. Tau12 (H) and Tau13 (I) continued to strongly label parenchymal tau, and neuritic threads were not as evident. (K—O) The extent of (K) TNT1-, (L) TNT2-, (M) Tau12-, and (N) Tau13-positive pathology continued to increase and early pre-tangle neurons were still present in late-stage cases. (M) Tau12 and (N) Tau13 labeled early tau pathology and parenchymal tau but at lower levels than in the earlier cases. (O) PHF1 displayed intense reactivity to the tau pathology with the vast majority representing classic NFTs, as well as robust thread labeling. Examples of neurons with diffuse, granular pre-tangle pathology (i.e., group 1) are identified with closed arrows, intermediate neurons containing a combination of granular and compact inclusions (i.e., group 2) are identified with closed arrowheads, and classic, compact neurofibrillary tangles (i.e., group 3) are identified with open arrows. Scale bar represents 100 μm. (P) The cell density of all neurons labeled with each N-terminal antibody (TNT1, red circles; TNT2, blue squares; Tau12, green triangles; Tau13, orange triangles; PHF1, black diamonds) showed a strong, significant positive correlation with increasing Braak stage (TNT1: r = 0.791, p = 0.021; TNT2: r = 0.738, p = 0.037; Tau12: r = 0.738, p = 0.037; Tau13: r = 0.738, p = 0.037; PHF1: r = 0.791, p = 0.021).
Fig. 5
Fig. 5. Percentages of the different phenotypes of tau pathology deposition with N-terminal tau antibodies in human hippocampal tissue across Braak stages
(A–C) Representative examples of (A) a group 1 neuron, (B) two group 2 neurons, and (C) a group 3 neuron. These cellular phenotypes are established previously (Braak et al., 1994). Group 1 cells are characterized by diffuse granular cytoplasmic staining (arrows), group 2 cells contain diffuse granular staining (arrows) and some discrete regions of more compact inclusions (arrowheads), and group 3 neurons no longer contain diffuse granular staining but contain large compact tangles (arrowhead, i.e., classic NFTs). Scale bars are 25 μm in (A–C). (D–H). The percentage of group 1, 2, and 3 cells (reported as the mean of the percents from each case with error bars representing the SEM), with the total number of cells/mm2 in parentheses (reported as the mean of cell densities from each case), labeled by the (D) TNT1, (E) TNT2, (F) Tau12, (G) Tau13, and (H) PHF1 antibody are compared between the Braak stages. (D) In Braak I–II cases, TNT1 labeled more group 1 and 2 cells compared to group 3 cells. In Braak III–IV cases, TNT1 labeled similar amounts of each phenotype, while in Braak V–VI cases, more group 3 cells were labeled when compared to group 1 and 2 cells. (E) TNT2 labeled more group 1 cells compared to group 3 cells, while in Braak III–IV cases, similar amounts of each phenotype were labeled, and in Braak V–VI cases, the majority were group 3 cells. (F) In Braak I–II cases, Tau12 labeled more group 1 cells compared to group 2 and 3 cells. In both Braak III–IV and V–VI cases, Tau12 labeled more group 3 cells compared to group 1 and 2 cells. (G) Tau13 labeled more group 1 cells compared to group 2 and 3 cells. Similar proportions of each phenotype were identified with Tau13 in Braak III–IV cases, while in Braak V–VI cases more group 3 cells were labeled when compared to group 1 and 2 cells. (H) PHF1 stained similar amounts of all three cell phenotypes in Braak I–II and more group 3 cells compared to groups 1 and 2 in III–IV cases. A dramatic increase in PHF1 labeled group 3 cells was observed in Braak V–VI cases.
Fig. 6
Fig. 6. Multi-label fluorescent stain indicates TNT1 detects early tau pathology in disease
Qualitative assessment of TNT1 reactivity confirmed that PAD exposure occurred in early, pre-tangle pathology, remained in classic NFTs, but was absent in later stage NFTs (e.g. ghost tangles). Representative multi-label fluorescent stain images were capture to show TNT1 (A, E, I; green, a marker of PAD-exposed tau), ThR (B, F, J; red, β-sheet structure present in classic NFTs), and DAPI (C, G, K; blue, nuclei). Merged images are shown in (D, H, L). (AD) TNT1 labeled diffuse pre-tangles in Braak I–II that were ThR negative (solid arrow). (EH) TNT1 identified neurons that are ThR negative (solid arrow) and more compact classic NFTs that are ThR positive (open arrow) in Braak stages III–IV. Occasional late-stage NFTs (e.g. ghost tangles lacking nuclei) were ThR positive and TNT1 negative (solid arrowhead). (IL) TNT1 continued to label ThR-negative structures (solid arrow) in Braak V–VI, as well as more mature ThR-positive NFT inclusions (open arrow). Notably, the vast majority of TNT1-positive threads were ThR negative. Many ThR-positive cells were TNT1 negative and did not have nuclei (i.e., ghost tangles) in the later disease stages (solid arrowhead). Scale bars represent 50 μm.
Fig. 7
Fig. 7. Multi-label fluorescent stain indicates TNT2 detects early tau pathology in disease
Qualitative assessment of TNT2 reactivity confirmed that PAD exposure occurred in early, pre-tangle pathology, remained in classic NFTs but was absent in later stage NFTs (e.g. ghost tangles). Representative multi-label fluorescent stain images were captured to show TNT2 (A, E, I; green, a marker of PAD-exposed tau), ThR (B, F, J; red, β-sheet structure present in classic NFTs), and DAPI (C, G, K; blue, nuclei). Merged images are shown in (D, H, L). (AD) TNT2 labeled diffuse pre-tangles in Braak I–II that were ThR negative (solid arrow). (EH) TNT2 identified neurons that are ThR negative (solid arrow), as well as more compact classic NFTs that are ThR positive (open arrow) in Braak stages III–IV. Occasional late-stage NFTs (e.g. ghost tangles lacking nuclei) were ThR positive and TNT2 negative (solid arrowhead). (IL) TNT2 continued to label ThR-negative structures (solid arrow) in Braak V–VI, as well as more mature ThR-positive NFT inclusions (open arrow). Like TNT1, the vast majority of TNT2-positive threads were ThR-negative and many of ThR-positive cells were TNT2 negative and did not have nuclei (i.e., ghost tangles; solid arrowhead). Scale bars represent 50 μm.

References

    1. Augustinack JC, et al. Specific tau phosphorylation sites correlate with severity of neuronal cytopathology in Alzheimer’s disease. Acta Neuropathol (Berl) 2002;103:26–35. - PubMed
    1. Bancher C, et al. Accumulation of abnormally phosphorylated tau precedes the formation of neurofibrillary tangles in Alzheimer’s disease. Brain Res. 1989;477:90–99. - PubMed
    1. Bancher C, et al. Abnormal phosphorylation of tau precedes ubiquitination in neurofibrillary pathology of Alzheimer disease. Brain Res. 1991;539:11–18. - PubMed
    1. Berry RW, et al. Tau epitope display in progressive supranuclear palsy and corticobasal degeneration. J Neurocytol. 2004;33:287–295. - PubMed
    1. Bobinski M, et al. Relationships between regional neuronal loss and neurofibrillary changes in the hippocampal formation and duration and severity of Alzheimer disease. J Neuropathol Exp Neurol. 1997;56:414–420. - PubMed