. 2016 Jun 21;113(25):E3529-37.
doi: 10.1073/pnas.1601012113. Epub 2016 Jun 3.

Diversity and divergence of the glioma-infiltrating T-cell receptor repertoire

Affiliations

Diversity and divergence of the glioma-infiltrating T-cell receptor repertoire

Jennifer S Sims et al. Proc Natl Acad Sci U S A. .

Abstract

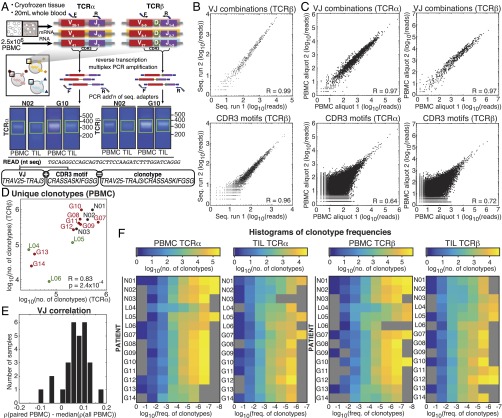
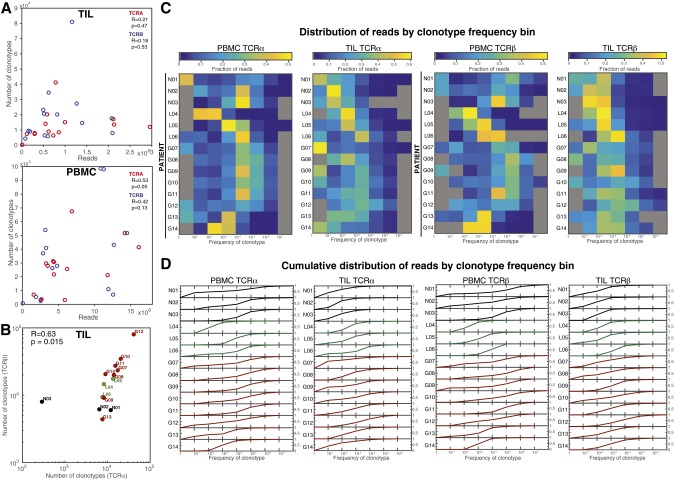
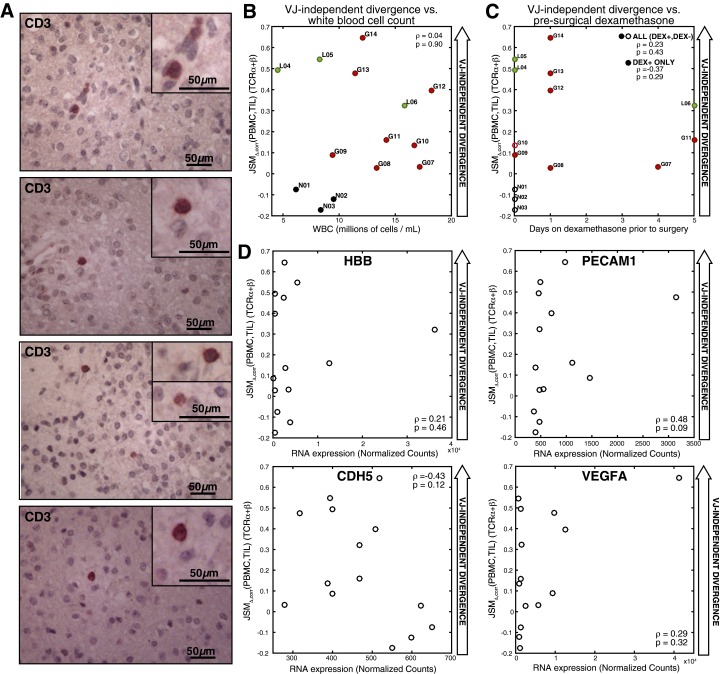
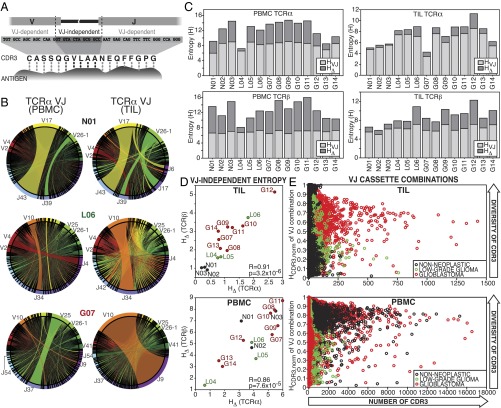
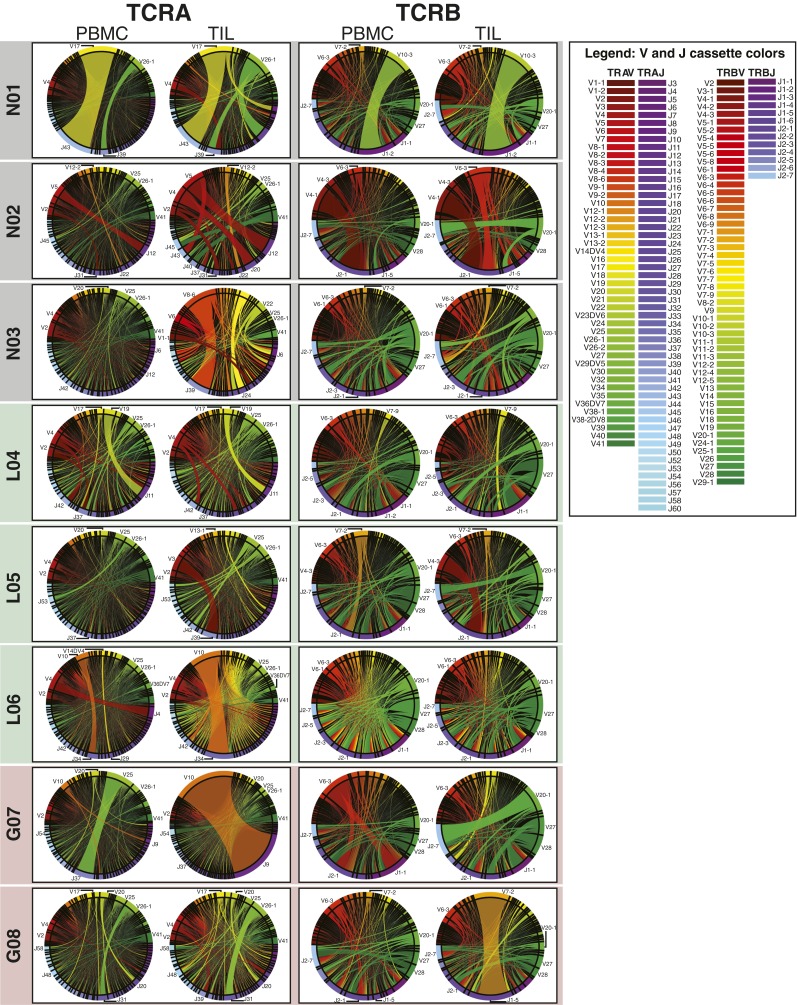
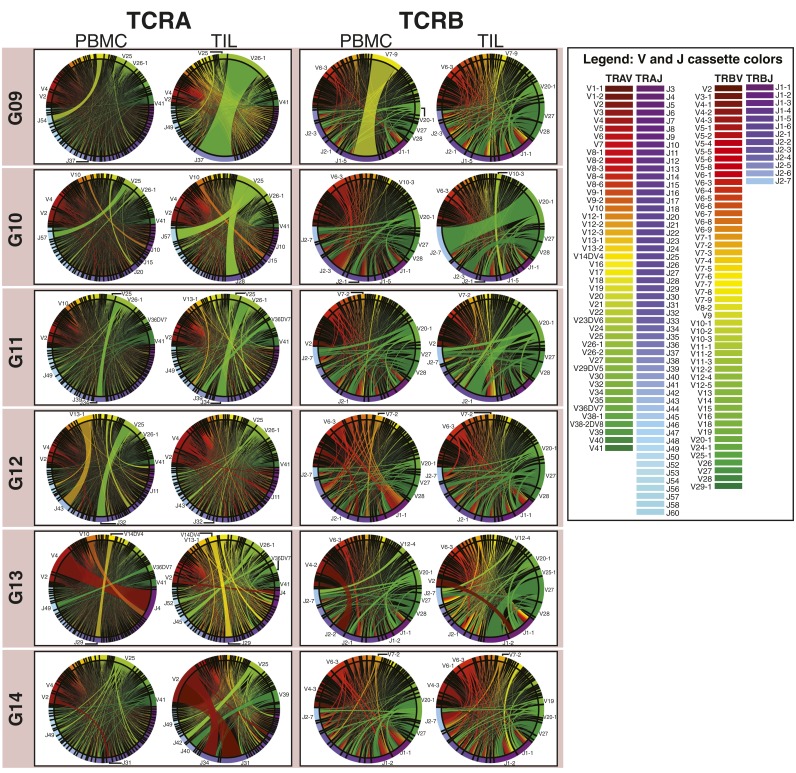
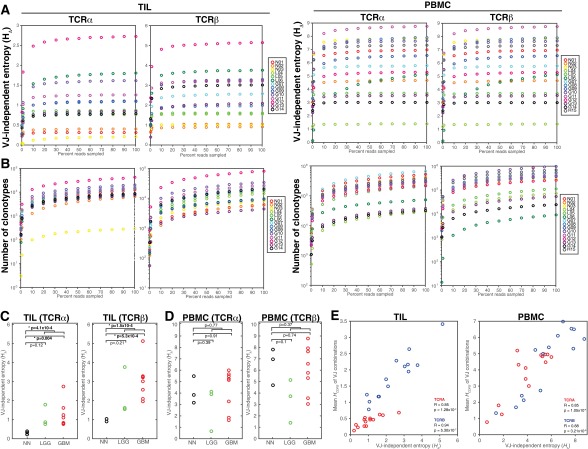
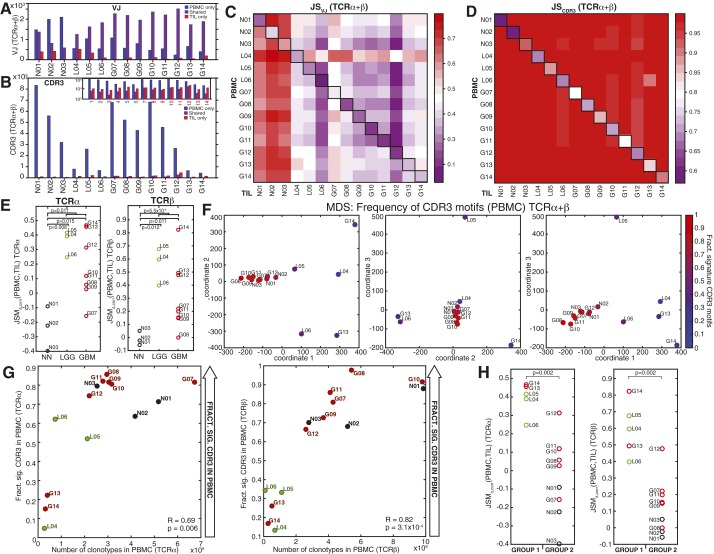
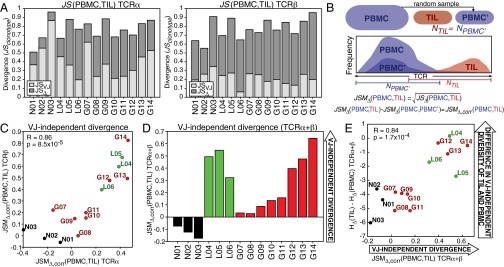
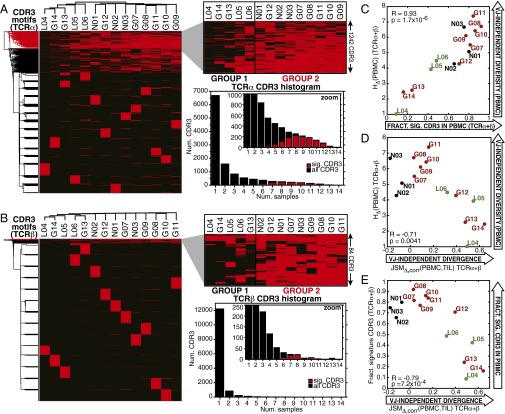
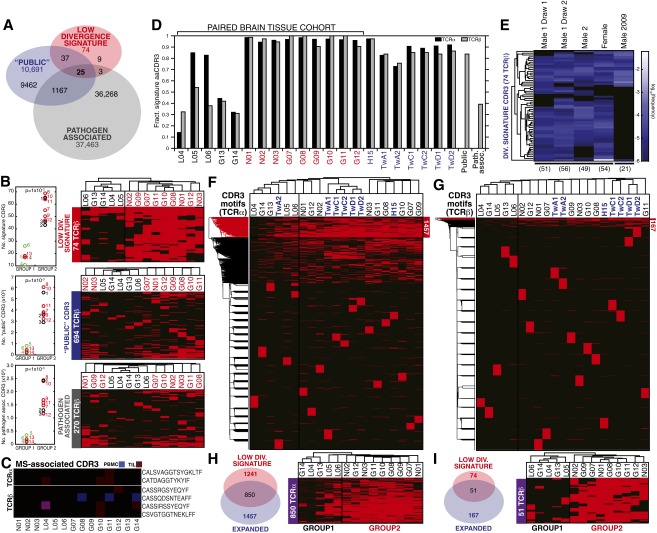
Although immune signaling has emerged as a defining feature of the glioma microenvironment, how the underlying structure of the glioma-infiltrating T-cell population differs from that of the blood from which it originates has been difficult to measure directly in patients. High-throughput sequencing of T-cell receptor (TCR) repertoires (TCRseq) provides a population-wide statistical description of how T cells respond to disease. We have defined immunophenotypes of whole repertoires based on TCRseq of the α- and β-chains from glioma tissue, nonneoplastic brain tissue, and peripheral blood from patients. Using information theory, we partitioned the diversity of these TCR repertoires into that from the distribution of VJ cassette combinations and diversity due to VJ-independent factors, such as selection due to antigen binding. Tumor-infiltrating lymphocytes (TILs) possessed higher VJ-independent diversity than nonneoplastic tissue, stratifying patients according to tumor grade. We found that the VJ-independent components of tumor-associated repertoires diverge more from their corresponding peripheral repertoires than T-cell populations in nonneoplastic brain tissue, particularly for low-grade gliomas. Finally, we identified a "signature" set of TCRs whose use in peripheral blood is associated with patients exhibiting low TIL divergence and is depleted in patients with highly divergent TIL repertoires. This signature is detectable in peripheral blood, and therefore accessible noninvasively. We anticipate that these immunophenotypes will be foundational to monitoring and predicting response to antiglioma vaccines and immunotherapy.

Keywords: T-cell receptor; glioblastoma; glioma; immunooncology; immunoprofiling.


Conflict of interest statement

The authors declare no conflict of interest.

Figures

Fig. 1.
Fig. 1.
TCRα and TCRβ repertoires from brain tissue and matched peripheral blood. (A) Gene-specific reverse transcription and PCR of the CDR3 region using pan-repertoire primers (V-J/C) was performed on mRNA of tissue biopsies and total RNA of ∼1 × 10⁶ T cells, followed by bead purification and second amplification incorporating sequencing adapters. Libraries were purified by gel electrophoresis (example extracted regions in green) and sequenced (PE250). Following error analysis and read filtration (SI Materials and Methods), merged reads were translated in silico, and productive reads were tabulated by V and J cassette identity, amino acid CDR3 motif, and the combination of VJ cassette combinations and amino acid CDR3 used to identify unique clonotypes. (B) Correlation between the abundance detected in two sequencing runs of a single TCRseq library (L06 TIL TCRβ) of VJ combinations and CDR3 motifs. (C) Correlation between the abundance in two aliquots of PBMC from the same draw (H15) of VJ cassette combinations and CDR3 motifs. Pearson correlation coefficients between VJ cassette combination abundance (R = 0.97 for TCRα and 0.97 for TCRβ) and CDR3 motif abundance (R = 0.64 for TCRα and 0.72 for TCRβ). (D) The number of clonotypes (the unique combination of a V and J cassette pair with a CDR3 amino acid motif) observed in the PBMC of patients. Pearson correlation between log10(clonotypes) of TCRα and TCRβ is shown (R = 0.83, P = 2.4 × 10⁻⁴). Label colors indicate clinical status (GBM, red; LGG, green; and nonneoplastic, black). (E) The Spearman correlation (ρ) of VJ combination frequencies between each TIL sample and its paired PBMC was calculated, and the median (ρ) of its correlation with all PBMCs was subtracted. Resulting values for each TIL library are displayed as a histogram. (F) Heat maps of the number of clonotypes (colorbars) occurring at frequencies (x axis) for TCRα (Left) and TCRβ (Right) chains of the PBMC and TIL of each patient (y axes). Unpopulated frequency bins are displayed in gray.
Fig. S1.
Fig. S1.
Distribution of clonotypes and sequencing read abundance. (A) For TIL repertoires (Top) and PBMC repertoires (Bottom), the relationship between number of reads and the number of unique clonotypes are plotted for TCRα (red) and TCRβ (blue), with Pearson correlations shown (TIL TCRα R = 0.21, P = 0.47 and TCRβ R = 0.18, P = 0.53; PBMC TCRα R = 0.53, P = 0.05 and TCRβ R = 0.42, P = 0.13). (B) The number of clonotypes (unique combinations of VJ and CDR3 amino acid motifs) observed in the TILs of patients. The Pearson correlation between the number of TCRα and TCRβ clonotypes across patients was (R = 0.96, P = 4.3 × 10⁻⁸), and that of log10(clonotypes) was (R = 0.63, P = 0.015, shown). Label colors indicate clinical status (GBM, red; LGG, green; and nonneoplastic, black). (C) Read abundance is distributed across clonotype frequencies; that is, although most unique clonotypes occur at the lowest frequencies (Fig. 1F), the lowest-frequency clonotypes do not comprise the largest fraction of the repertoire for either the PBMC or TIL repertoires. Heat maps of the fraction of reads from bins of clonotype frequencies (x axes) for TCRα (Left) and TCRβ (Right) chains of the PBMC and TIL of each patient (y axes). Unpopulated frequency bins are displayed in gray, and all others contain the fraction of reads indicated by each colorbar. (D) For each patient, lines are plotted for the cumulative fraction of reads (0–1, y axes) across the clonotype frequency bins, illustrating the proportion of the overall repertoire included upon filtering for clonotype frequency of these levels.
Fig. S2.
Fig. S2.
Clinical features of T-cell populations. (A) Immunoperoxidase staining for CD3 labels infiltrating T lymphocytes scattered throughout the tumor tissue (patient L06, 20× objective shown, inset images zoomed 2×). (B) The Spearman correlation between VJ-independent divergence (JSMΔ,corr, TCRα and TCRβ averaged) and peripheral blood leukocyte count (white blood cell titer, in millions of cells per mL) was not significant (rho = 0.04, P = 0.90). (C) The Spearman correlation between VJ-independent divergence (JSMΔ,corr, TCRα and TCRβ averaged) and duration of corticosteroid treatment (dexamethasone) before surgery and the Spearman correlation were calculated for all patients (rho = 0.23, P = 0.43) and for only the group who received dexamethasone (DEX+, rho = 0.37, P = 0.29), revealing no significance. Patients who did not receive dexamethasone at all before surgery (DEX−) are shown with hollow markers. (D) The spearman correlation was calculated between JSMΔ,corr of TCRα and TCRβ (averaged) and the expression of markers of the vascular endothelium (normalized counts by RNA-seq): PECAM-1 (rho = 0.48, P = 0.09), HBB (rho = 0.21, P = 0.46), CDH5 (rho = -0.43, P = 0.12), and VEGFA (rho = 0.29, P = 0.32).
Fig. 2.
Fig. 2.
Entropy-based dissection of TCR diversity. (A) The components of the Shannon entropy of a single CDR3 sequence are displayed, reflecting the VJ-dependent (light gray) and VJ-independent (dark gray) origins of the information given by each residue, including the addition of random nucleotides upon the joining of cassettes and the replacement of some cassette-encoded nucleotides with random bases (dashed lines). Although all amino acids in the CDR3 motif participate in antigen binding (dotted connectors), some are determined entirely by V and J cassette sequence, whereas others are entirely independent. (B) The frequencies of VJ combinations in select PBMC (Left) and TIL (Right) TCRα repertoires are displayed in circular plots, with frequency of each V or J cassette represented by its arc length and that of the VJ cassette combination by the width of the joining ribbon. (C) The entropy of the clonotype repertoire (Hclonotype) for the PBMC (Left) and TIL (Right) of each patient (x axis) is displayed as the sum of the entropy of the VJ repertoire (HVJ, light gray) and the VJ-independent entropy (HΔ, dark gray). (D) For each patient, the VJ-independent entropy (HΔ) of the TIL (Top) and PBMC (Bottom) repertoires were calculated, as well as the Pearson correlations between TCRα (x axis) and TCRβ (y axis) across patients (PBMC R = 0.86, P = 7.6 × 10⁻⁵; TIL R = 0.92, P = 3.2 × 10⁻⁶). Label colors indicate clinical status (GBM, red; LGG, green; and nonneoplastic, black). (E) To illustrate relationship between the VJ-independent entropy of the clonotype repertoire and the CDR3 amino acid diversity of each VJ cassette combination, these combinations were plotted for each patient according to the number of CDR3 motifs encoded (x axis) and the normalized Shannon entropy of those CDR3 (y axis), with colors of each VJ cassette combination indicating clinical status of the patient (GBM, red; LGG, green; and nonneoplastic, black; TCRα and TCRβ are displayed together).
Fig. S6.
Fig. S6.
Circular visualization of V and J cassette repertoire distributions. Circular plots for each pair of PBMC and TIL TCRα (Left) and TCRβ (Right) repertoires were generated using a customized Circos package then grouped by subject and color-coded by clinical status (black, nonneoplastic; green, LGG; and red, GBM). V cassettes appear in the upper arc of each circle and are colored red to green; J cassettes in the lower arc of the circle are colored purple to blue (see color legends), with the arc length of each V or J cassette on the edge representing its frequency and the ribbon between them the frequency of the VJ combination.
Fig. S6.
Fig. S6.
Circular visualization of V and J cassette repertoire distributions. Circular plots for each pair of PBMC and TIL TCRα (Left) and TCRβ (Right) repertoires were generated using a customized Circos package then grouped by subject and color-coded by clinical status (black, nonneoplastic; green, LGG; and red, GBM). V cassettes appear in the upper arc of each circle and are colored red to green; J cassettes in the lower arc of the circle are colored purple to blue (see color legends), with the arc length of each V or J cassette on the edge representing its frequency and the ribbon between them the frequency of the VJ combination.
Fig. S3.
Fig. S3.
VJ-independent entropy (HΔ) of TIL and PBMC repertoires. The error-filtered, merged paired-end reads of each PBMC (Left) and TIL (Right) TCRseq libraries were downsampled to 0.1%, 1%, and 10–90% (x axis). (A) The VJ-independent entropy (HΔ = HclonotypeHVJ, y axes) is graphed for each down-sampled TCRα and TCRβ repertoire. (B) The number of unique clonotypes detected (y axes) at each sample size (x axes) is graphed for each down-sampled TCRα and TCRβ repertoire. (C) The VJ-independent diversity (HΔ) of the TCRα (Left) and TCRβ (Right) TIL repertoires are plotted by clinical status (GBM, red; LGG, green; and nonneoplastic, black), with brackets and P values indicating the significance by two-sample t test of the difference between (i) nonneoplastic and all glioma patients, (ii) nonneoplastic and GBM patients, and (iii) nonneoplastic and LGG patients. (D) The VJ-independent diversity (HΔ) of the TCRα (Left) and TCRβ (Right) PBMC repertoires is plotted by clinical status, with the significance of differences between clinical groups shown. (E) For each VJ combination in each TIL (C) or PBMC (D) repertoire, the number and frequency of each CDR3 amino acid motif encoded was used to calculate the entropy of the CDR3 distribution (HCDR3) for that VJ combination. The mean HCDR3 for all VJ combinations in each repertoire (y axes) is compared with the HΔ for that repertoire. Pearson correlation was significant across patients for both TCRα (red; PBMC, Right R = 0.85, P = 1.1 × 10⁻⁴; TIL, Left R = 0.85, P = 1.3 × 10⁻⁴) and TCRβ (blue; PBMC, Right R = 0.88, P = 3.2 × 10⁻⁵; TIL, Left R = 0.94, P = 5.3 × 10⁻⁷).
Fig. S4.
Fig. S4.
Divergence of PBMC and TIL repertoires and clustering of patients by peripheral blood CDR3. (A and B) Number of VJ cassette combinations (A) and CDR3 amino acid motifs (B) observed in PBMC repertoire only (blue), TIL repertoire only (red), or both TIL and PBMC (shared, purple) for each patient (x axis). (Inset) This number on a log10 scale to illustrate the values for shared and TIL-only CDR3 motifs. (C and D) The Jensen–Shannon divergence (JS) between the PBMC (y axis) and TIL (x axis) VJ cassette combination repertoires (C) or CDR3 repertoires (D) are shown in the heat maps (colorbars), with sample pairs from each patient annotated (black boxes). Each square in the heat map represents the average of JS(PBMC,TIL) for TCRα and TCRβ. (E) The VJ-independent divergence, JSMΔ,corr(PBMC,TIL), of the TCRα (Left) and TCRβ (Right) repertoires of each patient are plotted by clinical status (GBM, red; LGG, green; and nonneoplastic, black), with brackets and P values indicating the significance by two-sample t test of the difference between (i) nonneoplastic and all glioma patients, (ii) nonneoplastic and GBM patients, and (iii) nonneoplastic and LGG patients. (F) MDS of patients using the frequency of the combined top use CDR3 motifs in PBMC (11,638 TCRα, 13,561 TCRβ). The scaled distance between each patient is displayed along coordinates 1 and 2 (Left), 2 and 3 (Center), and 1 and 3 (Right). Colors represent the fraction of signature CDR3 motifs (average of TCRα and TCRβ) observed in each patient’s PBMC. (G) Correlation between the number of clonotypes and the fraction of signature CDR3 motifs (Fig. 4) observed in PBMC libraries for TCRα (Left, Pearson correlation R = 0.69, P = 0.006) and TCRβ (Right, Pearson correlation R = 0.82, P = 3.1 × 10⁻⁴). (H) The VJ-independent divergence, JSMΔ,corr(PBMC,TIL), of the two patient groups observed by hierarchical clustering in Fig. 4 were compared by Wilcoxon rank sum for both TCRα (Left) and TCRβ (Right), with P = 0.002 in both cases.
Fig. 3.
Fig. 3.
VJ-independent divergence distinguishes TIL of glioma from nonneoplastic tissue. (A) The VJ-dependent (light gray) and -independent (dark gray) Jensen–Shannon divergence, JS(PBMC,TIL), was calculated for each patient (x axis). (B) Statistical divergence between PBMC and TIL due to population size was simulated using a control population (PBMC′), randomly sampled from the PBMC repertoire, containing the same number of clonotypes as the TIL (NTIL), and the JSMΔ between PBMC and PBMC′ was subtracted from JSMΔ between the PBMC and TIL, yielding JSMΔ,corr(PBMC,TIL). (C) Correlation between JSMΔ,corr(PBMC,TIL) of TCRα and TCRβ across patients (Pearson R = 0.86, P = 8.5 × 10⁻⁵). (D) The average JSMΔ,corr of the α and β chains is plotted with colors indicating clinical status (GBM, red; LGG, green; and nonneoplastic, black). (E) The JSMΔ,corr(PBMC,TIL) (average of TCRα and TCRβ) of each patient was compared with the difference between the VJ-independent diversity HΔ of the TIL and of the PBMC (Pearson R = 0.84, P = 1.7 × 10⁻⁴).
Fig. 4.
Fig. 4.
Use of highly shared CDR3 motifs in peripheral TCR repertoire predict VJ-independent divergence of PBMC and TIL. (A and B) Hierarchical clustering of top use TCRα and TCRβ CDR3 amino acid motifs. The top 1,000 CDR3 amino acid motifs from each of the 14 PBMC repertoires were compiled into a high-use list of 11,668 TCRα and 13,561 TCRβ with frequencies ≥10−5. Patients were hierarchically clustered by the presence or absence of these CDR3 motifs (y axes) across samples (x axes), revealing a subset of subjects (group 2) in which a cluster of 1,242 TCRα and 84 TCRβ motifs were commonly used (red dendrogram clusters) and a cluster of subjects in which these motifs were less frequently observed (group 1). Histograms of the number of samples in which each CDR3 was observed, with the 1,242 signature TCRα (median = 9) and 84 TCRβ (median = 8) highlighted in red, and the total top use set shown in black (median = 1, both chains). (C) The correlation between the VJ-independent entropy (HΔ) of PBMC repertoires and the fraction of the signature CDR3s they contain (average of TCRα and TCRβ for each patient) is plotted (Pearson R = 0.93, P = 1.7 × 10⁻⁶). (D) The correlation between VJ-independent divergence, JSMΔ,corr(PBMC,TIL), and the VJ-independent entropy (HΔ) of the PBMC (average of TCRα and TCRβ) is plotted (Pearson R = −0.71, P = 0.0041). (E) The VJ-independent divergence, JSMΔ,corr(PBMC,TIL), of each patient is plotted against the fraction of signature CDR3 motifs observed in the PBMC repertoire (average of TCRα and TCRβ), revealing significant anticorrelation (Pearson R = −0.79, P = 7.2 × 10⁻⁴).
Fig. S5.
Fig. S5.
Distribution of CDR3 motifs of the low-divergence signature and previously published specificities. (A) Overlap among 10,691 public TCRβ CDR3 amino acid motifs described by Britanova et al. (21), 37,463 TCRβ CDR3 compiled from several studies for association with common pathogens, and our signature set (74 TCRβ CDR3, SI Materials and Methods). (B) (Left) Significantly higher numbers of signature (Top), public (Middle), and pathogen-associated CDR3s (Bottom) were observed in the TCRβ PBMC repertoires of group 2 patients than of group 1 patients (P = 1 × 10⁻³ for all CDR3 sets, Wilcoxon rank sum). (Right) The top use TCRβ CDR3 motifs (as in Fig. 4B) were filtered on the signature set (Top), the Britanova et al. (21) public set (Middle), and the pathogen-associated CDR3 set (Bottom) and patients hierarchically clustered by their presence and absence. (C) Among CDR3 motifs previously associated with targeting myelin-basic protein in MS patients (9 TCRα, 81 TCRβ; SI Materials and Methods), six were observed in our cohort (frequency ≥10−5), as indicated by patient (x axis) and tissue (blue, PBMC; red, TIL; and purple, both). (D) The fraction of the signature CDR3 (1,241 TCRα, 74 TCRβ) observed in PBMC of group 1 (black), group 2 (red), and additional healthy human subjects (blue), as well as the public and pathogen-associated sets (gray). (E) Signature CDR3 motifs were observed in TCRβ repertoires of healthy individuals sequenced using a different method in two studies (black lines, SI Materials and Methods) at frequencies ≥10−6 (heat map). (F and G) The top 1,000 most abundant CDR3 motifs (frequency ≥10−5) were compiled from the 14-patient cohort, subject H15, and additional healthy subjects (16,564 TCRα, 20,395 TCRβ) and hierarchically clustered by presence or absence of these CDR3 motifs (y axes) across samples (x axes). (H and I) Overlap between the TCRα and TCRβ CDR3 clusters stratifying the 21 PBMC repertoires (F and G) and the signature sets (Left). Hierarchical clustering of the paired brain tissue cohort with respect to the presence or absence of these overlapping CDR3 motifs recapitulated the initial group 1 and group 2.

References

    1. Phillips HS, et al. Molecular subclasses of high-grade glioma predict prognosis, delineate a pattern of disease progression, and resemble stages in neurogenesis. Cancer Cell. 2006;9(3):157–173. - PubMed
    1. Verhaak RG, et al. Cancer Genome Atlas Research Network Integrated genomic analysis identifies clinically relevant subtypes of glioblastoma characterized by abnormalities in PDGFRA, IDH1, EGFR, and NF1. Cancer Cell. 2010;17(1):98–110. - PMC - PubMed
    1. Ivliev AE, ’t Hoen PA, Sergeeva MG. Coexpression network analysis identifies transcriptional modules related to proastrocytic differentiation and sprouty signaling in glioma. Cancer Res. 2010;70(24):10060–10070. - PubMed
    1. Doucette T, et al. Immune heterogeneity of glioblastoma subtypes: Extrapolation from the cancer genome atlas. Cancer Immunol Res. 2013;1(2):112–122. - PMC - PubMed
    1. Murat A, et al. Modulation of angiogenic and inflammatory response in glioblastoma by hypoxia. PLoS One. 2009;4(6):e5947. - PMC - PubMed

Publication types

MeSH terms

Substances