

Development of diabetes-induced acidosis in the rat retina
- PMID: 27262608
- PMCID: PMC4969123
- DOI: 10.1016/j.exer.2016.05.028
Development of diabetes-induced acidosis in the rat retina
Abstract
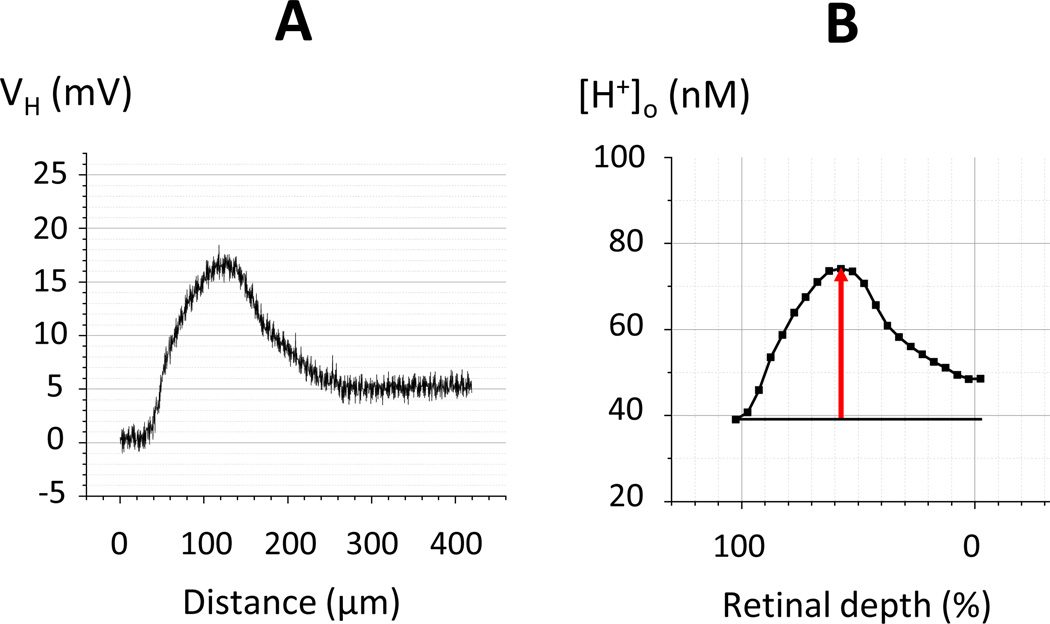
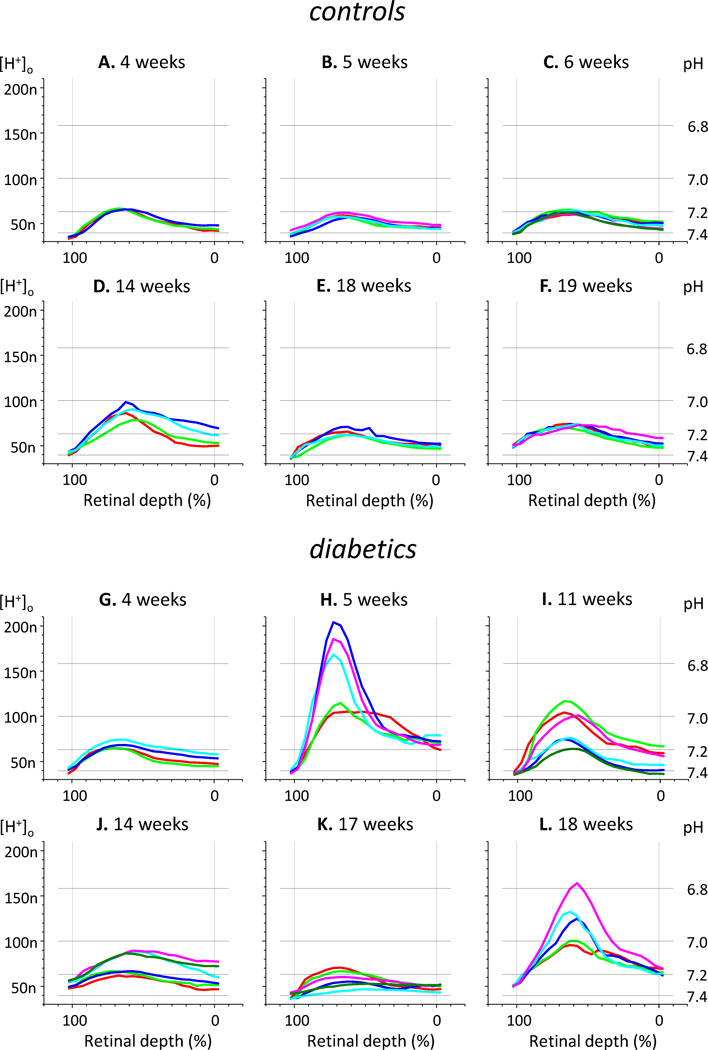
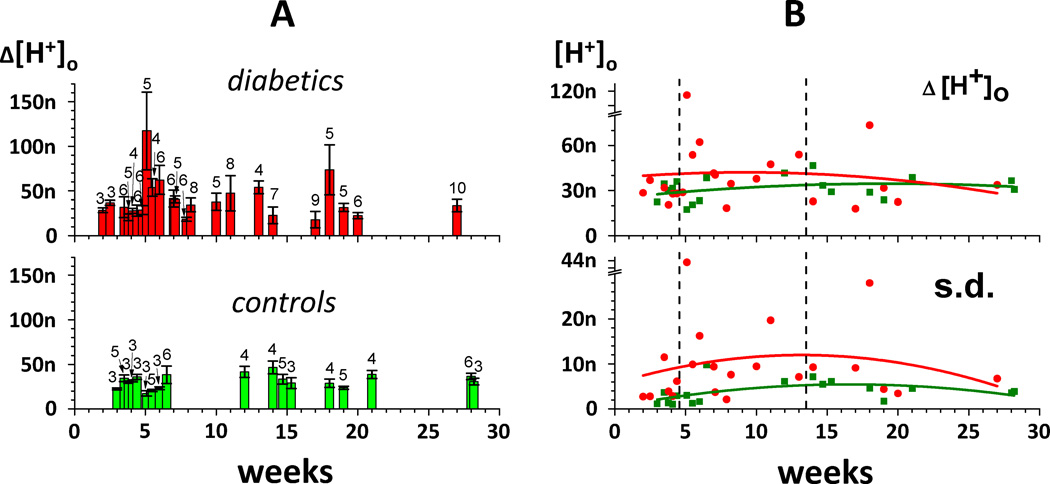
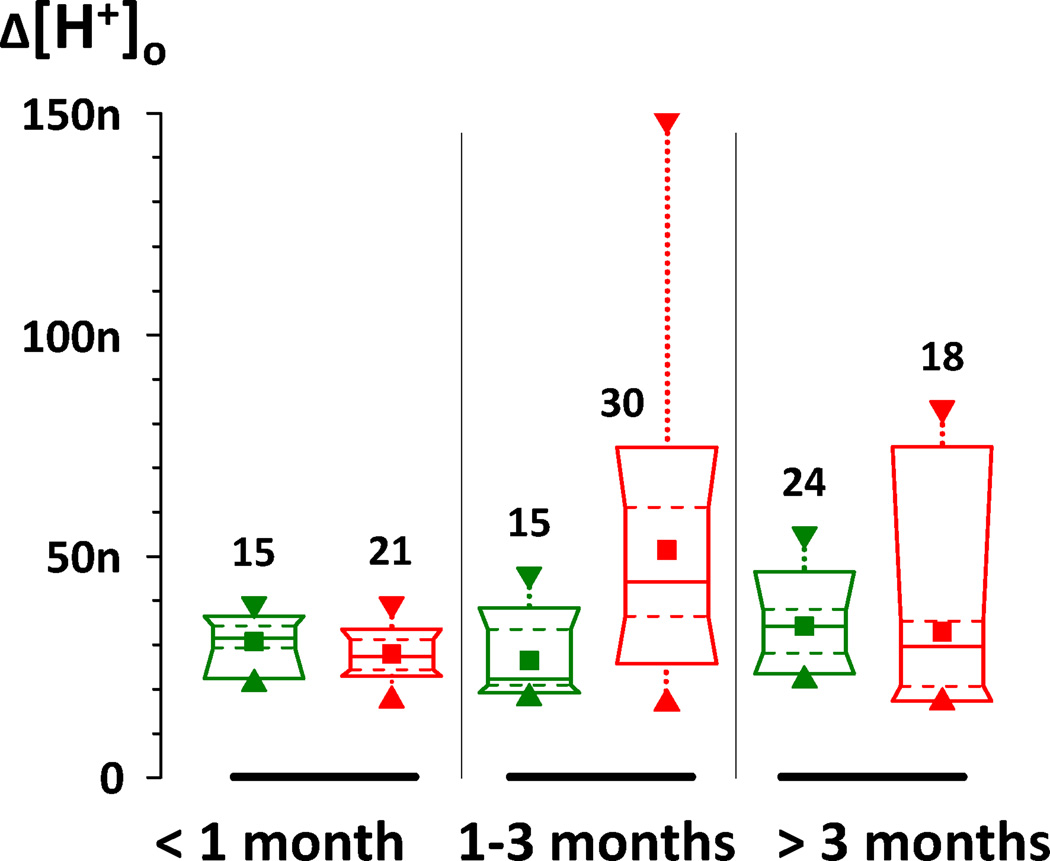
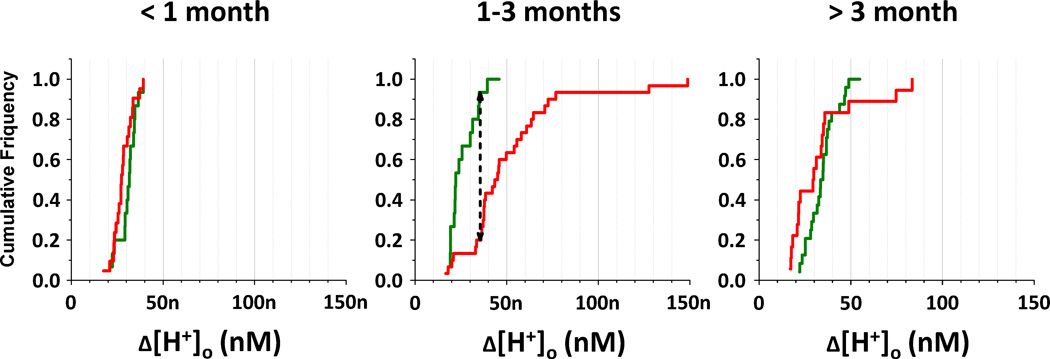
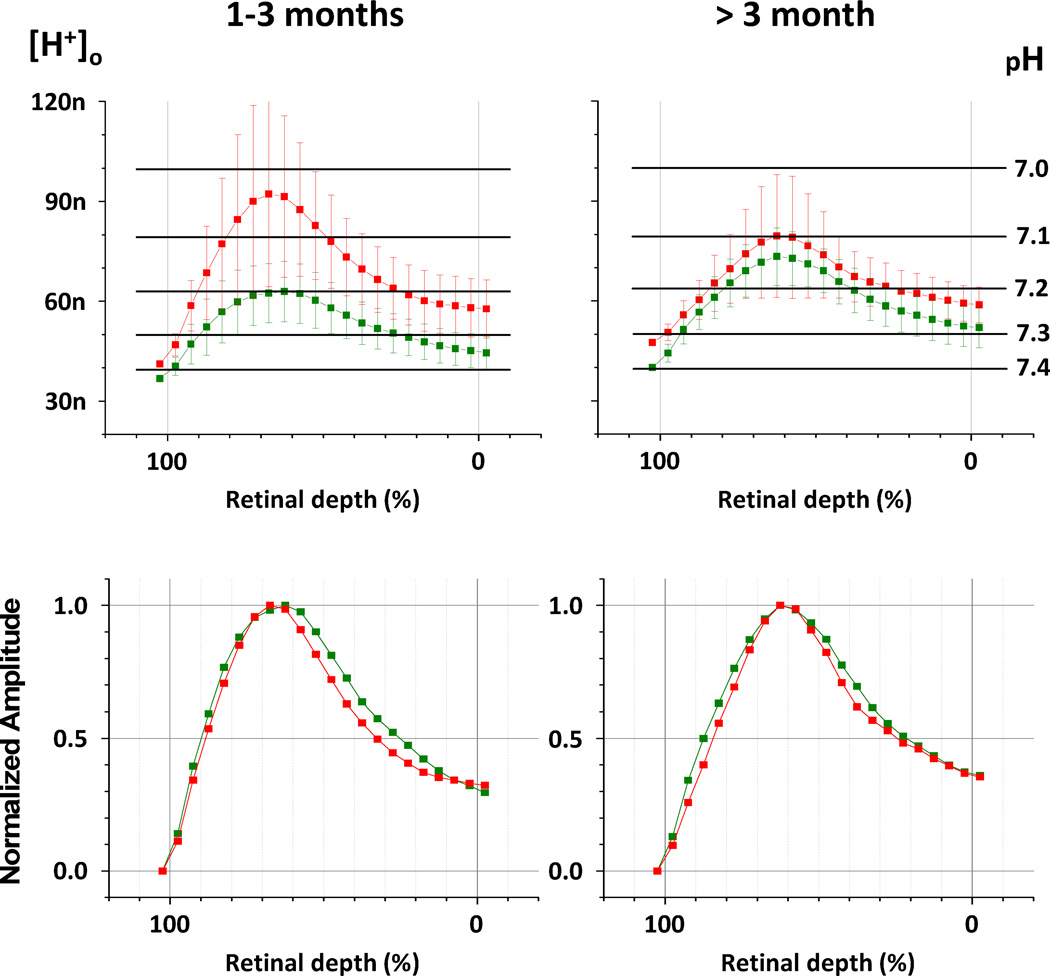
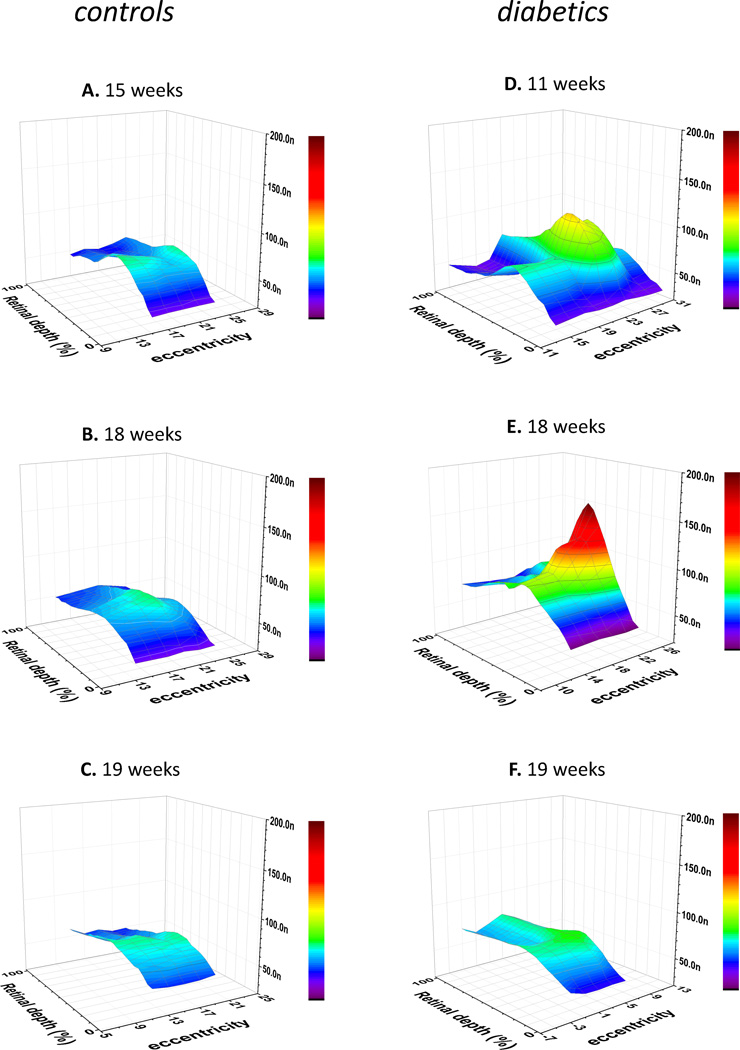
We hypothesized that the retina of diabetic animals would be unusually acidic due to increased glycolytic metabolism. Acidosis in tumors and isolated retina has been shown to lead to increased VEGF. To test the hypothesis we have measured the transretinal distribution of extracellular H(+) concentration (H(+)-profiles) in retinae of control and diabetic dark-adapted intact Long-Evans rats with ion-selective electrodes. Diabetes was induced by intraperitoneal injection of streptozotocin. Intact rat retinae are normally more acidic than blood with a peak of [H(+)]o in the outer nuclear layer (ONL) that averages 30 nM higher than H(+) in the choroid. Profiles in diabetic animals were similar in shape, but diabetic retinae began to be considerably more acidic after 5 weeks of diabetes. In retinae of 1-3 month diabetics the difference between the ONL and choroid was almost twice as great as in controls. At later times, up to 6 months, some diabetics still demonstrated abnormally high levels of [H(+)]o, but others were even less acidic than controls, so that the average level of acidosis was not different. Greater variability in H(+)-profiles (both between animals and between profiles recorded in one animal) distinguished the diabetic retinae from controls. Within animals, this variability was not random, but exhibited regions of higher and lower H(+). We conclude that retinal acidosis begins to develop at an early stage of diabetes (1-3 months) in rats. However, it does not progress, and the acidity of diabetic rat retina was diminished at later stages (3-6 months). Also the diabetes-induced acidosis has a strongly expressed local character. As result, the diabetic retinas show much wider variability in [H(+)] distribution than controls. pH influences metabolic and neural processes, and these results suggest that local acidosis could play a role in the pathogenesis of diabetic retinopathy.
Keywords: Acidosis; Diabetes; Ion-selective microelectrodes; Rat; Retina; Streptozotocin; pH.
Copyright © 2016 Elsevier Ltd. All rights reserved.
Figures
Similar articles
-
Light-induced pH changes in the intact retinae of normal and early diabetic rats.Exp Eye Res. 2016 Apr;145:148-157. doi: 10.1016/j.exer.2015.11.015. Epub 2015 Nov 27. Exp Eye Res. 2016. PMID: 26639389 Free PMC article.
-
pH in the vertebrate retina and its naturally occurring and pathological changes.Prog Retin Eye Res. 2025 Jan;104:101321. doi: 10.1016/j.preteyeres.2024.101321. Epub 2024 Nov 26. Prog Retin Eye Res. 2025. PMID: 39608565 Review.
-
Diabetes Alters pH Control in Rat Retina.Invest Ophthalmol Vis Sci. 2019 Feb 1;60(2):723-730. doi: 10.1167/iovs.18-26073. Invest Ophthalmol Vis Sci. 2019. PMID: 30786276 Free PMC article.
-
Intraretinal pH in diabetic cats.Curr Eye Res. 2005 Mar;30(3):229-40. doi: 10.1080/02713680590934067. Curr Eye Res. 2005. PMID: 15804749
-
Oxidative stress in diabetic retina.EXS. 1992;62:299-307. doi: 10.1007/978-3-0348-7460-1_30. EXS. 1992. PMID: 1450593 Review.
Cited by
-
Quantitative analysis of retinal vessel density and thickness changes in diabetes mellitus evaluated using optical coherence tomography angiography: a cross-sectional study.BMC Ophthalmol. 2021 Jun 15;21(1):259. doi: 10.1186/s12886-021-01988-2. BMC Ophthalmol. 2021. PMID: 34130654 Free PMC article.
-
Continuous Glucose Monitoring-Derived Metrics and Capillary Vessel Density in Subjects with Type 1 Diabetes without Diabetic Retinopathy.J Diabetes Res. 2023 Apr 15;2023:9516059. doi: 10.1155/2023/9516059. eCollection 2023. J Diabetes Res. 2023. PMID: 37096234 Free PMC article.
-
Light-induced pH changes in the intact retinae of normal and early diabetic rats.Exp Eye Res. 2016 Apr;145:148-157. doi: 10.1016/j.exer.2015.11.015. Epub 2015 Nov 27. Exp Eye Res. 2016. PMID: 26639389 Free PMC article.
-
Retinal oxygen: from animals to humans.Prog Retin Eye Res. 2017 May;58:115-151. doi: 10.1016/j.preteyeres.2017.01.003. Epub 2017 Jan 18. Prog Retin Eye Res. 2017. PMID: 28109737 Free PMC article. Review.
-
pH in the vertebrate retina and its naturally occurring and pathological changes.Prog Retin Eye Res. 2025 Jan;104:101321. doi: 10.1016/j.preteyeres.2024.101321. Epub 2024 Nov 26. Prog Retin Eye Res. 2025. PMID: 39608565 Review.
References
-
- Berkowitz BA, Bansal N, Wilson CA. Non-invasive measurement of steady-state vitreous lactate concentration. NMR in biomedicine. 1994;7:263–268. - PubMed
-
- Budzynski E, Wangsa-Wirawan N, Padnick-Silver L, Hatchell D, Linsenmeier R. Intraretinal pH in diabetic cats. Current eye research. 2005;30:229–240. - PubMed
-
- Dmitriev A, Pignatelli A, Piccolino M. Resistance of retinal extracellular space to Ca2+ level decrease: implications for the synaptic effects of divalent cations. Journal of neurophysiology. 1999;82:283–289. - PubMed
Publication types
MeSH terms
Substances
Grants and funding
LinkOut - more resources
Full Text Sources
Other Literature Sources
Medical
Research Materials
