Review
. 2016 Sep;26(9):640-654.
doi: 10.1016/j.tcb.2016.04.012. Epub 2016 Jun 1.

DNA Polymerases Divide the Labor of Genome Replication

Affiliations
Review

DNA Polymerases Divide the Labor of Genome Replication

Scott A Lujan et al. Trends Cell Biol. 2016 Sep.

Abstract

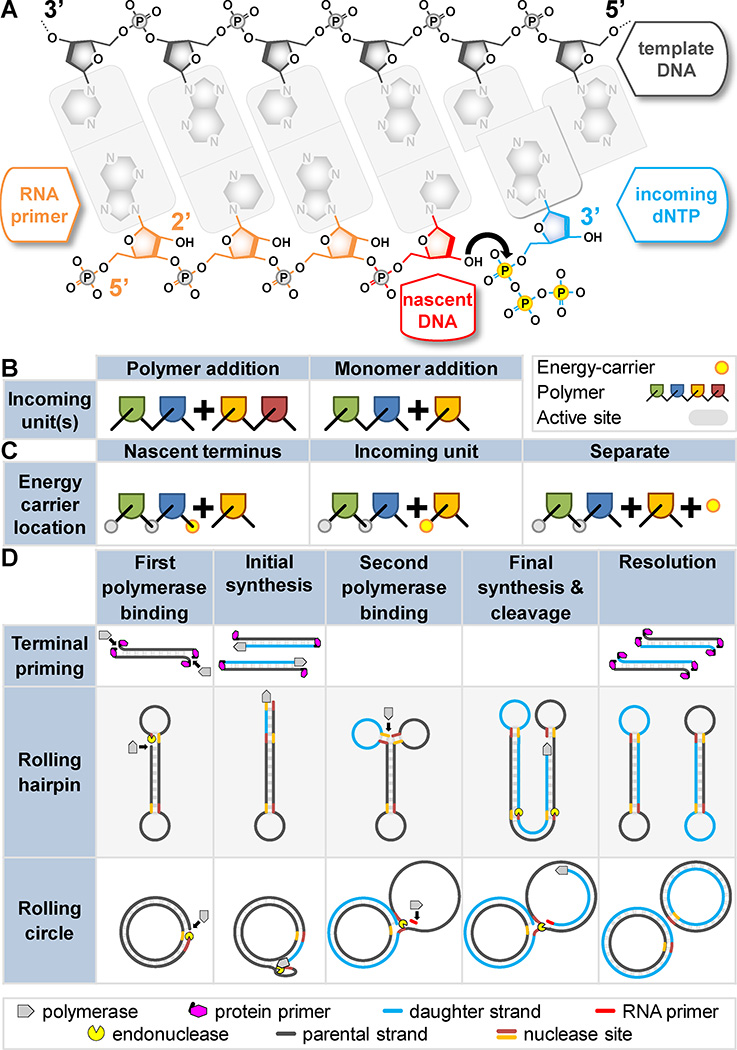
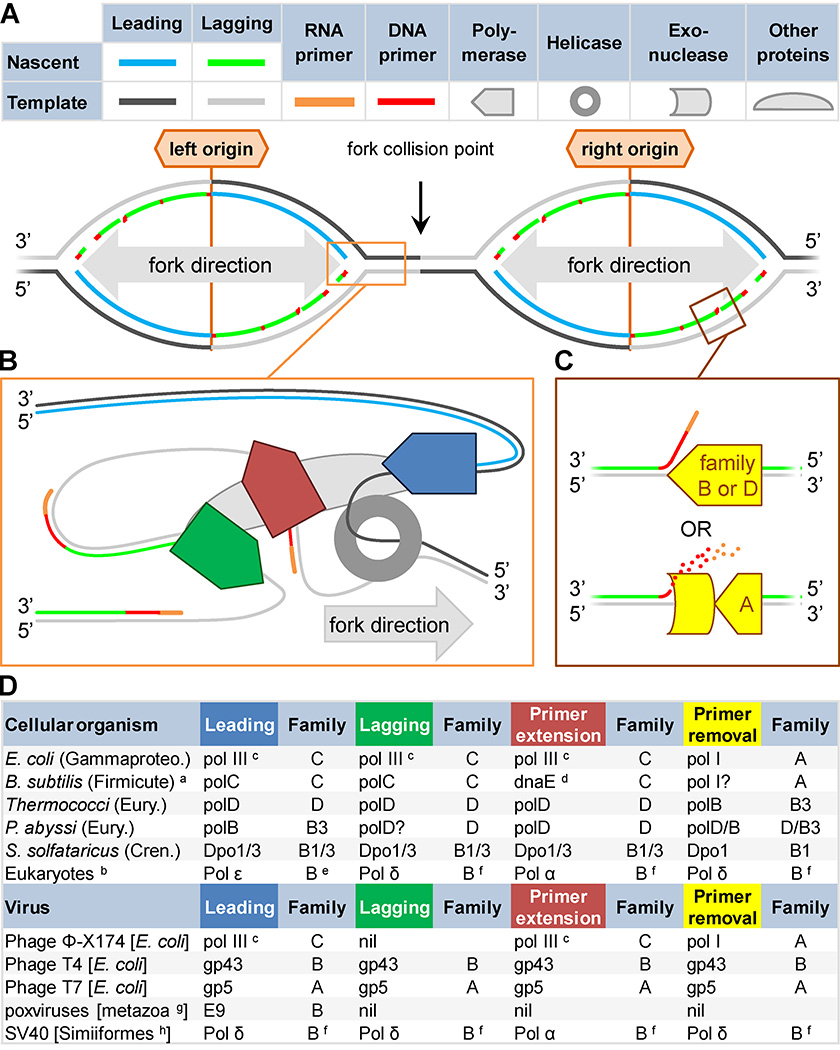
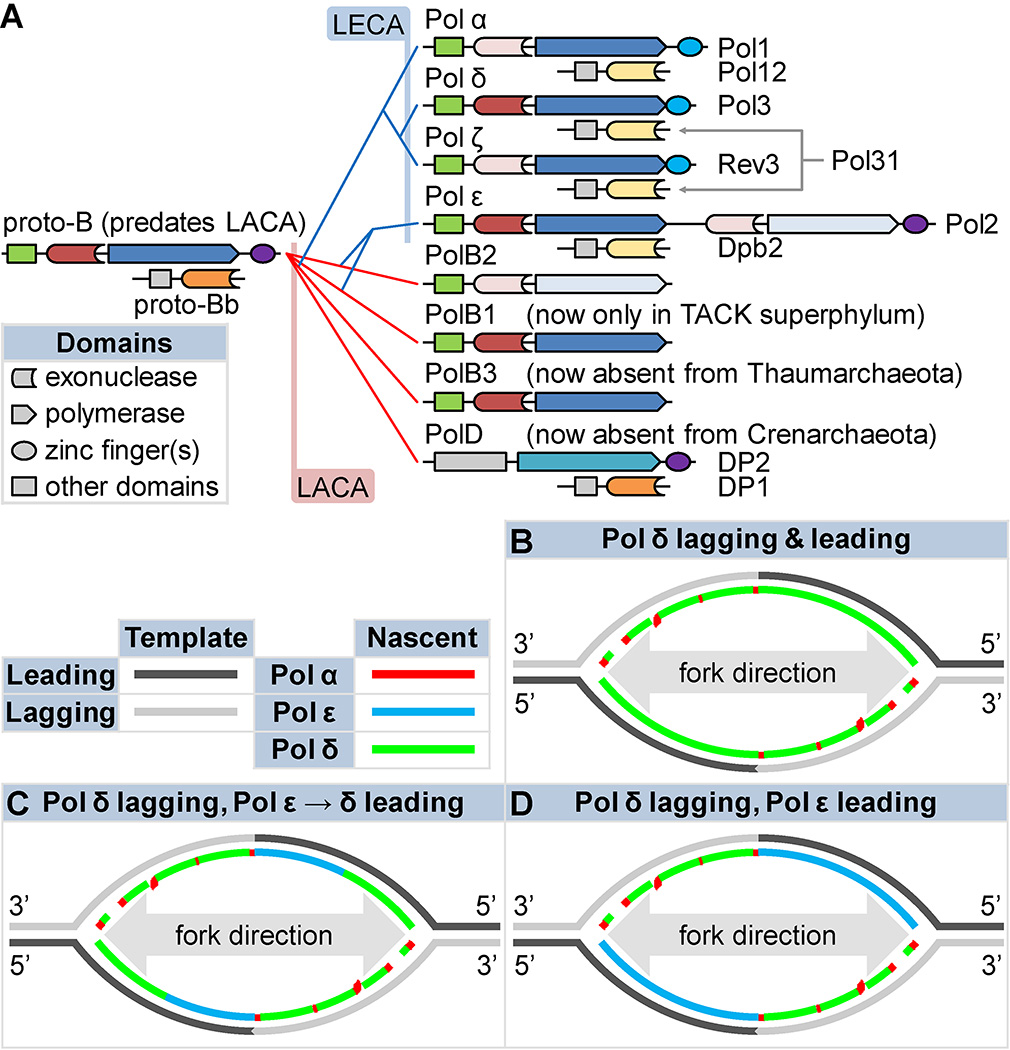
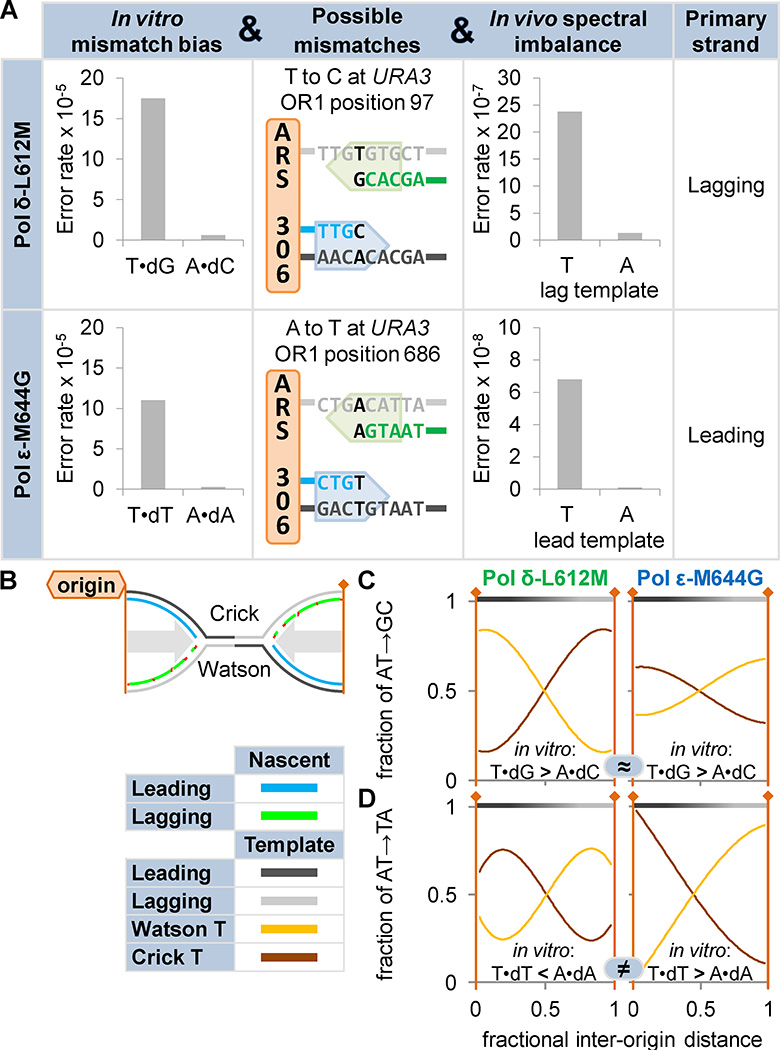
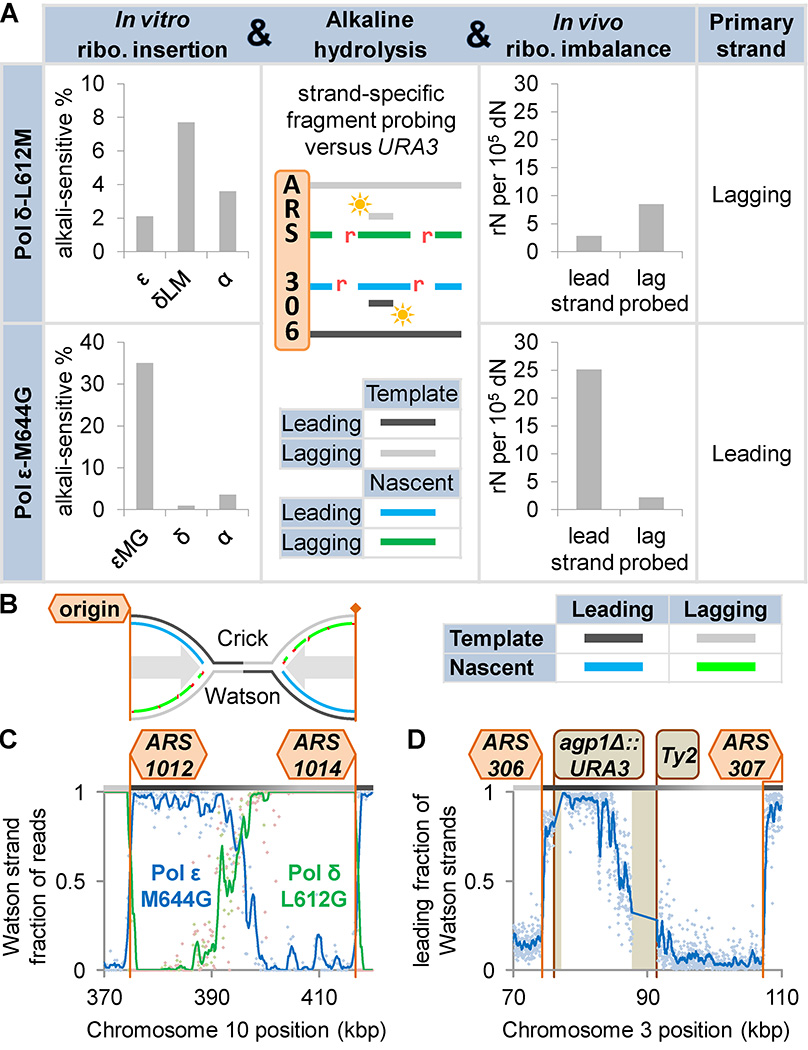
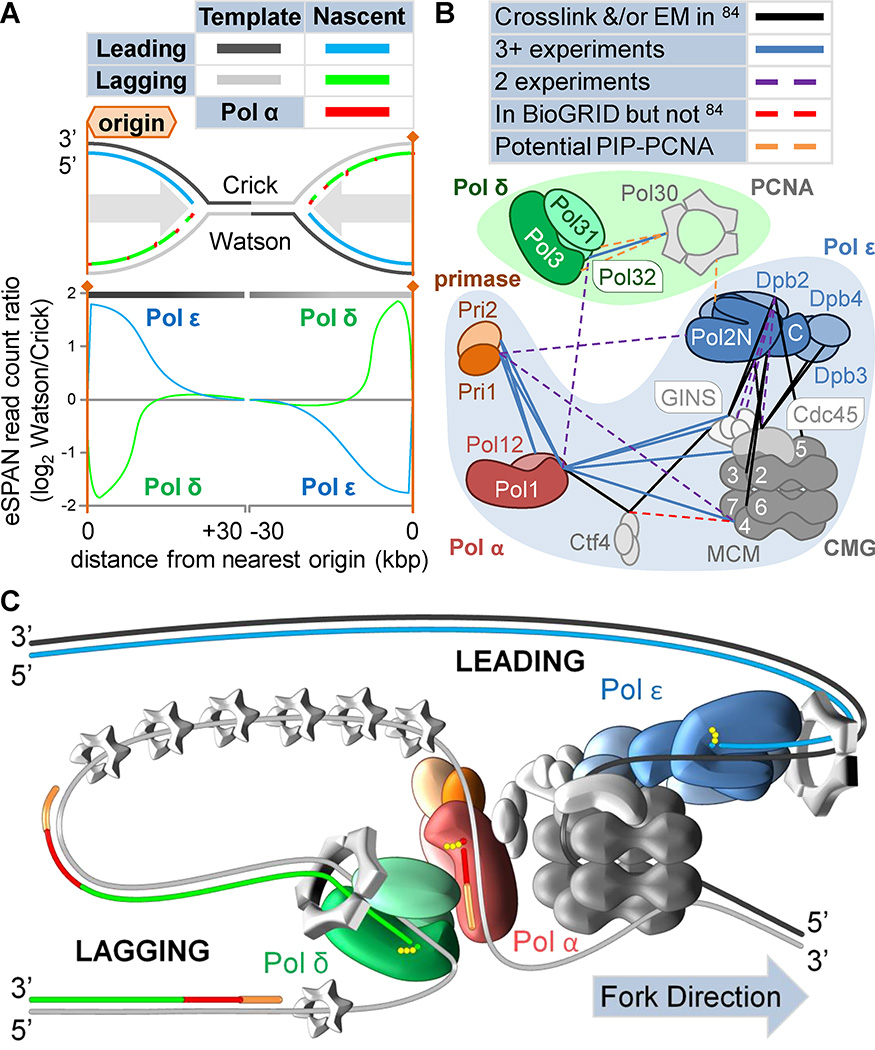
DNA polymerases synthesize DNA in only one direction, but large genomes require RNA priming and bidirectional replication from internal origins. We review here the physical, chemical, and evolutionary constraints underlying these requirements. We then consider the roles of the major eukaryotic replicases, DNA polymerases α, δ, and ɛ, in replicating the nuclear genome. Pol α has long been known to extend RNA primers at origins and on Okazaki fragments that give rise to the nascent lagging strand. Taken together, more recent results of mutation and ribonucleotide incorporation mapping, electron microscopy, and immunoprecipitation of nascent DNA now lead to a model wherein Pol ɛ and Pol δ, respectively, synthesize the majority of the nascent leading and lagging strands of undamaged DNA.

Keywords: DNA replication; evolution; genomic ribonucleotide; polymerase; replication fork.


Figures

Figure 1
Figure 1. Why DNA replication is asymmetric and how simple replicators cope
A) Termini of each DNA strand are named according to the hydroxyl groups on the deoxyribose sugar: 5’ and 3’ (labeled). DNA polymerases synthesize DNA via nucleophilic attack (black arrow) by the 3’ hydroxyl of the growing strand (the primer, red) on the α-phosphate of the incoming nucleotide triphosphate (blue). Chemical energy carried by the triphosphate (yellow) drives the reaction. RNA (orange) can also serve as a primer. RNA has a 2’ hydroxyl (labeled) that is absent in DNA. B–D) Genome synthesis could theoretically proceed by many modes. Arguments to which these panels refer hold for any hypothetical information-carrying polymer, thus polymer and terminal identities are herein deliberately ambiguous. Non-replicative polymerases and other enzymes show that alternate chemistries are possible, but replicases are limited: B) monomers (not polymers) are added in each synthesis step; C) the energy carrier is a moiety of the incoming monomer (not the growing strand or another reaction component); D) The leading/lagging asymmetry is avoidable. Terminal priming and rolling hairpin replication, sufficient for small linear genomes, require either a terminal-binding protein (magenta), or terminal hairpins (exposed single-strand), respectively. Rolling circle replication, sufficient for small circular genomes, requires RNA priming (red) on the second strand. Note: a stepwise nature is exaggerated for clarity; second strand synthesis is often simultaneous.
Figure 2
Figure 2. Organisms cope with the demands of simultaneous continuous and discontinuous replication in diverse ways
A) Inherent DNA asymmetry and obligate 5’-to-3’ directional synthesis mean that one nascent strand (leading; blue) is synthesized continuously while the other (lagging; green) is synthesized in short discontinuous stretches (Okazaki fragments), creating a forked structure (orange box). Synthesis is initiated with an RNA primer (orange), followed by a short DNA primer (red), at replication origins (labeled). Efficiency dictates that two forks proceed in opposite directions from each origin (bidirectional), resulting in collisions (black arrow). B) Replicases (pentagons) can specialize in different replicative roles: extension from the RNA primer (red); discontinuous Okazaki fragment synthesis (green); or continuous leading strand synthesis (blue). C) Polymerases may specialize in synthesis during primer removal (yellow shapes), either through primer displacement or exonucleolysis. D) Replicases are diverse. Polymerase family (A–D), and subfamily (e.g. B3) are indicated. Viral hosts are listed in square brackets. Except in eukaryotes and Escherichia coli, most analyses of polymerase roles in cellular organisms have relied on inferences based on in vitro capabilities. Superscripts: a, not typical of all Firmicutes, Clostridia not shown; b, most studied in Saccharomyces cerevisiae; c, class dnaE1; d, class dnaE3; e, possibly B1 or B2; f, possibly B3; g, observed in vertebrates and arthropods; h, monkeys and apes. Abbreviations: Gammaproteo.→Gammaproteobacteria; B.→Bacillus; Eury.→Euryarchaeota; Chren.→Crenarchaeota; P.→Pyrococcus; S.→Sulfolobus.
Figure 3
Figure 3. Origins of eukaryotic replicases and models for their division of labor
A) A speculative cladogram of eukaryotic (blue branches) and archaeal (red branches) B and D family polymerases based on. See the text for notes on the topology and rationale. Presumably, a proto-B family polymerase preceded the last common ancestors of Archaea and Eukaryota (LACA and LECA, respectively) and begat the archaeal and eukaryotic subclasses. Gene losses reduced the resulting set in both clades. LACA and LECA each possessed at least four subfamilies (B1–3 and D; α, δ, ε, and ζ, respectively). Family D is highly derived. Potential temporal positions of LACA and LECA are indicated (pink and blue areas, respectively). Schematics indicate domain architecture and activities. Catalytic subunits (right of schematics), associated B-subunits (right of schematics), and holoenzymes (above schematics) are indicated (Saccharomyces cerevisiae names for eukaryotes). Colors denote homology, with lighter shades indicating inactivation. B–D) Three models of eukaryotic replication origins, assuming that Pol α extends from RNA primers before passing synthesis to Pols δ and ε. B) Pol δ replicates the bulk of both DNA strands, as in SV40 viruses. C) Pols δ and ε replicate the lagging and leading strands, respectively. D) As in C, but Pol ε can cede the leading strand to Pol δ under special circumstances, .
Figure 4
Figure 4. DNA polymerase errors reveal the division of labor between eukaryotic replicases
A) Pols δ and ε variants Pol δ-L612M and Pol ε-M644G have wild type replication reduced and biased fidelity. For example, Pol δ-L612M makes T•dG errors more frequently than A•dC mispairs, 85, 86 and Pol ε-M644G makes T•dT more frequently than A•dA. Mutation rates at the URA3 reporter gene, inserted adjacent to the ARS306 replication origin on S. cerevisiae chromosome 3. Example mutation hotspots are shown. In all cases, substitution rates indicated a division of labor between Pols δ and ε, . In a Pol δ-L612M strain, the AT→GC mutation rate was higher with a lagging strand template T and Pol ε-M644G AT→TA rate was higher with a leading strand template T. B) A schematic of converging replication forks. C–D) Thousands of mutations were accumulated in mismatch repair-deficient S. cerevisiae bearing either Pol δ-L612M or Pol ε-M644G. C) Where these variants possess similar in vitro mutation biases (denoted “≈”; e.g. T•dG>A•dC), opposite bias patterns exist between adjacent origins. D) Where in vitro mutation biases are opposite (denoted “≠”; e.g. T•dT>A•dA versus T•dT<A•dA), similar bias patterns exist. Thus Pols δ and ε must operate on different strands. The logic used at the URA3 locus, applied across the genome, indicates that Pols δ and ε primarily replicate the lagging and leading strands, respectively.
Figure 5
Figure 5. Incorrect sugar incorporation reveals the division of labor between eukaryotic replicases
A) Pol δ-L612M and Pol ε-M644G also have higher in vitro ribonucleotide incorporation rates than wild type Pols α, δ, and ε, , , 87. Strand-specific probing of alkaline hydrolyzed genomic DNA (nicked at ribonucleotides; red) revealed increased fragmentation (increased ribonucleotide frequency) on the nascent lagging and leading strands for ribonuclease H2 (RNase H2)-deficient cells expressing Pol δ-L612M and Pol ε-M644G, respectively. RNase H2 nicks at ribonucleotides, initiating their excision. B) A schematic of converging replication forks. C) Pol δ-L612G (green) and Pol ε-M644G (blue) incorporate ribonucleotides into genomic DNA much more frequently than wild type Pols α, δ, or ε. Millions of ribonucleotides were mapped across S. cerevisiae and Schizosaccharomyces pombe genomes using four similar techniques (reviewed). For example, in RNase H2-deficient S. cerevisiae, Pol ε-M644G drives a Watson strand bias in genomic ribonucleotides to the right of origins, indicating Pol ε activity on the nascent leading strand. Pol δ-L612G biases indicate lagging strand activity. Data shown are background-subtracted. Lines represent 1 kb moving averages. D) Assuming this division of labor, more sophisticated noise removal allows the confirmation of replication strand assignments at the AGP1 locus, reaffirming conclusions from mutagenesis studies (see Figure 4).
Figure 6
Figure 6. Key Figure. Physical interactions, combined with previous evidence, suggest a model for the normal eukaryotic replication fork
A) A schematic of replication between adjacent origins and approximate traces of eSPAN data (enrichment and sequencing of protein-associated nascent DNA derived from). Bromodeoxyuridine incorporation, crosslinking, immunoprecipitation, and high throughput DNA sequencing together map replication protein interactions with nascent DNA. To the right of the average S. cerevisiae Group I origin, Pol ε is associated primarily with the Watson strand and Pol δ primarily with the Crick strand. Left of origins, associations are reversed. Comparison with the schematic in panel B suggests that Pols δ and ε are enriched on the nascent lagging and leading strands, respectively. B) A schematic representation of physical interactions detected between proteins at the replication fork (outlined shapes; S. cerevisiae nomenclature). Obligatory interactions are represented by shape overlaps. Lines indicate inter-complex interactions (bold names). Solid lines denote interactions observed via electron microscopy and/or crosslinking (black;) or by ≥3 experiments in the Biological General Repository for Interaction Datasets (BioGRID; blue;). Dashed lines indicate interactions in two BioGRID experiments (purple), in BioGRID but not in (red), or assumed via interacting motifs but not in BioGRID (orange;, 88). C) A model of the normal eukaryotic replication fork, influenced heavily by. Small grey trimeric rings represent RPA. Small spheres represent deoxyribonucleotide triphosphates. Compare with models in Figure 3 C–D. Strands are differentiated by color (RNA primer orange; otherwise as per key in A).

References

    1. Kornberg A, Baker TA. DNA replication. W.H. Freeman; 1992.
    1. Watson JD, Crick FH. Molecular structure of nucleic acids; a structure for deoxyribose nucleic acid. Nature. 1953;171:737–738. - PubMed
    1. Kainuma-Kuroda R, Okazaki R. Mechanism of DNA chain growth. XII. Asymmetry of replication of P2 phage DNA. J Mol Biol. 1975;94:213–228. - PubMed
    1. Kumar D, et al. Highly mutagenic and severely imbalanced dNTP pools can escape detection by the S-phase checkpoint. Nucleic Acids Res. 2010;38:3975–3983. - PMC - PubMed
    1. Kumar D, et al. Mechanisms of mutagenesis in vivo due to imbalanced dNTP pools. Nucleic Acids Res. 2011;39:1360–1371. - PMC - PubMed

Publication types

Substances

LinkOut - more resources