. 2016:133:139-63.
doi: 10.1016/bs.mcb.2016.03.003. Epub 2016 Apr 18.

Visualizing retinoic acid morphogen gradients

Affiliations

Visualizing retinoic acid morphogen gradients

T F Schilling et al. Methods Cell Biol. 2016.

Abstract

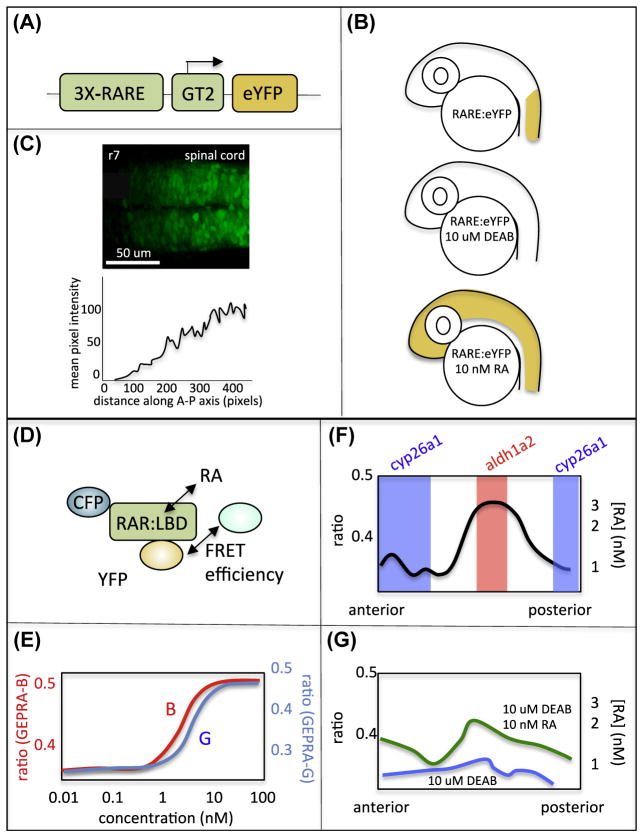
Morphogens were originally defined as secreted signaling molecules that diffuse from local sources to form concentration gradients, which specify multiple cell fates. More recently morphogen gradients have been shown to incorporate a range of mechanisms including short-range signal activation, transcriptional/translational feedback, and temporal windows of target gene induction. Many critical cell-cell signals implicated in both embryonic development and disease, such as Wnt, fibroblast growth factor (Fgf), hedgehog (Hh), transforming growth factor beta (TGFb), and retinoic acid (RA), are thought to act as morphogens, but key information on signal propagation and ligand distribution has been lacking for most. The zebrafish provides unique advantages for genetics and imaging to address gradients during early embryonic stages when morphogens help establish major body axes. This has been particularly informative for RA, where RA response elements (RAREs) driving fluorescent reporters as well as Fluorescence Resonance Energy Transfer (FRET) reporters of receptor binding have provided evidence for gradients, as well as regulatory mechanisms that attenuate noise and enhance gradient robustness in vivo. Here we summarize available tools in zebrafish and discuss their utility for studying dynamic regulation of RA morphogen gradients, through combined experimental and computational approaches.

Keywords: Diffusion; FRET; Morphogen; Retinoic acid; Rhombomere; Zebrafish.


Figures

FIGURE 1
FIGURE 1. Morphogen dynamics and regulation
(A) Standard representation of a morphogen gradient, adapted from L Wolpert’s “French flag” model. The solid line denotes the morphogen concentration (Y axis)—highest at its source to the right of a field of responding cells (X axis). Dotted lines denote concentration thresholds at which cells respond differently. Blue, white, and red regions represent three distinct cell fates. (B) Hypothetical noisy morphogen gradient (black line) that on average matches its smooth counterpart (white line). (C) Examples of positive and negative feedback on signal output. Through positive feedback, a given variable input (A—X axis in graph) can result in two stable outputs (Y axis in graph), with an intervening transition state (red). Similar input driving negative feedback can result in signal oscillations over time (X axis). (D) Scaling of a morphogen gradient as the field of cells over which it acts grows (X-axis). (See color plate)
FIGURE 2
FIGURE 2. Retinoic acid (RA) as a morphogen in hindbrain patterning
(A) Feedback in RA signaling. Signaling cell (left), responding cell (right). Vitamin A (retinol) transported by retinol-binding proteins (Rbps, light green rectangles) and Stra6 into cells or derived from retinyl esters via Lrat, associates with cellular retinol-binding proteins (Crbps, light red ovals). Retinol (black) is converted to retinal (red) and then to RA (yellow) by aldehyde dehydrogenases (Aldh1as). RA travels within cells bound to cellular RA-binding proteins (Crabps, light blue ovals), either to the nucleus to bind RARs (blue ovals) or to Cyp26s (red hexagon) associated with endoplasmic reticulum for degradation. Known positive (green, dashed arrows) feedback within the pathway includes Lrat, Crabps, Cyp26s, and RARs. Known negative (red lines) feedback includes Aldh1a2. (B) Rhombomeric organization in zebrafish. Eight rhombomeres (r1–8, anterior to the left) contain distinct sets of interneurons (blue) and motor neurons (V, trigeminal, purple; VII, facial, orange; X, vagal, green). (C) Shifting boundaries of RA degradation and hindbrain patterning based on RARE:lacZ transgenic reporters in mice. Model depicting rhombomeres at top, Cyp26s in blue, RA in red. An early Cyp26a1 domain sets the r2/3/hoxb1a expression boundary, a later Cyp26c1 (b1 in zebrafish) sets the r4/5/vhnf1 expression boundary, and Cyp26c1 expands posteriorly to demarcate the r6/7/hoxb4 boundary. (D) An integrated signaling network for hindbrain patterning. Model depicting rhombomeres at bottom, Cyp26a1 in blue, RA signaling in red, Fgf signaling in green, Wnt signaling in black. Cyp26-mediated degradation is continuously under feedback and feedforward control from Wnt, Fgf, and RA signaling, respectively, which shapes the RA gradient. (See color plate) Adapted from White, R.J. & Schilling, T.F. (2008). How degrading: Cyp26s in hindbrain development. Developmental Dynamics, 237, 27752790. http://dx.doi.org/10.1002/dvdy.21695 and Schilling, T.F., Nie, Q. & Lander, A.D. (2012). Dynamics and precision in retinoic acid morphogen gradients. Current Opinion in Genetics and Development, 22, 562569. http://dx.doi.org/10.1016/j.gde.2012.11.012.
FIGURE 3
FIGURE 3. Visualizing the Retinoic acid (RA) morphogen gradient
(A) Construct (RARE:eYFP) most commonly used to monitor RA signaling in zebrafish, containing three RA response elements (RAREs) from the mouse RARb gene, a GATA-2 basal promoter (GT2), and an enhanced yellow fluorescent protein (eYFP) (Perz-Edwards et al., 2001). (B) RARE:eYFP transgenic zebrafish embryos show expression in the spinal cord, which is lost with 10 μM DEAB treatments and induced throughout the CNS with application of 10 nM exogenous RA. (C) Confocal image of RARE-YFP fluorescence at 24 hpf (upper panel, dorsal view, anterior to the left) and quantification of YFP fluorescence at the hindbrain/spinal cord boundary (lower panel). (Adapted from White, R.J., Nie, Q., Lander, A.D. & Schilling, T.F. (2007). Complex regulation of cyp26a1 creates a robust retinoic acid gradient in the zebrafish embryo. PLoS Biol, 5, e304.) (D) GEPRA reporters based on the RAR ligand-binding domain (LBD) and fused to CFP and YFP. (E) Dose-response shows sensitivity between 1 and 10 nM of GEPRA-B (red) and GEPRA-G (blue) reporters. (F) Graph based on ratiometric imaging of GEPRA fluorescence intensity measured at 12 hpf reveals graded RA levels between 0.5 and 3 nM, distributed along the anterior–posterior axis (X axis) between its source in the domain of aldh1a2 expression (red) and both anterior and posterior domains of cyp26a1 expression (blue). (G) GEPRA measurements of RA levels in embryos treated with DEAB (RA depleted, blue line) and simultaneously treated with 10 μM DEAB and 10 nM RA (green line), which partially restores the gradient. (See color plate) Adapted from Shimozono, S., Iimura, T., Kitaguchi, T., Higashijima, S. & Miyawaki, A. (2013). Visualization of an endogenous retinoic acid gradient across embryonic development. Nature, 496, 363366. http://dx.doi.org/10.1038/nature12037.
FIGURE 4
FIGURE 4. Negative feedback through Cyp26a1 and Crabp2a improve gradient robustness
(A) Induction of cyp26a1 expression (purple) by a bead soaked in 100 μM retinoic acid (RA) (right panel) implanted into the hindbrain region of a DEAB-treated embryo, in contrast to a control DMSO-soaked bead (left panel). Dorsal views, anterior to the left. (B) Induction of hoxb5a expression (purple) by an RA-soaked bead implanted into DEAB-treated embryos extends over a longer range in an embryo depleted of Cyp26a1 (injected with a Cyp26a1-MO). (C) Induction of crabp2a expression (purple) by treatment of an embryo with 10 nM RA extends throughout the hindbrain and correlates with loss of markers of anterior rhombomeres such as krox20 (red) in r3 and r5. (D) Induction of hoxd4a expression (purple) by treatment with 1 nM RA extends up to the r4/5 boundary in an embryo depleted of Crabp2a (injected with a Crabp2a-MO). (E) Bound and unbound states of RA within responding cells and paths to degradation, which are included in computational models. (F) Left graph, robustness index (E—formula shown below) comparing experimental (red) and reference (black) gradients by where they cross two thresholds (y1, y2). Right graphs show two examples of probability density distributions (percentages, Y axis) of E values (X axis) for models that either include binding proteins (blue lines) or do not (black lines) with either a 5-fold or 10-fold increase in RA synthesis rate. (See color plate) Adapted from White, R.J., Nie, Q., Lander, A.D. & Schilling, T.F. (2007). Complex regulation of cyp26a1 creates a robust retinoic acid gradient in the zebrafish embryo. PLoS Biology, 5, e304 and Cai, A.Q., Radtke, K., Linville, A., Lander, A.D., Nie, Q. & Schilling, T.F. (2012). Cellular retinoic acid-binding proteins are essential for hindbrain patterning and signal robustness in zebrafish. Development, 139, 21502155.
FIGURE 5
FIGURE 5. Noise-induced switching and boundary sharpening in response to retinoic acid (RA)
(A) Rhombomere boundary sharpening. Hypothetical roles of cell sorting versus plasticity in sharpening of two stripes of krox20 expression (red) in r3 and r5 in a zebrafish embryonic hindbrain (dorsal view) between 11.0 and 12.5 hpf (left panel). Model depicting sharpening of the “transition zone” between two rhombomeres (r4, hoxb1a, green; r5, krox20, red), which normally occurs posterior to the final boundary (dashed black line) and contains cells expressing both genes. Green line indicates alternate boundary that can form if sharpening occurs at a more posterior position. (B) Noise-induced switching at the r4/5 boundary. (left panel) The model includes extracellular RA levels (RA)out, intracellular levels (RA)in, self-enhanced degradation through Cyp26a1 induction, and mutual inhibition between Hoxb1 and Krox20. (upper right panel) RA fluctuations combined with the gene regulatory network lead to fluctuations in target gene expression (green and red cells) near the boundary. (lower right panel) Noise in gene expression helps push cells into one of two stable states in the bistable region (green to red). (C) Evidence for an r4/5 transition zone. Diagram of double fluorescent in situ hybridization experiments demonstrating cells coexpressing hoxb1a (green) and krox20 (red), largely posterior to the future boundary. (D) Modeling suggests that noise-induced switching improves sharpening. Simulations using the model shown in B resolve into rhombomere-like domains of gene expression (Y axis) along a 200-μm stretch along the anterior–posterior axis (X axis) (left graph). Noise in (RA)in alone results in failure of r4/5 boundary to sharpen (middle graph). Noise in both (RA)in and in gene expression restores sharpening (right graph). (See color plate) Adapted from Zhang, L., Radtke, K., Zheng, L., Cai, A.Q., Schilling, T.F. & Nie, Q. (2012). Noise drives sharpening of gene expression boundaries in the zebrafish hindbrain. Molecular Systems Biology, 8, 613 and Schilling, T.F., Nie, Q. & Lander, A.D. (2012). Dynamics and precision in retinoic acid morphogen gradients. Current Opinion in Genetics and Development, 22, 562569. http://dx.doi.org/10.1016/j.gde.2012.11.012.

Similar articles

Cited by

References

    1. Alexander C, Zuniga E, Blitz IL, Wada N, Le Pabic P, Javidan Y, … Schilling TF. Combinatorial roles for BMPs and endothelin 1 in patterning the dorsal-ventral axis of the craniofacial skeleton. Development. 2011;138:5135–5146. http://dx.doi.org/10.1242/dev.067801. - DOI - PMC - PubMed
    1. Alexandre C, Baena-Lopez A, Vincent JP. Patterning and growth control by membrane-tethered Wingless. Nature. 2014;505:180–185. - PMC - PubMed
    1. Astrom A, Tavakkol A, Pettersson U, Cromie M, Elder JT, Voorhees JJ. Molecular cloning of two human cellular retinoic acid-binding proteins (CRABP). Retinoic acid-induced expression of CRABP-II but not CRABP-I in adult human skin in vivo and in skin fibroblasts in vitro. Journal of Biological Chemistry. 1991;266:17662–17666. - PubMed
    1. Balasubramanian R, Zhang X. Mechanisms of FGF gradient formation during embryogenesis. Seminars in Cell and Developmental Biology. 2015 http://dx.doi.org/10.1016/j.semcdb.2015.10.004. pii:S1084–9521(15)00189-5. - DOI - PMC - PubMed
    1. Begemann G, Schilling TF, Rauch GJ, Geisler R, Ingham PW. The zebrafish neckless mutation reveals a requirement for raldh2 in mesodermal signals that pattern the hindbrain. Development. 2001;128:3081–3094. - PubMed

Publication types

MeSH terms